In the dynamic semiconductor industry, Applied Materials, Inc. (AMAT) and Qnity Electronics, Inc. (Q) stand out as key players driving innovation and shaping market trends. Both companies focus on advanced manufacturing solutions and materials essential to chip production, but they differ in scale and market presence. This article explores their strengths and strategies to help you decide which company could be a more compelling addition to your investment portfolio.
Table of contents
Companies Overview
I will begin the comparison between Applied Materials and Qnity Electronics by providing an overview of these two companies and their main differences.
Applied Materials Overview
Applied Materials, Inc. provides manufacturing equipment, services, and software to the semiconductor, display, and related industries. Operating through segments like Semiconductor Systems and Applied Global Services, it offers technologies for chip fabrication and display manufacturing. Founded in 1967, the company is a leading player in semiconductor equipment, with a global presence including the US, Asia, and Europe.
Qnity Electronics Overview
Qnity Electronics, Inc. specializes in electronic solutions and materials for semiconductor chip manufacturing and advanced electronic materials. Formerly Novus SpinCo 1, it rebranded in April 2025. Based in Wilmington, Delaware, Qnity is a newer market entrant focused on supplying key materials essential to semiconductor production processes.
Key similarities and differences
Both Applied Materials and Qnity Electronics operate in the semiconductor industry within the technology sector, serving chip manufacturing needs. Applied Materials has a broader scope with equipment, services, and software offerings, whereas Qnity concentrates on electronic solutions and materials. Applied Materials is a well-established firm with a large workforce, while Qnity is a recently public company with a more specialized product focus.
Income Statement Comparison
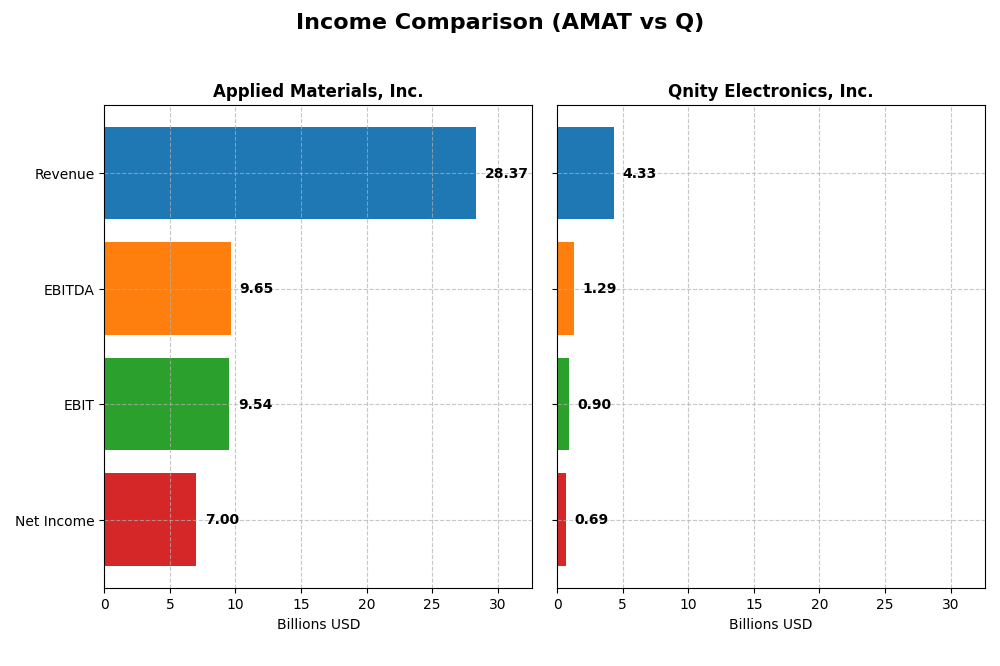
The table below presents a side-by-side comparison of key income statement metrics for Applied Materials, Inc. and Qnity Electronics, Inc. for their most recent fiscal years.
| Metric | Applied Materials, Inc. (AMAT) | Qnity Electronics, Inc. (Q) |
|---|---|---|
| Market Cap | 259B | 20.2B |
| Revenue | 28.4B | 4.34B |
| EBITDA | 9.65B | 1.29B |
| EBIT | 9.54B | 898M |
| Net Income | 7.00B | 693M |
| EPS | 8.71 | 3.31 |
| Fiscal Year | 2025 | 2024 |
Income Statement Interpretations
Applied Materials, Inc.
Applied Materials shows steady revenue growth from 23B in 2021 to 28.4B in 2025, with net income rising from 5.9B to 7B over the same period. Margins remain strong, with a gross margin near 48.7% and net margin around 24.7%. In 2025, revenue growth slowed to 4.4%, net margin slightly declined, but EBIT margin improved, reflecting effective cost management.
Qnity Electronics, Inc.
Qnity Electronics’ revenue fluctuated, declining overall from 4.76B in 2022 to 4.34B in 2024, with net income falling from 774M to 693M. Margins are healthy, with a gross margin of 46.1% and a net margin near 16%. The latest year showed a 7.4% revenue increase and strong EBIT and net margin growth, indicating improving profitability despite overall negative trends.
Which one has the stronger fundamentals?
Applied Materials demonstrates stronger fundamentals with consistent revenue and net income growth over five years, higher margins, and favorable evaluations on key profit metrics. Qnity Electronics shows recent operational improvements but faces unfavorable trends in long-term revenue and earnings growth. Overall, Applied Materials’ income statement reflects more stable and robust financial health.
Financial Ratios Comparison
The table below presents the most recent financial ratios for Applied Materials, Inc. (AMAT) and Qnity Electronics, Inc. (Q) based on their latest fiscal year data, offering a straightforward comparison of key metrics.
| Ratios | Applied Materials, Inc. (AMAT) | Qnity Electronics, Inc. (Q) |
|---|---|---|
| ROE | 34.28% | 6.51% |
| ROIC | 21.96% | 5.92% |
| P/E | 26.58 | 28.80 |
| P/B | 9.11 | 1.88 |
| Current Ratio | 2.61 | 1.77 |
| Quick Ratio | 1.87 | 1.06 |
| D/E | 0.35 | 0.02 |
| Debt-to-Assets | 19.42% | 1.56% |
| Interest Coverage | 30.81 | 3.03 |
| Asset Turnover | 0.78 | 0.35 |
| Fixed Asset Turnover | 5.54 | 2.59 |
| Payout ratio | 19.78% | 0% |
| Dividend yield | 0.74% | 0% |
Interpretation of the Ratios
Applied Materials, Inc.
Applied Materials exhibits predominantly strong financial ratios, including a favorable net margin of 24.67% and a robust return on equity of 34.28%, highlighting efficient profitability and shareholder value creation. The company maintains a solid current ratio at 2.61, indicating good short-term liquidity, though the elevated price-to-earnings ratio of 26.58 suggests valuation caution. It pays dividends with a modest yield of 0.74%, supported by sustainable free cash flow coverage and balanced buyback activity.
Qnity Electronics, Inc.
Qnity Electronics shows mixed ratio strength with a favorable net margin of 15.99% and a low debt-to-assets ratio of 1.56%, indicating prudent leverage management. However, its return on equity stands at a weak 6.51%, signaling limited profitability for shareholders. The current ratio of 1.77 suggests adequate liquidity. The company does not currently pay dividends, likely reflecting its recent IPO status and focus on reinvestment for growth and R&D priorities.
Which one has the best ratios?
Applied Materials has the stronger overall ratio profile, scoring 64.29% favorable ratios compared to Qnity’s 42.86%, with superior profitability, liquidity, and leverage metrics. While Applied Materials faces some valuation and dividend yield concerns, Qnity’s lower returns and absence of dividends reflect its earlier development stage, making Applied Materials more established in its financial fundamentals.
Strategic Positioning
This section compares the strategic positioning of Applied Materials, Inc. and Qnity Electronics, Inc. in terms of market position, key segments, and exposure to technological disruption:
Applied Materials, Inc. (AMAT)
- Leading semiconductor equipment provider with significant market cap and competitive pressure.
- Operates three main segments: Semiconductor Systems, Applied Global Services, Display and Adjacent Markets.
- Exposure to technological disruption through advanced semiconductor manufacturing technologies and automation software.
Qnity Electronics, Inc. (Q)
- Smaller market cap focused on electronic solutions for semiconductor manufacturing.
- Concentrates on electronic solutions and advanced materials for semiconductor chip manufacturing.
- Focused on electronic solutions, no explicit data on technological disruption exposure.
AMAT vs Q Positioning
AMAT has a diversified business model across multiple segments including manufacturing equipment and services, while Q is more concentrated on electronic solutions and materials. AMAT’s broad segmentation supports resilience, whereas Q’s narrower focus may limit market reach but allows specialization.
Which has the best competitive advantage?
AMAT shows a slightly favorable moat with value creation despite declining profitability, indicating some competitive advantage. Q has a neutral moat status with stable but no clear value creation, suggesting limited competitive advantage currently.
Stock Comparison
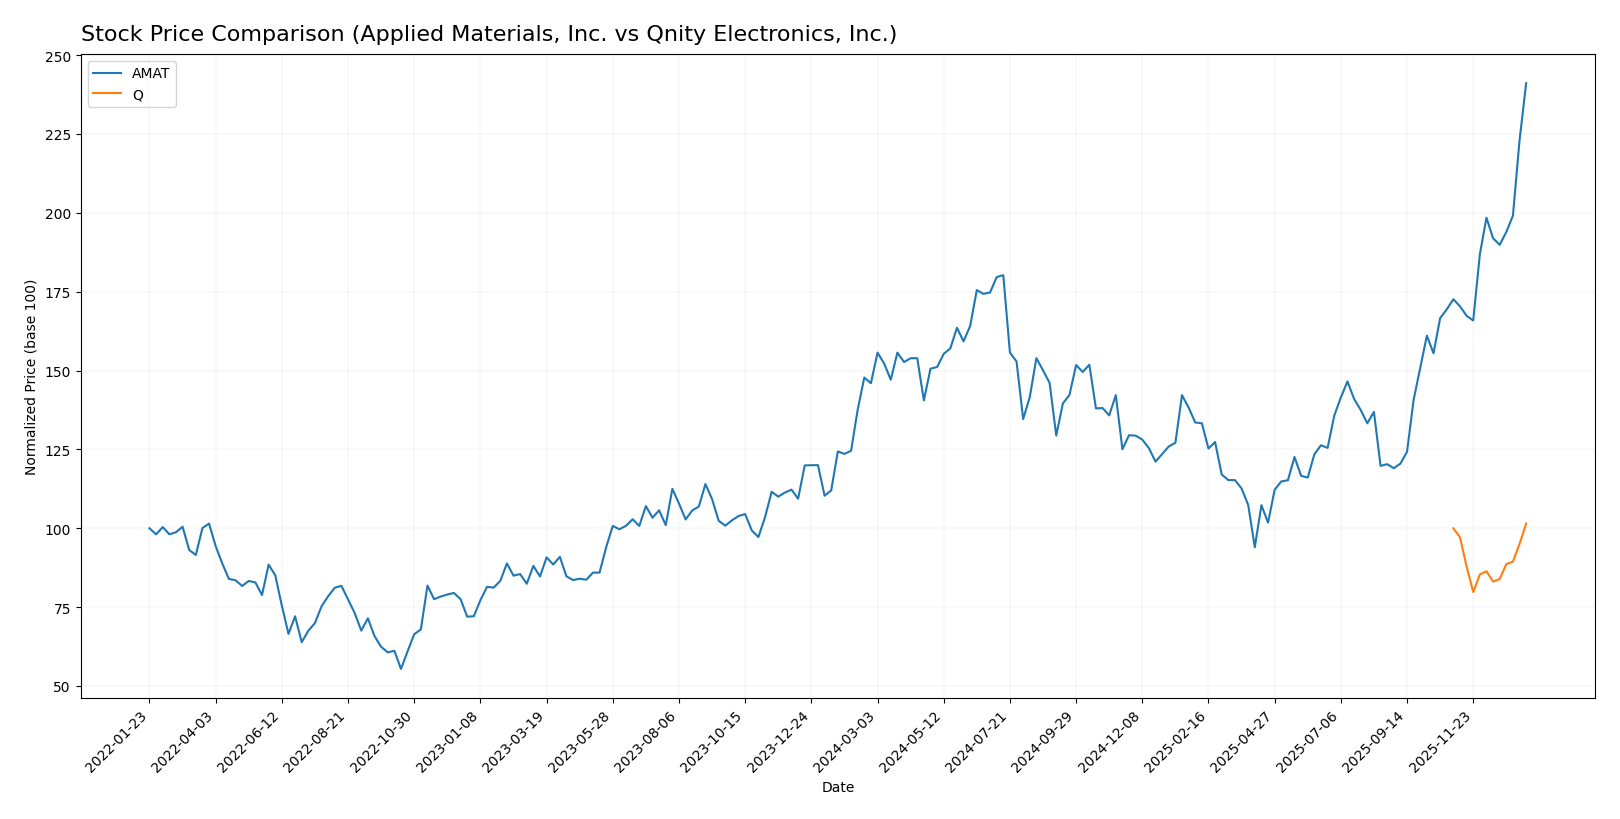
The stock prices of Applied Materials, Inc. and Qnity Electronics, Inc. have shown marked divergence over the past year, with notable gains and distinct trading volume trends shaping their market dynamics.
Trend Analysis
Applied Materials, Inc. (AMAT) experienced a strong bullish trend over the past 12 months, with a 65.15% price increase and accelerating momentum. The stock showed high volatility, ranging from 126.95 to 325.6.
Qnity Electronics, Inc. (Q) recorded a slight 1.5% price increase over the past year, indicating a neutral trend with stable acceleration and low volatility between 75.8 and 96.42.
Comparing both, AMAT delivered significantly higher market performance than Q, reflecting a robust upward trend versus a nearly flat price movement.
Target Prices
The consensus target prices from recognized analysts provide a clear outlook for these semiconductor companies.
| Company | Target High | Target Low | Consensus |
|---|---|---|---|
| Applied Materials, Inc. | 400 | 273 | 323.43 |
| Qnity Electronics, Inc. | 117 | 92 | 105.89 |
Applied Materials’ consensus target price is slightly below its current price of $325, suggesting a stable to modest upside. Qnity Electronics shows potential for notable growth from its current $96.67 price, according to analyst expectations.
Analyst Opinions Comparison
This section compares analysts’ ratings and grades for Applied Materials, Inc. (AMAT) and Qnity Electronics, Inc. (Q):
Rating Comparison
AMAT Rating
- Rating: B+ with a very favorable status.
- Discounted Cash Flow Score: 3, indicating moderate valuation based on cash flows.
- ROE Score: 5, very favorable, reflecting efficient profit generation from equity.
- ROA Score: 5, very favorable, demonstrating strong asset utilization.
- Debt To Equity Score: 2, moderate, suggesting moderate financial risk.
- Overall Score: 3, moderate overall financial standing.
Q Rating
- Rating: B+ with a very favorable status.
- Discounted Cash Flow Score: 4, showing favorable valuation on future cash flows.
- ROE Score: 3, moderate efficiency in generating profit from shareholders’ equity.
- ROA Score: 4, favorable, indicating effective use of assets to generate earnings.
- Debt To Equity Score: 3, moderate, indicating a balanced debt level relative to equity.
- Overall Score: 3, moderate overall financial standing.
Which one is the best rated?
Both AMAT and Q share the same overall rating of B+ with moderate overall scores. AMAT excels in return on equity and assets, while Q scores better in discounted cash flow and debt-to-equity metrics, making their ratings similarly balanced based on the data provided.
Scores Comparison
The scores comparison between Applied Materials, Inc. (AMAT) and Qnity Electronics, Inc. (Q) is as follows:
AMAT Scores
- Altman Z-Score: 13.45, indicating a safe zone with low bankruptcy risk.
- Piotroski Score: 7, categorized as strong financial health.
Q Scores
- No data available.
- No data available.
Which company has the best scores?
Based on the provided data, AMAT has clearly defined scores showing strong financial health and very low bankruptcy risk, while Q lacks any available score information for comparison.
Grades Comparison
Here is a comparison of the recent grades assigned to Applied Materials, Inc. and Qnity Electronics, Inc.:
Applied Materials, Inc. Grades
The table below shows the latest grades from respected grading companies for Applied Materials, Inc.:
| Grading Company | Action | New Grade | Date |
|---|---|---|---|
| B of A Securities | Maintain | Buy | 2026-01-13 |
| Susquehanna | Upgrade | Positive | 2026-01-12 |
| Cantor Fitzgerald | Maintain | Overweight | 2026-01-08 |
| B. Riley Securities | Maintain | Buy | 2025-12-18 |
| Mizuho | Maintain | Neutral | 2025-12-17 |
| Wells Fargo | Maintain | Overweight | 2025-12-15 |
| Jefferies | Maintain | Buy | 2025-12-15 |
| Keybanc | Maintain | Overweight | 2025-12-02 |
| UBS | Upgrade | Buy | 2025-11-25 |
| B. Riley Securities | Maintain | Buy | 2025-11-14 |
Overall, Applied Materials shows a strong consensus favoring Buy and Overweight ratings with several recent upgrades and mostly stable positive views.
Qnity Electronics, Inc. Grades
The following table summarizes the grades assigned to Qnity Electronics, Inc.:
| Grading Company | Action | New Grade | Date |
|---|---|---|---|
| RBC Capital | Maintain | Outperform | 2025-11-25 |
| Mizuho | Maintain | Outperform | 2025-11-20 |
Qnity Electronics has a consistent Outperform rating from the two grading firms, showing stable positive sentiment without upgrades or downgrades recently.
Which company has the best grades?
Applied Materials, Inc. has received more numerous and diverse positive grades, including Buy and Overweight ratings with some recent upgrades. Qnity Electronics, Inc. shows stable Outperform ratings but from fewer sources. Investors might interpret Applied Materials’ broader positive consensus as a stronger market endorsement compared to Qnity’s more limited but favorable outlook.
Strengths and Weaknesses
Below is a comparative table highlighting key strengths and weaknesses of Applied Materials, Inc. (AMAT) and Qnity Electronics, Inc. (Q) based on recent financial and operational data.
| Criterion | Applied Materials, Inc. (AMAT) | Qnity Electronics, Inc. (Q) |
|---|---|---|
| Diversification | Highly diversified across Semiconductor Systems (19.9B), Applied Global Services (6.2B), and Display Markets (885M) | Limited diversification; primarily focused on niche electronics |
| Profitability | High net margin (24.67%), strong ROE (34.28%), ROIC (21.96%) all favorable | Moderate net margin (15.99%), low ROE (6.51%), neutral ROIC (5.92%) |
| Innovation | Strong innovation implied by high fixed asset turnover (5.54) and value creation (ROIC > WACC by 10.57%) | Limited innovation; neutral ROIC trend and no clear competitive advantage |
| Global presence | Large global footprint supported by diverse product segments | Smaller scale with limited global reach |
| Market Share | Leading in semiconductor equipment with increasing revenue trend in core segments | Market share not clearly defined; stable but low profitability |
Key takeaways: Applied Materials demonstrates strong diversification, profitability, and innovation capabilities, though its profitability trend is slightly declining. Qnity Electronics has stable but modest profitability and lacks a clear competitive moat, suggesting higher investment risk.
Risk Analysis
The table below summarizes key risks for Applied Materials, Inc. (AMAT) and Qnity Electronics, Inc. (Q) based on the most recent data available.
| Metric | Applied Materials, Inc. (AMAT) | Qnity Electronics, Inc. (Q) |
|---|---|---|
| Market Risk | High beta at 1.67 indicates elevated sensitivity to market swings | Beta unavailable but smaller market cap suggests higher vulnerability to market volatility |
| Debt level | Moderate debt-to-equity at 0.35, low debt-to-assets (19.42%) | Very low debt-to-equity (0.02) and debt-to-assets (1.56%), financially conservative |
| Regulatory Risk | Exposure to global semiconductor regulations, especially US-China trade tensions | Newer company with limited operating history but in regulated semiconductor materials industry |
| Operational Risk | Large global operations with complexity but strong operational metrics | Smaller scale with limited public operational data, possible execution risks |
| Environmental Risk | Moderate, given industry impact and global footprint | Potentially lower but emerging risks in advanced materials manufacturing |
| Geopolitical Risk | High, due to operations in Asia and sensitive semiconductor supply chains | Moderate, US-based but dependent on global supply chains |
The most impactful risks are market volatility for AMAT due to its high beta and significant global exposure, and operational uncertainties for Q as a newer, smaller player. Regulatory and geopolitical tensions remain critical for both, especially amid ongoing semiconductor trade complexities. I advise cautious allocation with attention to diversification and risk limits.
Which Stock to Choose?
Applied Materials, Inc. (AMAT) shows a favorable income evolution with solid profitability metrics including a 24.67% net margin and strong returns on equity and invested capital. Its debt ratios and liquidity are healthy, supported by a very favorable overall rating.
Qnity Electronics, Inc. (Q) presents favorable income metrics but with lower profitability, reflected in a 15.99% net margin and modest returns on equity. Its debt levels are minimal, and it holds a slightly favorable financial ratios profile alongside a very favorable rating.
For investors, AMAT might appear more attractive for those prioritizing higher profitability and operational efficiency, while Q could be seen as suitable for profiles valuing stable debt levels and moderate growth potential. The choice may depend on individual risk tolerance and investment strategy preferences.
Disclaimer: Investment carries a risk of loss of initial capital. The past performance is not a reliable indicator of future results. Be sure to understand risks before making an investment decision.
Go Further
I encourage you to read the complete analyses of Applied Materials, Inc. and Qnity Electronics, Inc. to enhance your investment decisions: