In the fast-evolving semiconductor industry, Applied Materials, Inc. (AMAT) and Onto Innovation Inc. (ONTO) stand out as key players driving technological advancements. Both companies provide essential manufacturing equipment and process control solutions, serving overlapping markets with innovative approaches. As an investor, understanding their strengths and growth potential is crucial. This article will help you decide which company offers the most compelling investment opportunity in this dynamic sector.

Table of contents
Companies Overview
I will begin the comparison between Applied Materials, Inc. and Onto Innovation Inc. by providing an overview of these two companies and their main differences.
Applied Materials, Inc. Overview
Applied Materials, Inc. supplies manufacturing equipment, services, and software primarily to the semiconductor, display, and related industries. The company operates through three segments: Semiconductor Systems, Applied Global Services, and Display and Adjacent Markets. It develops advanced technologies for semiconductor fabrication and display manufacturing, serving a global market including the US, Asia, and Europe. The company is headquartered in Santa Clara, California, and employs 36,000 people.
Onto Innovation Inc. Overview
Onto Innovation Inc. designs and manufactures process control tools for semiconductor and advanced packaging device manufacturers. Its offerings include macro defect inspection, optical metrology, lithography systems, and process control software, supporting yield management and device packaging. Founded in 1940 and based in Wilmington, Massachusetts, Onto Innovation employs approximately 1,551 people and serves a wide range of industrial and scientific applications globally.
Key similarities and differences
Both companies operate in the semiconductor industry and provide technology solutions that enhance manufacturing processes. Applied Materials focuses on a broad range of manufacturing equipment and related services, with a much larger global footprint and workforce. Onto Innovation specializes in process control tools and software, emphasizing inspection and metrology with a more focused product portfolio and smaller scale. Both companies support semiconductor production but differ in scope and scale of operations.
Income Statement Comparison
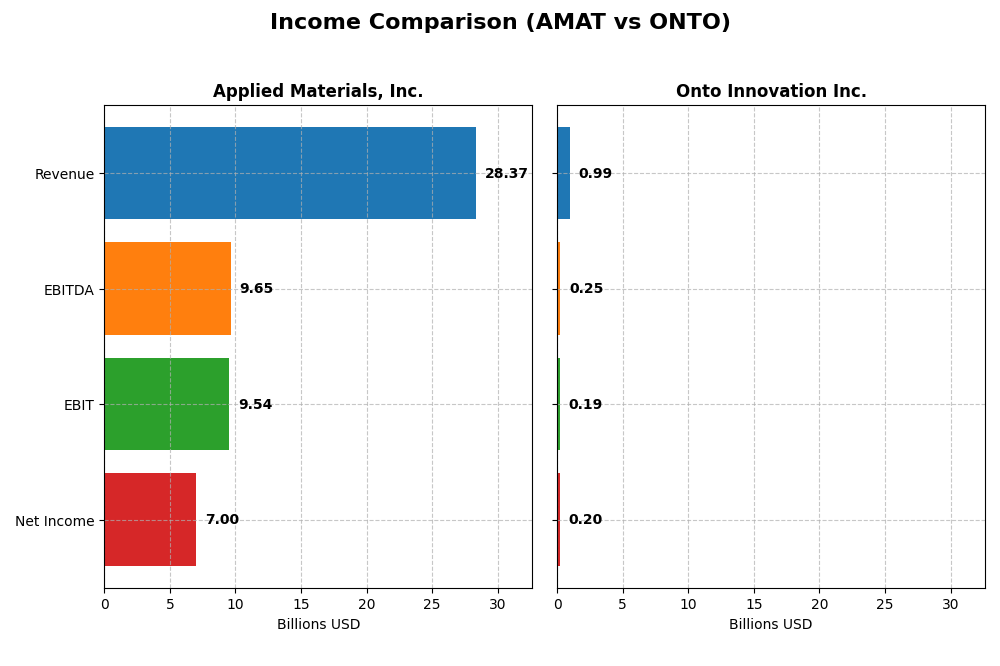
This table compares key income statement metrics for Applied Materials, Inc. and Onto Innovation Inc. based on their most recent fiscal year data.
| Metric | Applied Materials, Inc. (AMAT) | Onto Innovation Inc. (ONTO) |
|---|---|---|
| Market Cap | 214.2B | 8.13B |
| Revenue | 28.37B | 987M |
| EBITDA | 9.65B | 249M |
| EBIT | 9.54B | 187M |
| Net Income | 7.00B | 202M |
| EPS | 8.71 | 4.09 |
| Fiscal Year | 2025 | 2024 |
Income Statement Interpretations
Applied Materials, Inc.
Applied Materials showed steady revenue growth from 23B in 2021 to 28.4B in 2025, a 23% increase overall. Net income rose from 5.9B to 7.0B, though net margin slightly declined from 25.5% to 24.7%. The latest year showed moderate revenue growth of 4.4%, with gross profit expanding 7%, but net margin decreased by 6.6%, signaling margin pressure despite solid top-line expansion.
Onto Innovation Inc.
Onto Innovation experienced significant growth, with revenue jumping from 557M in 2020 to 987M in 2024, a 77% increase. Net income surged over 550% to 202M, while net margin improved markedly to 20.4%. The latest fiscal year showed a strong 21% revenue increase and a 38% net margin improvement, reflecting robust operational leverage and enhanced profitability across the period.
Which one has the stronger fundamentals?
Both companies demonstrate favorable fundamentals, but Onto Innovation’s income statement exhibits consistent and substantial growth across all metrics, including revenue, net income, and margins, with 100% favorable evaluations. Applied Materials maintains strong margins and steady growth but faces slight margin compression and mixed recent net income trends, resulting in a somewhat less uniformly favorable profile.
Financial Ratios Comparison
The table below presents a side-by-side comparison of key financial ratios for Applied Materials, Inc. (AMAT) and Onto Innovation Inc. (ONTO) based on their most recent fiscal year data.
| Ratios | Applied Materials, Inc. (AMAT) FY 2025 | Onto Innovation Inc. (ONTO) FY 2024 |
|---|---|---|
| ROE | 34.28% | 10.47% |
| ROIC | 21.96% | 8.77% |
| P/E | 26.58 | 41.76 |
| P/B | 9.11 | 4.37 |
| Current Ratio | 2.61 | 8.69 |
| Quick Ratio | 1.87 | 7.00 |
| D/E (Debt-to-Equity) | 0.35 | 0.01 |
| Debt-to-Assets | 19.42% | 0.72% |
| Interest Coverage | 30.81 | 0 (not available) |
| Asset Turnover | 0.78 | 0.47 |
| Fixed Asset Turnover | 5.54 | 7.16 |
| Payout Ratio | 19.78% | 0% |
| Dividend Yield | 0.74% | 0% |
Interpretation of the Ratios
Applied Materials, Inc.
Applied Materials shows strong profitability with a net margin of 24.67% and a return on equity of 34.28%, both favorable. Its capital efficiency and solvency ratios are also strong, though valuation multiples like P/E at 26.58 and P/B at 9.11 are less attractive. The company pays dividends with a modest 0.74% yield, supported by free cash flow, but the low yield may concern income-focused investors.
Onto Innovation Inc.
Onto Innovation presents a mixed picture: a favorable net margin of 20.43% contrasts with neutral returns on equity (10.47%) and invested capital (8.77%). Its liquidity ratios show a very high current ratio but unfavorable asset turnover. The company does not pay dividends, likely reflecting reinvestment in growth or R&D priorities, which aligns with its high valuation multiples and ongoing expansion efforts.
Which one has the best ratios?
Applied Materials exhibits a more favorable overall ratio profile, with superior profitability, solid solvency, and efficient capital use, despite some valuation concerns. Onto Innovation’s ratios are more mixed, balancing favorable liquidity and solvency with weaker profitability and efficiency metrics. Therefore, Applied Materials holds the stronger ratio set based on the data provided.
Strategic Positioning
This section compares the strategic positioning of Applied Materials, Inc. and Onto Innovation Inc. based on market position, key segments, and exposure to technological disruption:
Applied Materials, Inc.
- Large market cap of 214B; faces competitive pressure in semiconductors with global operations.
- Diversified segments: Semiconductor Systems, Applied Global Services, Display and Adjacent Markets driving revenues.
- Exposed to advanced semiconductor manufacturing tech including epitaxy, ion implantation, and metrology tools.
Onto Innovation Inc.
- Smaller market cap of 8.1B; competes in semiconductor process control tools globally.
- Focused on process control tools, software, and services for semiconductor and advanced packaging.
- Concentrated on optical metrology, lithography systems, and process control software innovation.
Applied Materials, Inc. vs Onto Innovation Inc. Positioning
Applied Materials exhibits a diversified business model with multiple revenue streams across semiconductor equipment and services, while Onto Innovation concentrates on niche process control tools and software. This difference offers broad market reach for AMAT versus specialized focus for ONTO.
Which has the best competitive advantage?
Applied Materials shows a slightly favorable moat with value creation despite declining ROIC, whereas Onto Innovation is slightly unfavorable, destroying value but improving profitability, indicating a stronger competitive advantage for Applied Materials.
Stock Comparison
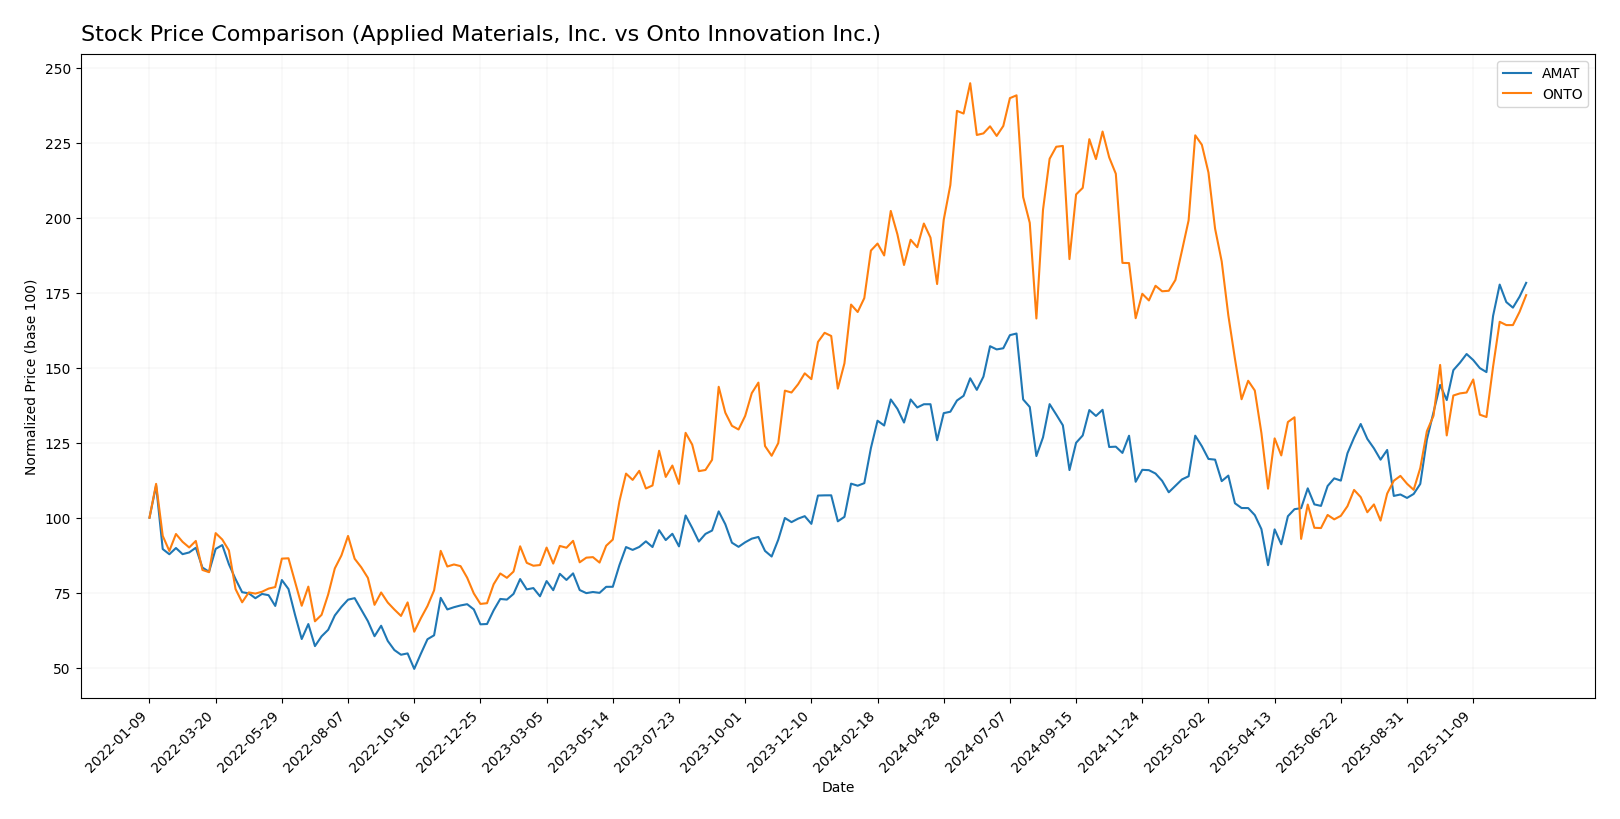
The stock price movements over the past 12 months reveal a strong bullish trend for Applied Materials, Inc., contrasted with a bearish trend for Onto Innovation Inc., reflecting divergent trading dynamics and market sentiment.
Trend Analysis
Applied Materials, Inc. (AMAT) showed a 44.68% price increase over the past year, indicating a bullish trend with acceleration. The stock ranged from a low of 126.95 to a high of 268.87, with a high volatility level (std deviation 30.28).
Onto Innovation Inc. (ONTO) experienced a 7.86% decline over the past year, reflecting a bearish trend with acceleration. The price fluctuated between 88.5 and 233.14, demonstrating higher volatility (std deviation 42.23).
Comparing trends, AMAT delivered the highest market performance with significant price appreciation, while ONTO showed a negative yearly return despite recent gains.
Target Prices
Analysts provide a clear consensus on target prices for Applied Materials, Inc. and Onto Innovation Inc.
| Company | Target High | Target Low | Consensus |
|---|---|---|---|
| Applied Materials, Inc. | 360 | 205 | 278.17 |
| Onto Innovation Inc. | 200 | 120 | 166 |
The target consensus for Applied Materials at 278.17 slightly exceeds the current price of 268.87, indicating moderate upside potential. Onto Innovation’s consensus target of 166 is close to its current price of 165.87, suggesting a balanced market expectation.
Analyst Opinions Comparison
This section compares analysts’ ratings and grades for Applied Materials, Inc. (AMAT) and Onto Innovation Inc. (ONTO):
Rating Comparison
AMAT Rating
- Rating: B+, classified as Very Favorable overall rating.
- Discounted Cash Flow Score: Moderate score of 3, indicating balanced valuation.
- ROE Score: Very Favorable 5, showing high efficiency in generating equity profits.
- ROA Score: Very Favorable 5, indicating excellent asset utilization.
- Debt To Equity Score: Moderate 2, moderate financial risk from debt levels.
- Overall Score: Moderate 3, reflecting balanced financial standing.
ONTO Rating
- Rating: B+, classified as Very Favorable overall rating.
- Discounted Cash Flow Score: Moderate score of 3, indicating balanced valuation.
- ROE Score: Moderate 3, showing average efficiency in generating equity profits.
- ROA Score: Favorable 4, indicating good asset utilization.
- Debt To Equity Score: Favorable 4, indicating lower financial risk from debt.
- Overall Score: Moderate 3, reflecting balanced financial standing.
Which one is the best rated?
Both AMAT and ONTO share the same overall rating of B+ and an overall score of 3, indicating moderate financial standing. AMAT excels in ROE and ROA with very favorable scores, while ONTO shows better debt management with a favorable debt-to-equity score.
Scores Comparison
Here is a comparison of the Altman Z-Score and Piotroski Score for Applied Materials, Inc. and Onto Innovation Inc.:
AMAT Scores
- Altman Z-Score: 12.03, indicating a safe financial zone
- Piotroski Score: 7, reflecting strong financial health
ONTO Scores
- Altman Z-Score: 27.45, indicating a safe financial zone
- Piotroski Score: 4, reflecting average financial health
Which company has the best scores?
Both companies are in the safe zone based on their Altman Z-Scores, but ONTO’s score is significantly higher. However, AMAT has a stronger Piotroski Score compared to ONTO. This suggests differing strengths in financial stability and health between the two.
Grades Comparison
The following tables summarize the recent grades assigned to Applied Materials, Inc. and Onto Innovation Inc.:
Applied Materials, Inc. Grades
This table lists the latest grades and rating actions from various reputable grading companies for Applied Materials, Inc.
| Grading Company | Action | New Grade | Date |
|---|---|---|---|
| B. Riley Securities | Maintain | Buy | 2025-12-18 |
| Mizuho | Maintain | Neutral | 2025-12-17 |
| Jefferies | Maintain | Buy | 2025-12-15 |
| Wells Fargo | Maintain | Overweight | 2025-12-15 |
| Keybanc | Maintain | Overweight | 2025-12-02 |
| UBS | Upgrade | Buy | 2025-11-25 |
| Wells Fargo | Maintain | Overweight | 2025-11-14 |
| Morgan Stanley | Maintain | Overweight | 2025-11-14 |
| B. Riley Securities | Maintain | Buy | 2025-11-14 |
| Cantor Fitzgerald | Maintain | Overweight | 2025-11-14 |
Applied Materials shows a consistent pattern of buy and overweight ratings, with a recent upgrade from UBS, indicating overall positive sentiment.
Onto Innovation Inc. Grades
This table presents recent grades and rating actions from recognized grading companies for Onto Innovation Inc.
| Grading Company | Action | New Grade | Date |
|---|---|---|---|
| Jefferies | Maintain | Buy | 2025-12-15 |
| B. Riley Securities | Maintain | Buy | 2025-11-18 |
| Needham | Maintain | Buy | 2025-11-18 |
| Evercore ISI Group | Maintain | Outperform | 2025-11-05 |
| Oppenheimer | Maintain | Outperform | 2025-10-14 |
| Stifel | Maintain | Hold | 2025-10-13 |
| B. Riley Securities | Maintain | Buy | 2025-10-10 |
| Jefferies | Upgrade | Buy | 2025-09-23 |
| B. Riley Securities | Maintain | Buy | 2025-08-08 |
| Benchmark | Maintain | Buy | 2025-08-08 |
Onto Innovation receives predominantly buy and outperform ratings, with one hold and a recent upgrade from Jefferies, reflecting strong analyst confidence.
Which company has the best grades?
Both Applied Materials and Onto Innovation have received mostly positive grades, but Onto Innovation has a higher frequency of “Outperform” ratings alongside consistent buy recommendations. This could suggest stronger analyst conviction, potentially impacting investor sentiment and portfolio positioning.
Strengths and Weaknesses
Below is a comparison of key strengths and weaknesses for Applied Materials, Inc. (AMAT) and Onto Innovation Inc. (ONTO) based on their recent financial performance and market position.
| Criterion | Applied Materials, Inc. (AMAT) | Onto Innovation Inc. (ONTO) |
|---|---|---|
| Diversification | Highly diversified with strong segments in Semiconductor Systems ($19.9B), Applied Global Services ($6.2B), Display & Adjacent Markets ($885M) | Less diversified; heavily reliant on Systems and Software Revenue (~$850M in 2024) |
| Profitability | High net margin (24.7%) and ROIC (22%) with value creation but declining ROIC trend | Moderate net margin (20.4%) and ROIC (8.8%) with improving ROIC but currently shedding value |
| Innovation | Strong innovation capabilities reflected in industry leadership and high fixed asset turnover (5.54) | Moderate innovation; good fixed asset turnover (7.16) but lower asset turnover overall (0.47) |
| Global presence | Extensive global operations with diversified market reach | Smaller global footprint; specialized market focus |
| Market Share | Leading market share in semiconductor equipment industry | Smaller niche market share with growth potential |
In summary, AMAT demonstrates strong profitability and broad diversification but faces a declining ROIC trend, signaling caution. ONTO is less diversified and currently value-destructive but shows promising ROIC growth, indicating improving operational efficiency. Investors should weigh AMAT’s stability against ONTO’s growth potential while managing risks accordingly.
Risk Analysis
Below is a comparison of key risk factors for Applied Materials, Inc. (AMAT) and Onto Innovation Inc. (ONTO) based on the most recent data available.
| Metric | Applied Materials, Inc. (AMAT) | Onto Innovation Inc. (ONTO) |
|---|---|---|
| Market Risk | High beta 1.666 indicates higher volatility relative to market | Beta 1.473, somewhat less volatile but still elevated |
| Debt level | Moderate debt-to-equity 0.35, favorable interest coverage (35.46) | Very low debt-to-equity 0.01, excellent interest coverage (infinite) |
| Regulatory Risk | Moderate, operates globally including US, China, Taiwan with potential trade tensions | Moderate, US-based but global customers, less diversified geographically |
| Operational Risk | Large scale with 36K employees, complexity could increase operational challenges | Smaller scale with 1.5K employees, less operational complexity but more concentrated |
| Environmental Risk | Exposure due to semiconductor manufacturing’s energy and chemical use | Similar semiconductor industry exposure, but smaller footprint reduces impact |
| Geopolitical Risk | High, extensive presence in Asia amid US-China tech tensions | Moderate, less reliant on Asia but still exposed through customers |
The most impactful risk for AMAT is its market volatility and geopolitical exposure, especially in Asia-Pacific regions facing trade tensions. Onto Innovation’s primary risks are elevated market volatility and operational concentration due to its smaller size. Both companies maintain solid debt profiles, reducing financial risk significantly.
Which Stock to Choose?
Applied Materials, Inc. (AMAT) shows steady income growth with a 23% revenue increase over five years and favorable profitability metrics, including a 24.67% net margin and a 34.28% ROE. Its debt levels are moderate, supported by a healthy current ratio of 2.61, and it holds a very favorable B+ rating with strong financial ratios overall.
Onto Innovation Inc. (ONTO) demonstrates robust income growth with a 77% revenue rise over five years and favorable net margin at 20.43%. However, profitability ratios like ROE at 10.47% are neutral, and despite minimal debt, its financial ratios receive a neutral global evaluation. The company also holds a B+ rating but with more moderate underlying scores.
For investors, AMAT might appear more attractive for those prioritizing profitability and financial stability given its favorable rating and stronger income statement metrics. Conversely, ONTO could be interpreted as suitable for growth-oriented investors willing to accept moderate profitability and a more mixed financial ratio profile. The final choice could depend on the investor’s risk tolerance and investment strategy.
Disclaimer: Investment carries a risk of loss of initial capital. The past performance is not a reliable indicator of future results. Be sure to understand risks before making an investment decision.
Go Further
I encourage you to read the complete analyses of Applied Materials, Inc. and Onto Innovation Inc. to enhance your investment decisions: