In the fast-evolving semiconductor industry, Applied Materials, Inc. (AMAT) and ON Semiconductor Corporation (ON) stand out as key players driving innovation and market growth. Both companies serve crucial roles in chip manufacturing and power solutions, addressing overlapping markets with complementary technologies. This comparison will help investors understand which company offers the most promising investment opportunity in this competitive and dynamic sector. Let’s explore their strengths and potential together.
Table of contents
Companies Overview
I will begin the comparison between Applied Materials, Inc. and ON Semiconductor Corporation by providing an overview of these two companies and their main differences.
Applied Materials, Inc. Overview
Applied Materials, Inc. supplies manufacturing equipment, services, and software for the semiconductor, display, and related industries. It operates through segments including Semiconductor Systems and Display and Adjacent Markets. The company focuses on tools and integrated solutions that optimize semiconductor chip fabrication and display technology manufacturing, serving a global market from its headquarters in Santa Clara, CA.
ON Semiconductor Corporation Overview
ON Semiconductor Corporation delivers intelligent sensing and power solutions worldwide, emphasizing automotive electrification and sustainable energy. It offers a broad range of semiconductor products, including analog, mixed-signal, and image sensors for various end-markets. Headquartered in Scottsdale, AZ, ON Semiconductor operates through segments that support power switching, signal conditioning, and integrated power solutions.
Key similarities and differences
Both companies operate in the semiconductor industry and are listed on NASDAQ Global Select, with a focus on technology solutions. Applied Materials concentrates on manufacturing equipment and services for semiconductor fabrication and display technologies, while ON Semiconductor emphasizes power management and sensing solutions for automotive and energy sectors. Their business models differ primarily in product focus and end-market applications, reflecting distinct strategic priorities within the semiconductor landscape.
Income Statement Comparison
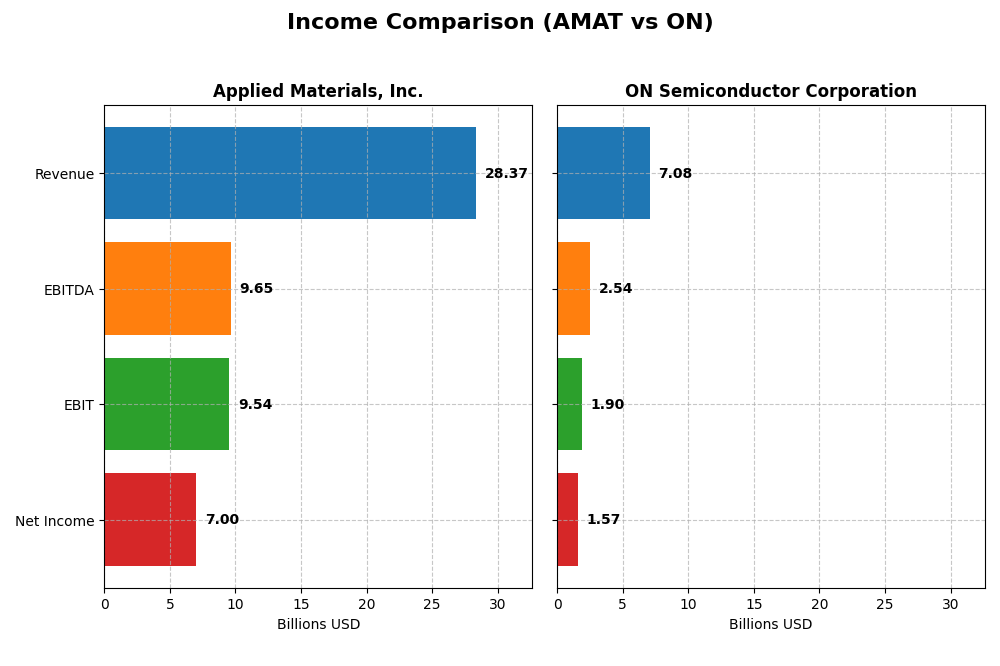
The table below summarizes key income statement metrics for Applied Materials, Inc. and ON Semiconductor Corporation for their most recent fiscal years, allowing a side-by-side financial performance comparison.
| Metric | Applied Materials, Inc. (AMAT) | ON Semiconductor Corporation (ON) |
|---|---|---|
| Market Cap | 261B | 25B |
| Revenue | 28.37B | 7.08B |
| EBITDA | 9.65B | 2.54B |
| EBIT | 9.54B | 1.90B |
| Net Income | 7.00B | 1.57B |
| EPS | 8.71 | 3.68 |
| Fiscal Year | 2025 | 2024 |
Income Statement Interpretations
Applied Materials, Inc.
Applied Materials displayed consistent revenue growth from 23B in 2021 to 28.4B in 2025, with net income rising from 5.9B to 7B. Margins remained generally stable, with a favorable gross margin near 48.7%, though net margin slightly declined recently. In 2025, revenue growth slowed to 4.4% while EBITDA and EBIT margins improved, signaling operational efficiency gains despite a minor net margin dip.
ON Semiconductor Corporation
ON Semiconductor’s revenue grew overall from 5.3B in 2020 to 7.1B in 2024 but declined 14% in the last year, dragging net income down from 2.2B in 2023 to 1.57B in 2024. Margins remained favorable with a gross margin around 45.4%, though recent year profitability contracted alongside a 26% EBIT drop. The latest year reflects challenges in sustaining growth momentum and margin pressure.
Which one has the stronger fundamentals?
Applied Materials exhibits stronger fundamentals with steady revenue and net income growth, stable and favorable margins, and operational efficiency gains in the latest year. ON Semiconductor, despite impressive long-term growth, shows recent declines in revenue, profitability, and margins. Both maintain favorable income statements, but Applied Materials demonstrates more consistent margin stability and growth sustainability.
Financial Ratios Comparison
The table below compares key financial ratios for Applied Materials, Inc. (AMAT) and ON Semiconductor Corporation (ON) based on their most recent fiscal year data.
| Ratios | Applied Materials, Inc. (2025) | ON Semiconductor Corporation (2024) |
|---|---|---|
| ROE | 34.3% | 17.9% |
| ROIC | 21.96% | 11.88% |
| P/E | 26.58 | 17.13 |
| P/B | 9.11 | 3.06 |
| Current Ratio | 2.61 | 5.06 |
| Quick Ratio | 1.87 | 3.38 |
| D/E (Debt-to-Equity) | 0.35 | 0.38 |
| Debt-to-Assets | 19.4% | 23.9% |
| Interest Coverage | 30.8 | 28.4 |
| Asset Turnover | 0.78 | 0.50 |
| Fixed Asset Turnover | 5.54 | 1.61 |
| Payout ratio | 19.8% | 0% |
| Dividend yield | 0.74% | 0% |
Interpretation of the Ratios
Applied Materials, Inc.
Applied Materials shows predominantly favorable financial ratios, including strong net margin (24.67%), ROE (34.28%), and ROIC (21.96%), indicating efficient profitability and capital use. However, valuation metrics like PE (26.58) and PB (9.11) appear high, signaling potential overvaluation. The company pays dividends with a modest yield (0.74%), backed by free cash flow, though coverage and payout sustainability warrant attention.
ON Semiconductor Corporation
ON Semiconductor presents a mix of favorable and neutral ratios, with a solid net margin (22.21%) and ROE (17.88%), but weaker ROIC (11.88%) compared to peers. Its current ratio is unusually high (5.06), flagged as unfavorable, possibly reflecting excess liquidity. The company does not pay dividends, consistent with reinvestment and growth priorities, supported by a reasonable free cash flow yield (4.5%).
Which one has the best ratios?
Applied Materials holds a more favorable overall ratio profile with 64.29% favorable metrics versus ON Semiconductor’s 50%, reflecting stronger profitability and capital efficiency. Despite some valuation concerns, Applied Materials’ balance of favorable leverage and operational ratios outweighs ON’s higher liquidity and neutral asset turnover, suggesting a comparatively stronger financial foundation.
Strategic Positioning
This section compares the strategic positioning of Applied Materials, Inc. and ON Semiconductor Corporation, focusing on market position, key segments, and exposure to technological disruption:
Applied Materials, Inc.
- Leading semiconductor equipment provider, facing intense tech industry competition.
- Diversified across Semiconductor Systems, Applied Global Services, and Display markets.
- Exposure through advanced manufacturing tech and fab automation tools.
ON Semiconductor Corporation
- Mid-sized semiconductor company with focused competition in power and sensing.
- Concentrated in Power Solutions, Analog, and Intelligent Sensing segments.
- Exposure via power management and imaging sensor technologies.
Applied Materials, Inc. vs ON Semiconductor Corporation Positioning
Applied Materials exhibits a diversified business model with broad semiconductor equipment and services segments, while ON Semiconductor has a more concentrated focus on power and sensing solutions. Diversification may reduce segment risk; concentration could enable deeper sector expertise.
Which has the best competitive advantage?
Applied Materials shows a slightly favorable moat with value creation but declining profitability, whereas ON Semiconductor’s moat is also slightly favorable but currently shedding value despite improving ROIC trends.
Stock Comparison
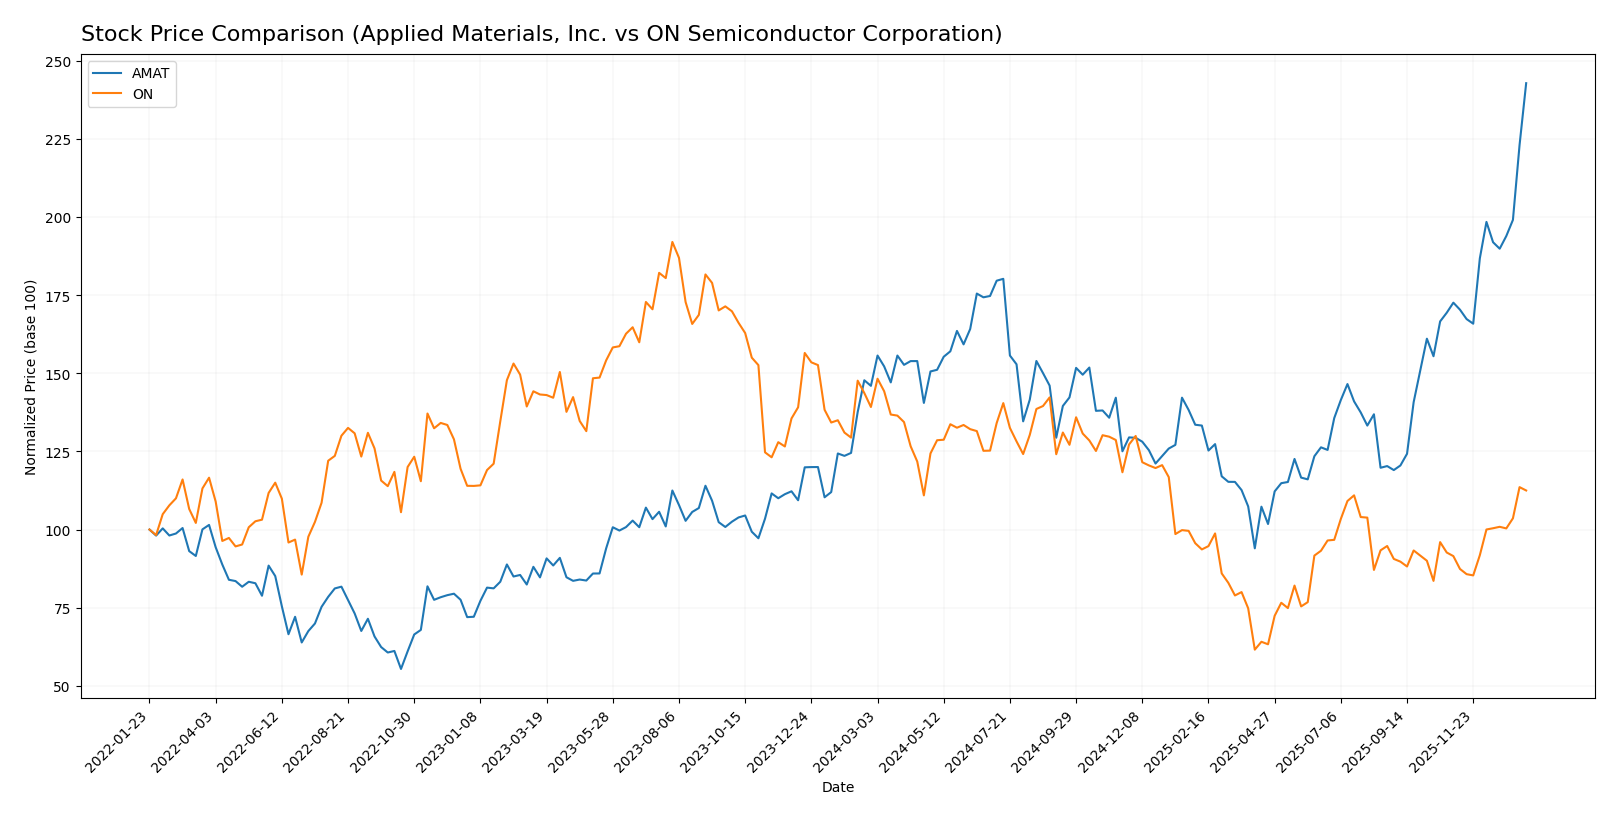
The past year reveals a marked divergence in stock trajectories, with Applied Materials, Inc. (AMAT) exhibiting strong bullish momentum and ON Semiconductor Corporation (ON) showing a notable bearish trend despite recent positive shifts.
Trend Analysis
Applied Materials, Inc. (AMAT) experienced a robust 66.33% price increase over the past 12 months, indicating a clear bullish trend with acceleration and high volatility, reaching a peak price of 327.94. Recent months confirm continued positive momentum with a 40.69% gain.
ON Semiconductor Corporation (ON) showed a 19.19% decline over the past year, reflecting a bearish trend with acceleration and moderate volatility, with prices ranging between 33.7 and 81.14. However, recent weeks reveal a 22.95% price rise, signaling some recovery.
Comparing both stocks, AMAT delivered the highest market performance over the past year, outperforming ON significantly despite ON’s recent upward movement.
Target Prices
The current analyst consensus reveals diverse target price ranges for Applied Materials, Inc. and ON Semiconductor Corporation.
| Company | Target High | Target Low | Consensus |
|---|---|---|---|
| Applied Materials, Inc. | 400 | 273 | 323.43 |
| ON Semiconductor Corporation | 64 | 51 | 58.33 |
Analysts expect Applied Materials’ price to remain near current levels, with a consensus slightly below the current price of $327.65. ON Semiconductor’s target consensus of $58.33 is modestly below its current trading price of $61.68, indicating a cautious market outlook.
Analyst Opinions Comparison
This section compares analysts’ ratings and grades for Applied Materials, Inc. (AMAT) and ON Semiconductor Corporation (ON):
Rating Comparison
AMAT Rating
- Rating: B+, considered very favorable by analysts.
- Discounted Cash Flow Score: 3, indicating moderate valuation.
- ROE Score: 5, showing very favorable efficiency in equity use.
- ROA Score: 5, indicating very favorable asset utilization.
- Debt To Equity Score: 2, showing moderate financial risk.
- Overall Score: 3, categorized as moderate overall standing.
ON Rating
- Rating: B-, also considered very favorable by analysts.
- Discounted Cash Flow Score: 3, indicating moderate valuation.
- ROE Score: 2, reflecting moderate efficiency in equity use.
- ROA Score: 3, indicating moderate asset utilization.
- Debt To Equity Score: 2, showing moderate financial risk.
- Overall Score: 2, categorized as moderate overall standing.
Which one is the best rated?
Based strictly on the data, AMAT holds a higher rating (B+) compared to ON’s B-. AMAT also scores better in ROE, ROA, and overall score, indicating stronger financial metrics in these key areas.
Scores Comparison
Here is a comparison of the Altman Z-Score and Piotroski Score for the two companies:
AMAT Scores
- Altman Z-Score: 13.45, indicating a strong safe zone.
- Piotroski Score: 7, showing strong financial health.
ON Scores
- Altman Z-Score: 4.84, indicating a safe zone.
- Piotroski Score: 6, reflecting average financial health.
Which company has the best scores?
AMAT has higher scores in both Altman Z-Score and Piotroski Score, indicating stronger financial stability and health compared to ON based on the provided data.
Grades Comparison
Here is a detailed comparison of the recent grades assigned to Applied Materials, Inc. and ON Semiconductor Corporation:
Applied Materials, Inc. Grades
This table summarizes recent grades from established grading companies for Applied Materials, Inc.:
| Grading Company | Action | New Grade | Date |
|---|---|---|---|
| B of A Securities | Maintain | Buy | 2026-01-13 |
| Susquehanna | Upgrade | Positive | 2026-01-12 |
| Cantor Fitzgerald | Maintain | Overweight | 2026-01-08 |
| B. Riley Securities | Maintain | Buy | 2025-12-18 |
| Mizuho | Maintain | Neutral | 2025-12-17 |
| Wells Fargo | Maintain | Overweight | 2025-12-15 |
| Jefferies | Maintain | Buy | 2025-12-15 |
| Keybanc | Maintain | Overweight | 2025-12-02 |
| UBS | Upgrade | Buy | 2025-11-25 |
| B. Riley Securities | Maintain | Buy | 2025-11-14 |
Applied Materials shows a predominantly positive grading trend, with several “Buy” and “Overweight” ratings, and recent upgrades indicating confidence from analysts.
ON Semiconductor Corporation Grades
This table summarizes recent grades from established grading companies for ON Semiconductor Corporation:
| Grading Company | Action | New Grade | Date |
|---|---|---|---|
| Piper Sandler | Maintain | Overweight | 2026-01-07 |
| Truist Securities | Maintain | Hold | 2025-12-19 |
| Morgan Stanley | Maintain | Equal Weight | 2025-11-24 |
| Truist Securities | Maintain | Hold | 2025-11-04 |
| Baird | Maintain | Neutral | 2025-11-04 |
| Rosenblatt | Maintain | Neutral | 2025-11-04 |
| Morgan Stanley | Maintain | Equal Weight | 2025-11-04 |
| TD Cowen | Maintain | Buy | 2025-11-04 |
| UBS | Maintain | Neutral | 2025-10-27 |
| B of A Securities | Maintain | Neutral | 2025-09-05 |
ON Semiconductor’s grades show a more cautious stance, with a mix of “Hold,” “Neutral,” and “Equal Weight” ratings, and fewer “Buy” recommendations.
Which company has the best grades?
Applied Materials, Inc. has received generally stronger grades than ON Semiconductor Corporation, with more frequent “Buy” and “Overweight” ratings. This suggests greater analyst confidence in Applied Materials’ outlook, which may influence investor sentiment and portfolio positioning accordingly.
Strengths and Weaknesses
Here is a comparative overview of key strengths and weaknesses for Applied Materials, Inc. (AMAT) and ON Semiconductor Corporation (ON) based on the latest financial and operational data.
| Criterion | Applied Materials, Inc. (AMAT) | ON Semiconductor Corporation (ON) |
|---|---|---|
| Diversification | Strong with three main segments: Semiconductor Systems (19.9B), Applied Global Services (6.2B), Display and Adjacent Markets (0.9B) | Balanced across Power Solutions (3.3B), Analog Solutions (2.6B), Intelligent Sensing (1.1B) |
| Profitability | High net margin (24.67%) and ROIC (21.96%), though ROIC is declining | Good net margin (22.21%) and improving ROIC (11.88%) with positive trend |
| Innovation | Consistent investment in semiconductor tech, reflected in solid asset turnover and fixed asset turnover | Growing profitability suggests increasing innovation, but asset turnover is moderate |
| Global presence | Extensive global footprint supporting large semiconductor market | Strong presence in power and analog sectors, expanding sensing tech globally |
| Market Share | Leading in semiconductor equipment with a high PE (26.58) and PB (9.11) indicating premium valuation | Growing market share in power and analog segments with more reasonable valuation metrics |
Key takeaways: AMAT demonstrates strong profitability and broad diversification in semiconductors but faces a declining ROIC trend. ON Semiconductor shows improving profitability and growing competitive strength, though with slightly less diversification and moderate asset efficiency. Both companies present investment opportunities with different risk and growth profiles.
Risk Analysis
The following table compares key risk factors for Applied Materials, Inc. (AMAT) and ON Semiconductor Corporation (ON) based on the most recent data available.
| Metric | Applied Materials, Inc. (AMAT) | ON Semiconductor Corporation (ON) |
|---|---|---|
| Market Risk | High volatility (Beta 1.67) | High volatility (Beta 1.54) |
| Debt Level | Moderate (D/E 0.35, Debt/Assets 19.4%) | Moderate (D/E 0.38, Debt/Assets 23.9%) |
| Regulatory Risk | Moderate, global operations in US, Asia | Moderate, exposure to automotive and industrial regulations |
| Operational Risk | Medium, complex manufacturing and global supply chains | Medium, reliant on advanced semiconductor manufacturing |
| Environmental Risk | Moderate, manufacturing impact and sustainability focus | Moderate, emphasis on sustainable energy solutions |
| Geopolitical Risk | Elevated, significant exposure to China and Asia | Elevated, global supply chain and government contracts |
Both companies face significant market risk due to their high beta values, reflecting sensitivity to market swings. Geopolitical tensions in Asia notably impact their supply chains and revenue. Debt levels remain moderate and manageable, with strong interest coverage ratios. Applied Materials shows a stronger financial health profile, while ON’s exposure to automotive electrification markets adds specific regulatory and operational risks.
Which Stock to Choose?
Applied Materials, Inc. (AMAT) shows a favorable income evolution with 23% revenue growth over five years and strong profitability ratios, including a 34.3% ROE. Its debt levels are moderate with a 0.35 debt-to-equity ratio, and it holds a very favorable B+ rating overall.
ON Semiconductor Corporation (ON) exhibits mixed income trends, with a 35% revenue growth overall but a recent 14% decline, and moderate profitability, including a 17.9% ROE. Debt is slightly higher at 0.38 debt-to-equity, and it holds a slightly favorable B- rating.
Investors focused on stable profitability and value creation might find AMAT’s strong returns and rating appealing, while those prioritizing growth potential despite recent volatility could consider ON’s improving profitability trend and slightly favorable outlook as a factor to watch.
Disclaimer: Investment carries a risk of loss of initial capital. The past performance is not a reliable indicator of future results. Be sure to understand risks before making an investment decision.
Go Further
I encourage you to read the complete analyses of Applied Materials, Inc. and ON Semiconductor Corporation to enhance your investment decisions: