Home > Comparison > Technology > AMAT vs NXPI
The strategic rivalry between Applied Materials, Inc. and NXP Semiconductors N.V. shapes the semiconductor industry’s evolution. Applied Materials operates as a capital-intensive equipment and services provider, while NXP focuses on high-margin semiconductor product innovation. This confrontation highlights a classic battle between manufacturing infrastructure and chip design leadership. This analysis aims to identify which company’s trajectory delivers superior risk-adjusted returns for diversified portfolios in the dynamic technology sector.
Table of contents
Companies Overview
Applied Materials and NXP Semiconductors stand as pivotal players in the global semiconductor industry, shaping technology’s backbone.
Applied Materials, Inc.: Semiconductor Equipment Innovator
Applied Materials commands the semiconductor equipment market, generating revenue by selling advanced fabrication tools and software. Its strategic focus in 2026 centers on enhancing manufacturing efficiency through integrated solutions spanning epitaxy to metrology. The company leverages a broad portfolio to serve fabs worldwide, solidifying its competitive edge in semiconductor systems and display technologies.
NXP Semiconductors N.V.: Diverse Chipmaker for Connectivity
NXP Semiconductors specializes in semiconductor products ranging from microcontrollers to wireless connectivity solutions. It drives revenue through diversified offerings for automotive, industrial IoT, and mobile sectors. In 2026, NXP prioritizes expanding its portfolio in security controllers and sensors while strengthening its position in communication infrastructure markets globally.
Strategic Collision: Similarities & Divergences
Applied Materials focuses on capital-intensive fabrication equipment, creating a closed-loop ecosystem for chipmakers. NXP pursues a product-centric approach with broad applications across connectivity and automotive markets. Their primary battleground lies in semiconductor innovation—equipment versus integrated chip solutions. Investors face distinct profiles: Applied Materials offers exposure to manufacturing tech, while NXP provides diversified semiconductor product growth.
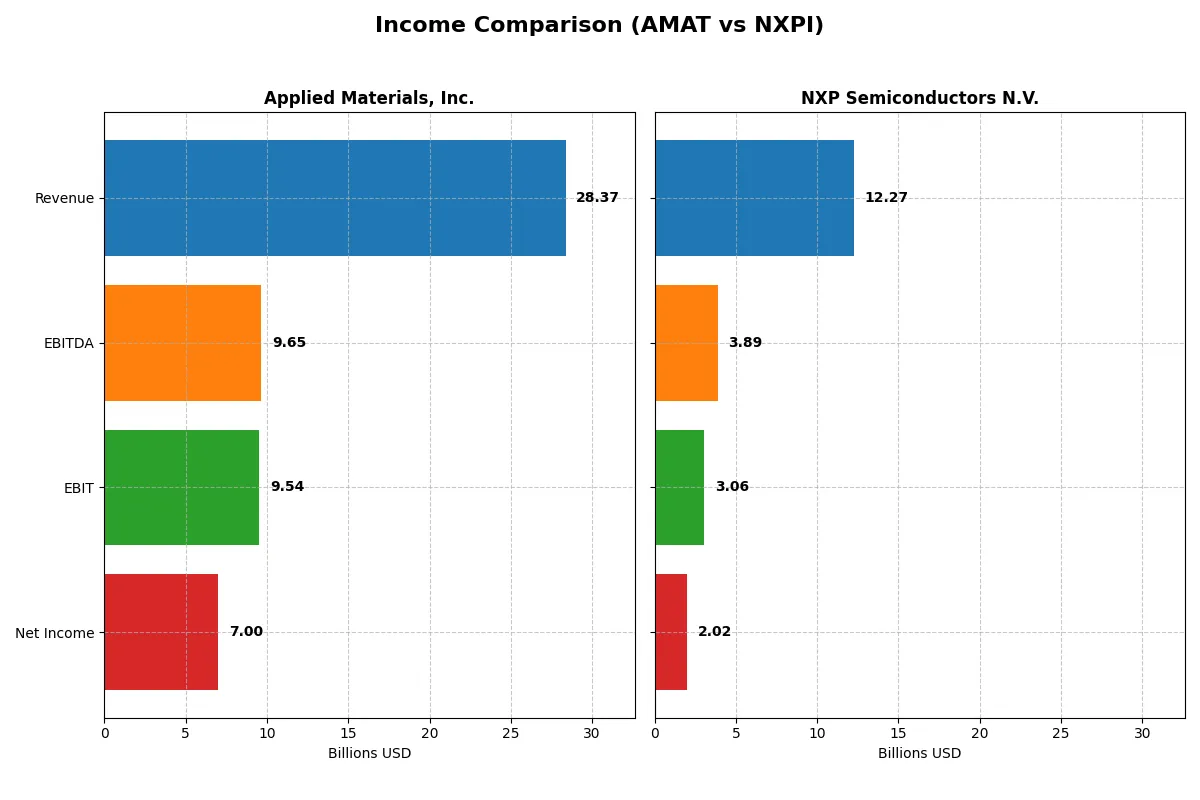
Income Statement Comparison
This data dissects the core profitability and scalability of both corporate engines to reveal who dominates the bottom line:
| Metric | Applied Materials, Inc. (AMAT) | NXP Semiconductors N.V. (NXPI) |
|---|---|---|
| Revenue | 28.4B | 12.3B |
| Cost of Revenue | 14.6B | 5.6B |
| Operating Expenses | 5.5B | 3.4B |
| Gross Profit | 13.8B | 6.7B |
| EBITDA | 9.7B | 3.9B |
| EBIT | 9.5B | 3.1B |
| Interest Expense | 269M | 384M |
| Net Income | 7.0B | 2.0B |
| EPS | 8.71 | 8.00 |
| Fiscal Year | 2025 | 2025 |
Income Statement Analysis: The Bottom-Line Duel
This income statement comparison reveals which company drives superior efficiency and profitability through its core operations.
Applied Materials, Inc. Analysis
Applied Materials posts steady revenue growth, reaching $28.4B in 2025 with net income near $7B. Its gross margin sustains a strong 48.7%, while net margin holds at 24.7%, reflecting excellent cost control. Despite a slight net margin dip last year, EBIT expanded 13.6%, signaling robust operating momentum and efficient capital allocation.
NXP Semiconductors N.V. Analysis
NXP’s revenue declined 2.7% to $12.3B in 2025, with net income falling sharply to $2B. Gross margin remains healthy at 54.4%, but net margin dropped to 16.5%, pressured by higher interest expense. EBIT slid 12.5%, underscoring challenges in operational leverage and recent margin erosion despite solid longer-term EPS gains.
Margin Strength vs. Revenue Momentum
Applied Materials outperforms NXP in scale, profit margins, and recent operating income growth. AMAT’s ability to expand EBIT amid moderate revenue growth contrasts with NXPI’s declining top line and profitability. For investors prioritizing consistent margin expansion and operational efficiency, AMAT presents a more compelling earnings profile.
Financial Ratios Comparison
These vital ratios act as a diagnostic tool to expose the underlying fiscal health, valuation premiums, and capital efficiency of the companies compared below:
| Ratios | Applied Materials, Inc. (AMAT) | NXP Semiconductors N.V. (NXPI) |
|---|---|---|
| ROE | 34.3% | 20.1% |
| ROIC | 21.9% | 11.0% |
| P/E | 26.6 | 27.1 |
| P/B | 9.11 | 5.45 |
| Current Ratio | 2.61 | 2.05 |
| Quick Ratio | 1.87 | 1.38 |
| D/E | 0.35 | 1.22 |
| Debt-to-Assets | 19.4% | 46.0% |
| Interest Coverage | 30.8 | 8.62 |
| Asset Turnover | 0.78 | 0.46 |
| Fixed Asset Turnover | 5.54 | 4.12 |
| Payout ratio | 19.8% | 50.7% |
| Dividend yield | 0.74% | 1.87% |
| Fiscal Year | 2025 | 2025 |
Efficiency & Valuation Duel: The Vital Signs
Financial ratios act as a company’s DNA, uncovering hidden risks and operational strengths that guide investment decisions.
Applied Materials, Inc.
Applied Materials delivers strong profitability with a 34.3% ROE and a 24.7% net margin, showcasing operational efficiency. Its P/E of 26.6 and P/B of 9.1 suggest a stretched valuation relative to earnings. Shareholders receive a modest 0.74% dividend yield, indicating a balance between returns and reinvestment in R&D for future growth.
NXP Semiconductors N.V.
NXP posts moderate profitability with a 20.1% ROE and 16.5% net margin, reflecting solid but less efficient operations. The stock trades at a slightly higher P/E of 27.1, signaling an expensive valuation, while its debt levels and asset turnover raise caution. A 1.87% dividend yield provides steady income, partially offsetting valuation concerns.
Premium Valuation vs. Operational Safety
Applied Materials offers superior operational profitability and healthier balance sheet metrics despite its stretched valuation. NXP’s higher dividend yield suits income-focused investors but carries more leverage risk. Investors prioritizing growth may favor Applied Materials’ efficiency, while those seeking income might lean toward NXP’s steady dividends.
Which one offers the Superior Shareholder Reward?
I observe Applied Materials (AMAT) maintains a conservative dividend payout around 16-20%, yielding ~0.75%-0.88%, backed by strong free cash flow coverage (>1.7x). Its buybacks are steady, supporting shareholder value sustainably. NXP Semiconductors (NXPI) offers a higher dividend yield near 1.9%, but pays out over 40-50% of earnings, stressing coverage ratios (~2x dividend and capex). NXPI’s leverage at 1.2-1.3 debt/equity raises risk despite aggressive buybacks. I see AMAT’s balanced distribution and stronger cash flow foundation as more sustainable. For 2026, AMAT delivers a superior total return profile with prudent capital allocation and durable shareholder rewards.
Comparative Score Analysis: The Strategic Profile
The radar chart reveals the fundamental DNA and trade-offs of Applied Materials, Inc. and NXP Semiconductors N.V., highlighting their financial strengths and weaknesses:
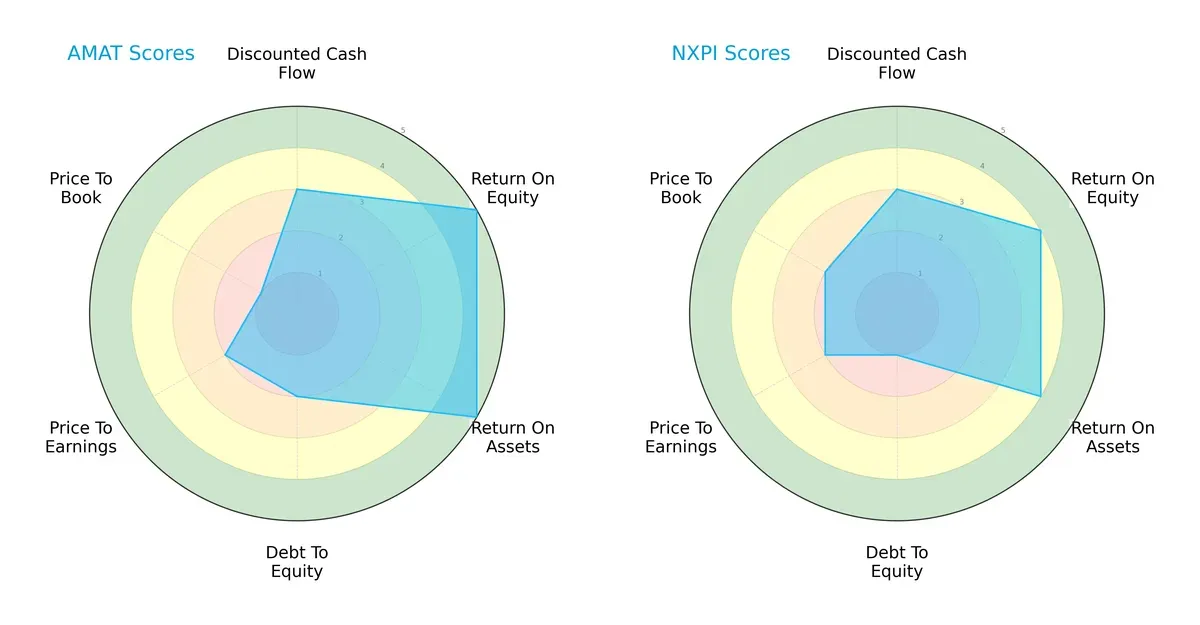
Applied Materials excels in profitability with top ROE (5) and ROA (5) scores, showing operational efficiency. NXP offers a more conservative debt profile but scores lower in asset returns. Both share moderate DCF and valuation scores, but Applied Materials’ weak price-to-book score signals potential overvaluation risk. Overall, Applied Materials relies on profitability dominance, while NXP shows a balanced but more leveraged stance.
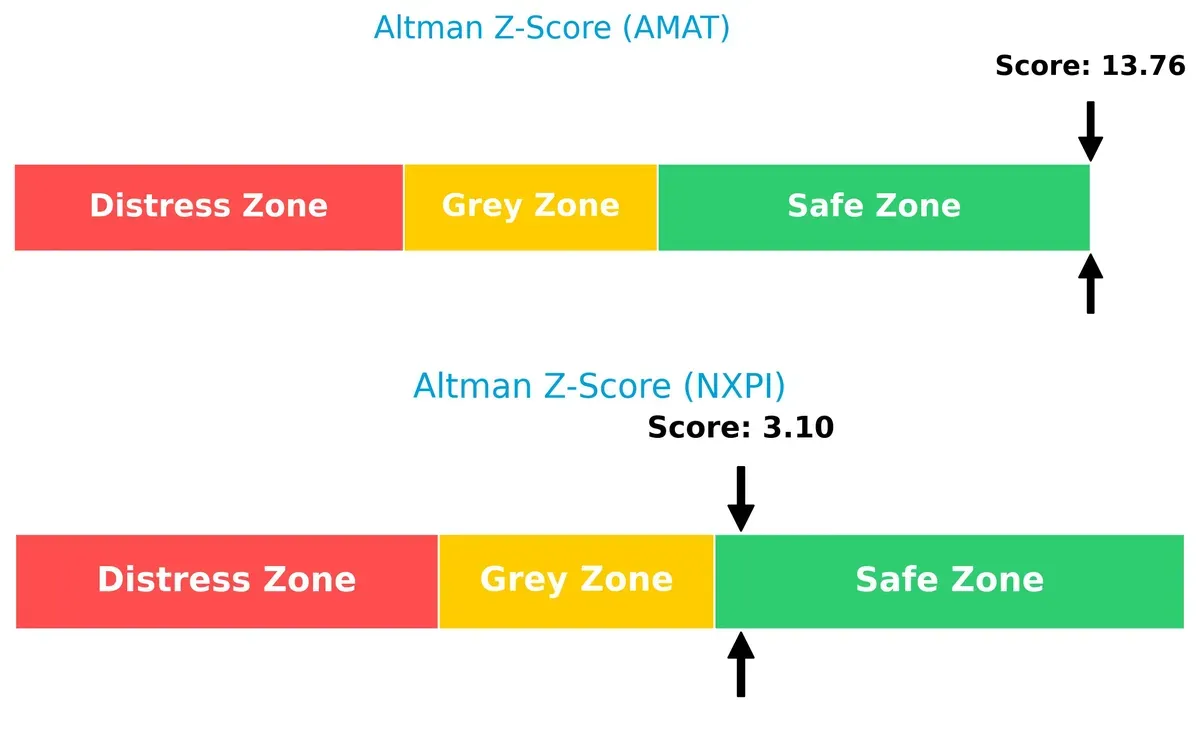
Bankruptcy Risk: Solvency Showdown
Applied Materials’ Altman Z-Score of 13.76 far exceeds NXP’s 3.10, signaling superior solvency and a much lower bankruptcy risk in this cycle:
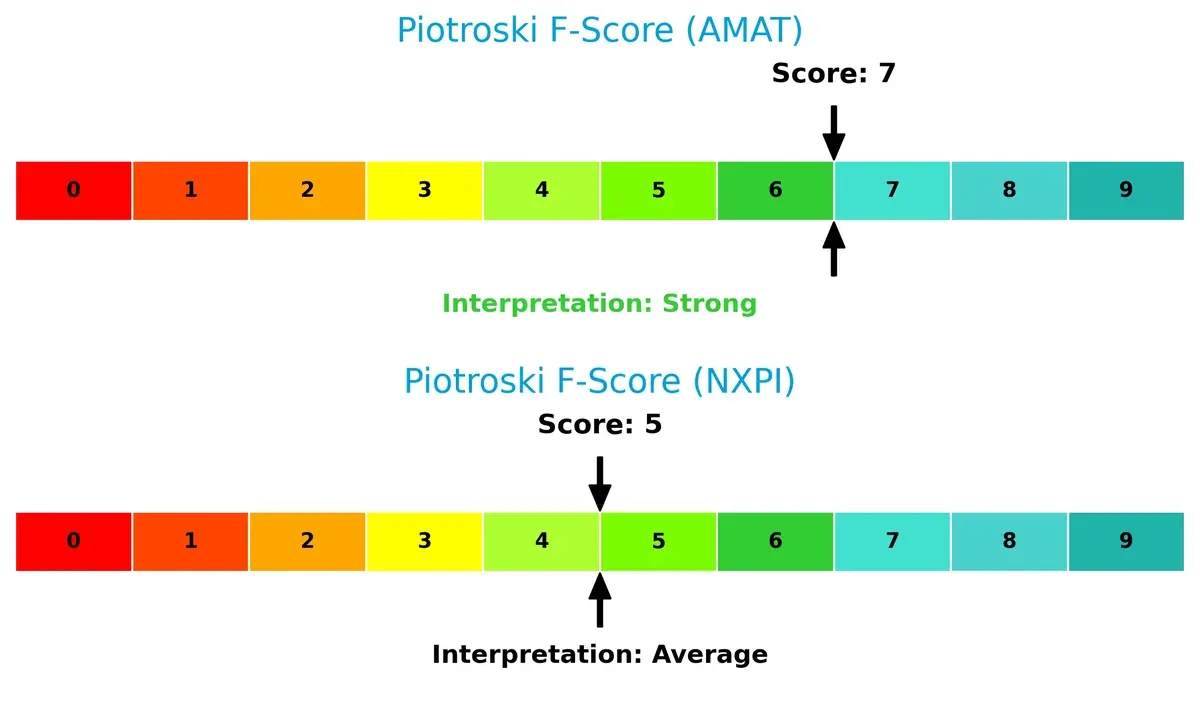
Financial Health: Quality of Operations
Applied Materials scores a strong 7 on the Piotroski F-Score, indicating robust financial health. NXP’s average 5 suggests moderate operational quality with potential red flags:
How are the two companies positioned?
This section dissects the operational DNA of AMAT and NXPI by comparing their revenue distribution and internal dynamics. The goal is to confront their economic moats to identify which model offers the most resilient competitive advantage today.
Revenue Segmentation: The Strategic Mix
This comparison dissects how Applied Materials, Inc. and NXP Semiconductors diversify income streams and reveals where their primary sector bets concentrate:
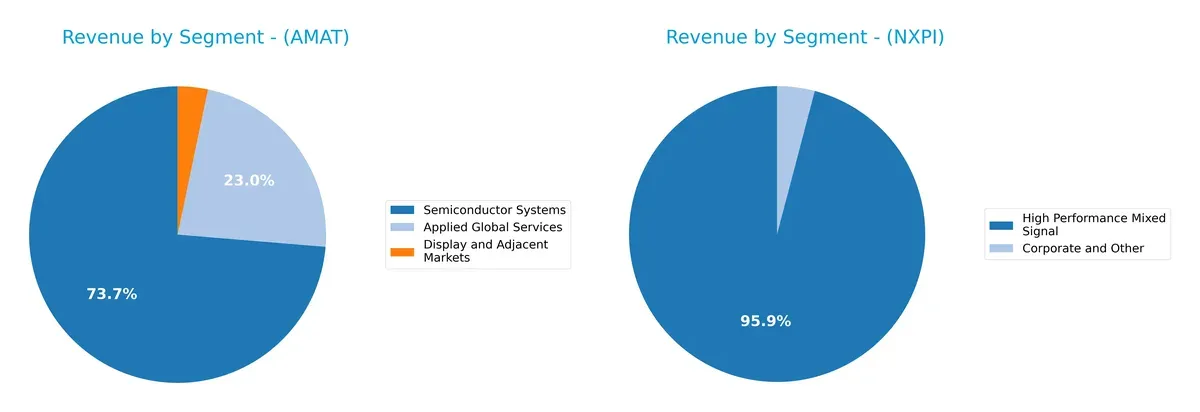
Applied Materials leans heavily on its Semiconductor Systems segment, generating $19.9B in 2024, while Applied Global Services adds $6.2B. Display markets remain minor at $885M. In contrast, NXP Semiconductors pivots around High Performance Mixed Signal at $9B, with Standard Products negligible or zero recently. AMAT’s concentrated semiconductor dominance anchors its infrastructure leadership but carries concentration risk. NXPI’s narrower mix suggests focused expertise but less diversification.
Strengths and Weaknesses Comparison
This table compares the strengths and weaknesses of Applied Materials, Inc. (AMAT) and NXP Semiconductors N.V. (NXPI):
AMAT Strengths
- High net margin (24.67%) and ROE (34.28%) indicate strong profitability
- Robust ROIC (21.96%) well above WACC
- Solid liquidity with current ratio 2.61 and quick ratio 1.87
- Low debt-to-equity (0.35) and strong interest coverage (35.46)
- Diversified revenue streams across Applied Global Services, Semiconductor Systems, Display markets
- Significant global presence with over $10B revenue from China and broad geographic diversification
NXPI Strengths
- Positive net margin (16.47%) and ROE (20.1%) support profitability
- ROIC (11.03%) exceeds WACC (9.36%), showing value creation
- Favorable liquidity ratios with current ratio 2.05 and quick ratio 1.38
- Adequate interest coverage (7.97)
- Focused revenue in High Performance Mixed Signal segment
- Global footprint includes strong presence in China ($4.56B) and diversified regions like Germany and Singapore
AMAT Weaknesses
- High WACC (11.43%) potentially increases capital costs
- Elevated valuation multiples (PE 26.58, PB 9.11) may pressure returns
- Relatively low dividend yield (0.74%)
- Asset turnover neutral at 0.78, limiting efficiency gains
NXPI Weaknesses
- High debt-to-equity (1.22) signals leveraged balance sheet
- Asset turnover weak at 0.46, indicating lower efficiency
- Valuation multiples high (PE 27.14, PB 5.45)
- Dividend yield moderate (1.87%) with neutral rating
Both companies show solid profitability and global reach, yet AMAT demonstrates stronger capital structure and liquidity. NXPI’s higher leverage and weaker asset efficiency highlight risks despite its favorable profitability. These factors play key roles in shaping each company’s strategic priorities.
The Moat Duel: Analyzing Competitive Defensibility
A structural moat is the only shield protecting long-term profits from relentless competitive erosion. Let’s dissect these moats:
Applied Materials, Inc.: Scale and Innovation Moat
Applied Materials leverages a cost advantage and technological breadth, reflected in a strong 33.6% EBIT margin and 24.7% net margin. Despite a declining ROIC trend, new semiconductor process technologies could deepen its moat through product innovation.
NXP Semiconductors N.V.: Specialized Product Moat
NXP relies on intangible assets and product specialization, especially in automotive and IoT chips. Its higher gross margin (54.4%) signals pricing power, but shrinking ROIC and recent margin pressure show vulnerability. Expansion into emerging connectivity solutions may offer growth avenues.
Verdict: Scale Innovation vs. Specialized Differentiation
Applied Materials commands a wider moat through scale and operational efficiency, sustaining value creation despite margin pressures. NXP’s narrower moat faces profitability headwinds, making Applied Materials better equipped to defend market share in 2026.
Which stock offers better returns?
Both Applied Materials, Inc. and NXP Semiconductors N.V. reveal distinct price dynamics over the past year, reflecting divergent market trajectories and trading patterns.
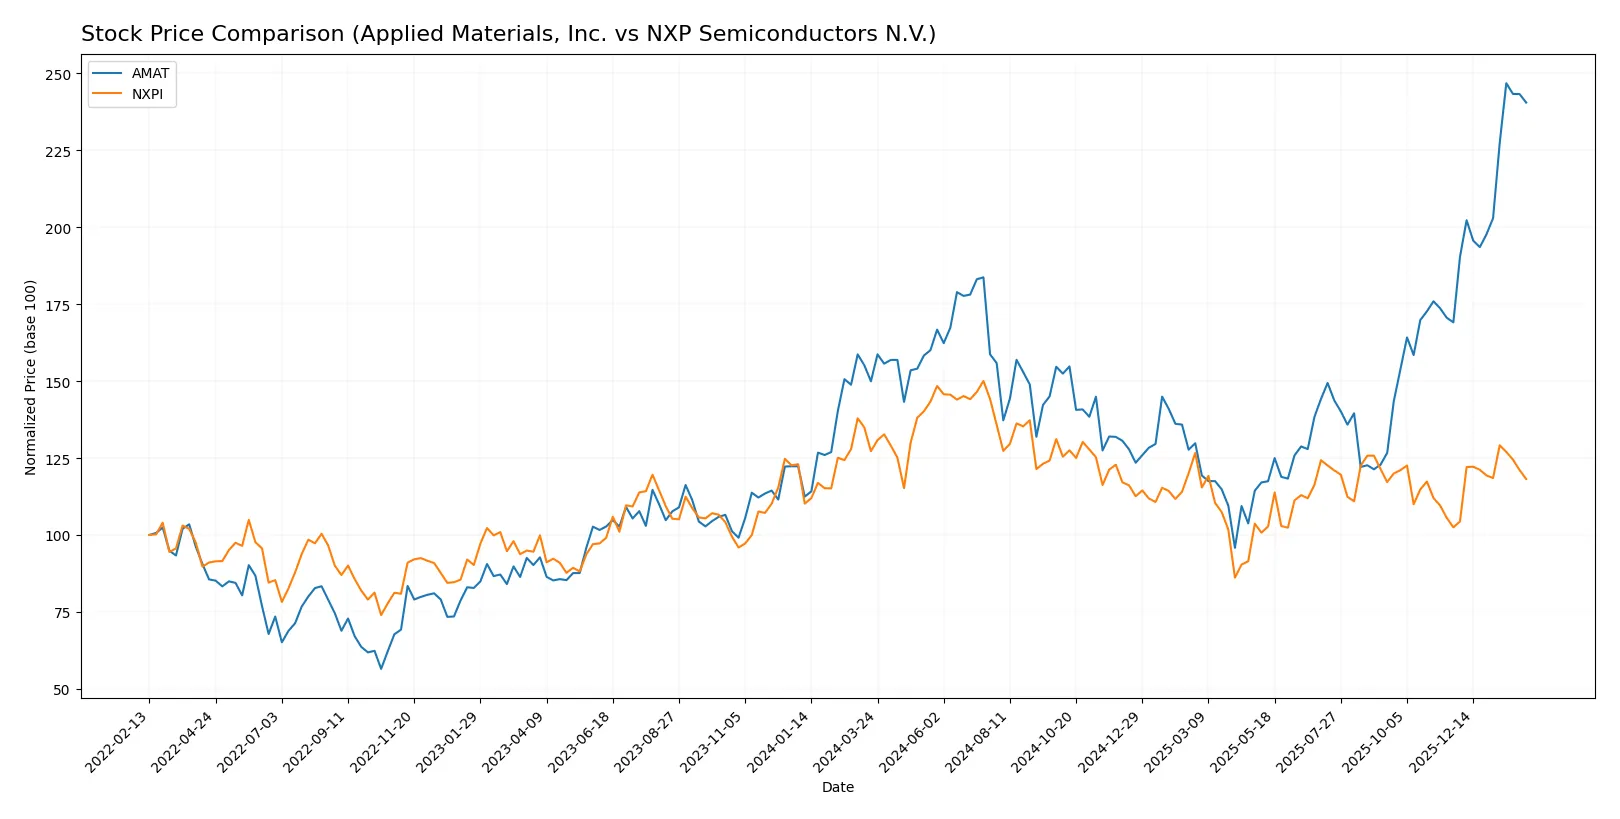
Trend Comparison
Applied Materials, Inc. (AMAT) posted a strong 60.42% price increase over the past 12 months, signaling a bullish trend with accelerating momentum and a high volatility level (std dev 40.75). The stock ranged from 127 to 327 during this period.
NXP Semiconductors N.V. (NXPI) declined 7.11% over the same timeframe, marking a bearish trend despite acceleration in price movement. Its volatility is lower (std dev 24.1), with prices fluctuating between 161 and 280.
AMAT outperformed NXPI decisively, delivering the highest market return over the past year and demonstrating stronger price acceleration and volume growth.
Target Prices
Analysts present a moderately bullish outlook on Applied Materials, Inc. and NXP Semiconductors N.V. with a clear consensus on upside potential.
| Company | Target Low | Target High | Consensus |
|---|---|---|---|
| Applied Materials, Inc. | 290 | 405 | 360.56 |
| NXP Semiconductors N.V. | 215 | 280 | 245 |
The consensus target for Applied Materials sits roughly 13% above the current price of $319, signaling expected growth. NXP’s target consensus at $245 offers about 11% upside versus the current $221, reflecting moderate analyst optimism.

Don’t Let Luck Decide Your Entry Point
Optimize your entry points with our advanced ProRealTime indicators. You’ll get efficient buy signals with precise price targets for maximum performance. Start outperforming now!
How do institutions grade them?
Applied Materials, Inc. Grades
The latest institutional ratings for Applied Materials, Inc. reflect mostly upgrades and strong buy-side sentiment:
| Grading Company | Action | New Grade | Date |
|---|---|---|---|
| Morgan Stanley | Maintain | Overweight | 2026-02-02 |
| Mizuho | Upgrade | Outperform | 2026-01-28 |
| Deutsche Bank | Upgrade | Buy | 2026-01-23 |
| Needham | Maintain | Buy | 2026-01-20 |
| Keybanc | Maintain | Overweight | 2026-01-16 |
| Barclays | Upgrade | Overweight | 2026-01-15 |
| Wells Fargo | Maintain | Overweight | 2026-01-15 |
| Stifel | Maintain | Buy | 2026-01-14 |
| B of A Securities | Maintain | Buy | 2026-01-13 |
| Susquehanna | Upgrade | Positive | 2026-01-12 |
NXP Semiconductors N.V. Grades
NXP Semiconductors N.V. holds steady institutional ratings without recent upgrades or downgrades:
| Grading Company | Action | New Grade | Date |
|---|---|---|---|
| Citigroup | Maintain | Buy | 2026-01-15 |
| Wells Fargo | Maintain | Overweight | 2026-01-15 |
| Truist Securities | Maintain | Buy | 2025-12-19 |
| JP Morgan | Maintain | Neutral | 2025-10-29 |
| Truist Securities | Maintain | Buy | 2025-10-29 |
| Susquehanna | Maintain | Neutral | 2025-07-23 |
| Truist Securities | Maintain | Buy | 2025-07-23 |
| JP Morgan | Maintain | Neutral | 2025-07-23 |
| Wells Fargo | Maintain | Overweight | 2025-07-23 |
| Barclays | Maintain | Overweight | 2025-07-22 |
Which company has the best grades?
Applied Materials, Inc. consistently receives upgrades and a cluster of buy and outperform ratings. NXP Semiconductors maintains mostly stable buy and overweight ratings without recent upgrades. Investors may interpret Applied Materials’ momentum as a sign of stronger institutional conviction.
Risks specific to each company
The following categories identify the critical pressure points and systemic threats facing both firms in the 2026 market environment:
1. Market & Competition
Applied Materials, Inc.
- Faces intense competition in semiconductor equipment with rapid technology cycles.
NXP Semiconductors N.V.
- Competes in diverse semiconductor niches but less scale than AMAT.
2. Capital Structure & Debt
Applied Materials, Inc.
- Maintains a conservative debt profile with low leverage (D/E 0.35).
NXP Semiconductors N.V.
- Carries higher leverage (D/E 1.22), increasing financial risk.
3. Stock Volatility
Applied Materials, Inc.
- Exhibits higher beta (1.677), reflecting more volatile price swings.
NXP Semiconductors N.V.
- Lower beta (1.458) suggests relatively less stock price volatility.
4. Regulatory & Legal
Applied Materials, Inc.
- Operates globally with exposure to export controls and tech regulations.
NXP Semiconductors N.V.
- Faces complex EU and US regulatory environments given its Dutch headquarters.
5. Supply Chain & Operations
Applied Materials, Inc.
- Relies on global supply chains, vulnerable to semiconductor equipment bottlenecks.
NXP Semiconductors N.V.
- Supply chain sensitive to geopolitical tensions in Asia and Europe.
6. ESG & Climate Transition
Applied Materials, Inc.
- Increasing pressure to reduce carbon footprint in manufacturing processes.
NXP Semiconductors N.V.
- Faces ESG scrutiny focused on sustainable sourcing and emissions.
7. Geopolitical Exposure
Applied Materials, Inc.
- High exposure to US-China tensions affecting semiconductor supply chains.
NXP Semiconductors N.V.
- Significant geopolitical risk due to operations in Europe and Asia.
Which company shows a better risk-adjusted profile?
Applied Materials’ strongest risk is geopolitical exposure, especially US-China tensions affecting supply chains. NXP’s key risk is its elevated leverage, increasing financial vulnerability. AMAT’s lower debt and stronger financial metrics give it a superior risk-adjusted profile. Its Altman Z-score of 13.8 signals very low bankruptcy risk, while NXP’s 3.1, though safe, is far closer to distress thresholds. This contrast highlights AMAT’s prudent capital allocation and resilience amid market volatility.
Final Verdict: Which stock to choose?
Applied Materials, Inc. (AMAT) excels as a capital-efficient powerhouse with a strong economic moat, generating returns well above its cost of capital. Its slight decline in profitability signals a point of vigilance for investors. AMAT suits portfolios focused on aggressive growth and value creation.
NXP Semiconductors N.V. (NXPI) leverages its strategic moat in high-margin, R&D-intensive semiconductor niches, supported by solid recurring revenue streams. While its leverage raises some caution, it offers relatively more stability than AMAT. NXPI fits well within Growth at a Reasonable Price (GARP) portfolios seeking steady innovation exposure.
If you prioritize robust capital efficiency and value creation, AMAT is the compelling choice due to its superior ROIC profile and accelerating bullish price trend. However, if you seek a relatively safer growth play with a durable technological moat, NXPI offers better stability despite its higher leverage and recent bearish pressures. Both present analytical scenarios tailored to distinct investor risk appetites.
Disclaimer: Investment carries a risk of loss of initial capital. The past performance is not a reliable indicator of future results. Be sure to understand risks before making an investment decision.
Go Further
I encourage you to read the complete analyses of Applied Materials, Inc. and NXP Semiconductors N.V. to enhance your investment decisions: