In the fast-evolving semiconductor industry, NVIDIA Corporation and Applied Materials, Inc. stand out as pivotal players shaping technology’s future. NVIDIA leads in graphics processing and AI computing solutions, while Applied Materials excels in manufacturing equipment essential for chip production. Their complementary roles and innovation strategies make them natural comparators. This article will guide you through their strengths to identify which stock could be the smarter addition to your investment portfolio.
Table of contents
Companies Overview
I will begin the comparison between NVIDIA Corporation and Applied Materials, Inc. by providing an overview of these two companies and their main differences.
NVIDIA Overview
NVIDIA Corporation focuses on providing graphics, compute, and networking solutions globally. Its products serve gaming, professional visualization, data centers, and automotive markets. NVIDIA’s offerings include GeForce GPUs, AI platforms, and automotive AI solutions. The company is a major player in the semiconductor industry, emphasizing innovative technologies such as AI and virtual computing, headquartered in Santa Clara, California.
Applied Materials Overview
Applied Materials, Inc. supplies manufacturing equipment, services, and software primarily for semiconductor and display industries. It operates through segments focused on semiconductor systems, global services, and display technologies. The company’s products support semiconductor fabrication and display manufacturing across multiple global regions. Based in Santa Clara, California, Applied Materials is a well-established firm with a diverse industrial equipment portfolio.
Key similarities and differences
Both companies operate in the semiconductor sector and are headquartered in Santa Clara, employing roughly 36,000 people each. NVIDIA’s business centers on designing and selling advanced computing and graphics solutions, while Applied Materials concentrates on manufacturing equipment and services for chip and display production. Thus, NVIDIA leans towards product innovation and software, whereas Applied Materials focuses on industrial manufacturing technology and support services.
Income Statement Comparison
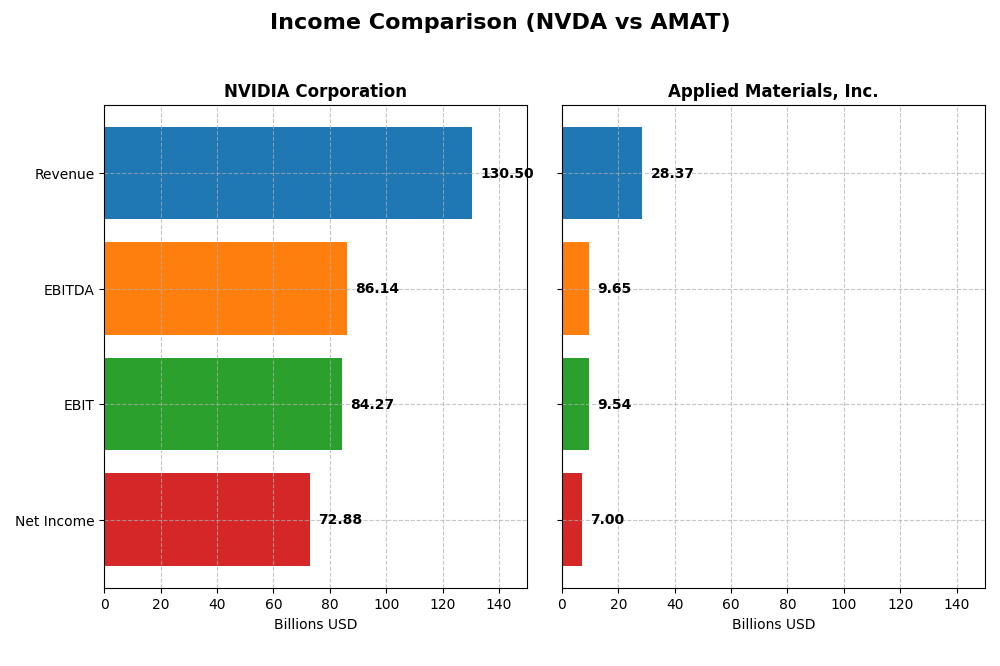
The table below presents a clear side-by-side comparison of key income statement metrics for NVIDIA Corporation and Applied Materials, Inc. for their most recent fiscal year.
| Metric | NVIDIA Corporation | Applied Materials, Inc. |
|---|---|---|
| Market Cap | 4.46T | 240.5B |
| Revenue | 130.5B | 28.4B |
| EBITDA | 86.1B | 9.7B |
| EBIT | 84.3B | 9.5B |
| Net Income | 72.9B | 7.0B |
| EPS | 2.97 | 8.71 |
| Fiscal Year | 2025 | 2025 |
Income Statement Interpretations
NVIDIA Corporation
NVIDIA’s revenue and net income have shown strong upward trends from 2021 to 2025, with revenue surging from $16.7B to $130.5B and net income rising from $4.3B to $72.9B. Margins improved notably, with a 74.99% gross margin and 55.85% net margin in 2025. The latest year demonstrated accelerated growth with revenue doubling and margin expansion.
Applied Materials, Inc.
Applied Materials experienced steady revenue growth from $23.1B in 2021 to $28.4B in 2025, and net income increased moderately from $5.9B to $7.0B. Margins remained stable but lower than NVIDIA’s, with a 48.67% gross margin and 24.67% net margin in 2025. The most recent year showed modest revenue growth but a slight decline in net margin.
Which one has the stronger fundamentals?
NVIDIA exhibits stronger fundamentals with consistently favorable margin improvements and exceptional growth rates in revenue, net income, and earnings per share. Applied Materials maintains favorable but less robust margins and growth, with some unfavorable trends in operating expenses and net margin. Overall, NVIDIA’s income statement reflects more dynamic and expanding profitability.
Financial Ratios Comparison
The table below presents a side-by-side comparison of key financial ratios for NVIDIA Corporation (NVDA) and Applied Materials, Inc. (AMAT) based on their most recent fiscal year data for 2025.
| Ratios | NVIDIA Corporation (NVDA) | Applied Materials, Inc. (AMAT) |
|---|---|---|
| ROE | 91.87% | 34.28% |
| ROIC | 75.28% | 21.96% |
| P/E | 39.90 | 26.58 |
| P/B | 36.66 | 9.11 |
| Current Ratio | 4.44 | 2.61 |
| Quick Ratio | 3.88 | 1.87 |
| D/E (Debt-to-Equity) | 0.13 | 0.35 |
| Debt-to-Assets | 9.20% | 19.42% |
| Interest Coverage | 329.77 | 30.81 |
| Asset Turnover | 1.17 | 0.78 |
| Fixed Asset Turnover | 16.16 | 5.54 |
| Payout ratio | 1.14% | 19.78% |
| Dividend yield | 0.029% | 0.744% |
Interpretation of the Ratios
NVIDIA Corporation
NVIDIA shows strong profitability with a net margin of 55.85% and robust returns on equity (91.87%) and invested capital (75.28%), indicating effective asset utilization. However, valuation metrics like PE (39.9) and PB (36.66) are high, suggesting potential overvaluation risks. The current ratio is elevated at 4.44, which may imply inefficient capital use. NVIDIA pays a modest dividend yield of 0.03%, with limited payout significance relative to its cash flow.
Applied Materials, Inc.
Applied Materials presents solid financial health, with favorable net margin (24.67%) and return on equity (34.28%). Its debt levels remain manageable with a debt-to-assets ratio of 19.42%, and liquidity ratios are sound. The PE ratio at 26.58 and PB at 9.11 are lower than NVIDIA’s but still indicate a premium valuation. The company offers a dividend yield of 0.74%, supported by positive cash flow, balancing shareholder returns with reinvestment.
Which one has the best ratios?
Both companies demonstrate favorable overall ratios at 64.29%, yet NVIDIA excels in profitability and returns, while Applied Materials maintains better valuation and liquidity balance. NVIDIA’s higher leverage efficiency contrasts with its elevated valuation metrics. Applied Materials’ more moderate valuation and dividend yield present a different risk profile. Each shows strengths and weaknesses across key financial dimensions.
Strategic Positioning
This section compares the strategic positioning of NVIDIA Corporation and Applied Materials, Inc., focusing on market position, key segments, and exposure to technological disruption:
NVIDIA Corporation
- Market leader in semiconductors with intense competitive pressure
- Key segments: Data Center, Gaming, Automotive, Professional Visualization
- Exposed to rapid innovation in AI, gaming, autonomous driving
Applied Materials, Inc.
- Significant player in semiconductor manufacturing equipment sector
- Key segments: Semiconductor Systems, Applied Global Services, Display and Adjacent Markets
- Exposed to evolving semiconductor fabrication technologies
NVIDIA Corporation vs Applied Materials, Inc. Positioning
NVIDIA pursues a diversified strategy across gaming, data center, automotive, and professional visualization markets, while Applied Materials concentrates on semiconductor manufacturing equipment and related services. NVIDIA’s approach offers broader market exposure, whereas Applied Materials focuses on specialized equipment segments.
Which has the best competitive advantage?
NVIDIA shows a very favorable moat with a strong and growing ROIC well above WACC, indicating durable competitive advantage. Applied Materials creates value but faces a declining ROIC trend, implying a slightly favorable moat with less durable profitability.
Stock Comparison
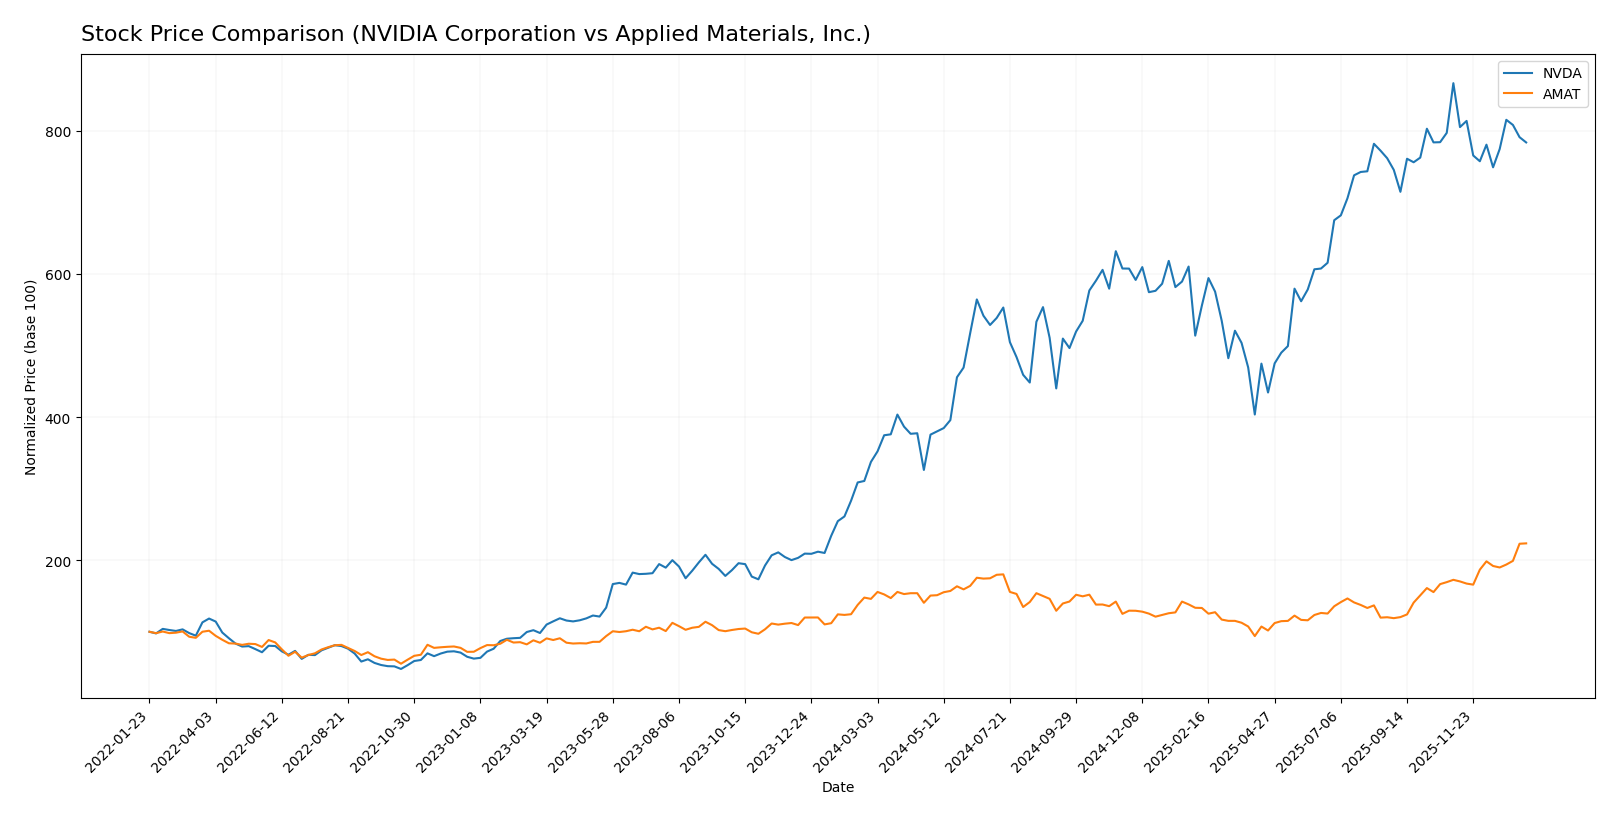
The stock price dynamics over the past 12 months reveal significant bullish momentum for both NVIDIA Corporation and Applied Materials, Inc., with NVIDIA showing a strong gain but recent deceleration, while Applied Materials exhibits accelerating growth.
Trend Analysis
NVIDIA Corporation’s stock rose 132.35% over the past year, indicating a bullish trend with deceleration. The price ranged from $76.2 to $202.49, with volatility measured by a 32.46 std deviation. Recently, the trend turned negative, falling 9.56%.
Applied Materials, Inc. recorded a 53.12% gain over the same period, reflecting a bullish trend with acceleration. Its price fluctuated between $126.95 and $301.89, showing volatility at 33.84 std deviation. Recent activity saw a 29.51% increase.
Comparing both, NVIDIA delivered the highest market performance over the last year despite recent weakness, outperforming Applied Materials’ gain by nearly 79 percentage points.
Target Prices
The target price consensus for NVIDIA Corporation and Applied Materials, Inc. reflects optimistic analyst expectations.
| Company | Target High | Target Low | Consensus |
|---|---|---|---|
| NVIDIA Corporation | 352 | 140 | 264.34 |
| Applied Materials, Inc. | 400 | 250 | 315.57 |
Analysts expect both stocks to appreciate, with NVIDIA’s consensus target notably above its current price of 183.14 USD, and Applied Materials’ target close to but slightly above its current price of 301.89 USD.
Analyst Opinions Comparison
This section compares analysts’ ratings and grades for NVIDIA Corporation and Applied Materials, Inc.:
Rating Comparison
NVIDIA Corporation Rating
- Rating: B+, rated as Very Favorable overall
- Discounted Cash Flow Score: 3, indicating moderate valuation
- ROE Score: 5, showing very favorable profit generation
- ROA Score: 5, reflecting very effective asset utilization
- Debt To Equity Score: 3, moderate financial risk
- Overall Score: 3, indicating a moderate overall rating
Applied Materials, Inc. Rating
- Rating: B+, rated as Very Favorable overall
- Discounted Cash Flow Score: 3, indicating moderate valuation
- ROE Score: 5, showing very favorable profit generation
- ROA Score: 5, reflecting very effective asset utilization
- Debt To Equity Score: 2, moderate but slightly better score
- Overall Score: 3, indicating a moderate overall rating
Which one is the best rated?
Both NVIDIA and Applied Materials share identical ratings of B+ and moderate overall scores. While both have strong ROE and ROA scores, Applied Materials has a slightly better debt-to-equity score, but this does not change the overall rating comparison.
Scores Comparison
Here is a comparison of the Altman Z-Score and Piotroski Score for NVIDIA and Applied Materials:
NVIDIA Scores
- Altman Z-Score: 68.04, indicating a strong safe zone.
- Piotroski Score: 6, assessed as average financial health.
Applied Materials Scores
- Altman Z-Score: 13.45, also in the safe zone.
- Piotroski Score: 7, reflecting strong financial health.
Which company has the best scores?
Applied Materials shows a lower Altman Z-Score but remains in the safe zone, with a higher Piotroski Score of 7 compared to NVIDIA’s 6. Based strictly on these scores, Applied Materials demonstrates slightly stronger financial health.
Grades Comparison
The recent grades from prominent financial institutions for NVIDIA Corporation and Applied Materials, Inc. are as follows:
NVIDIA Corporation Grades
This table summarizes the latest grades assigned by credible financial analysts for NVIDIA Corporation:
| Grading Company | Action | New Grade | Date |
|---|---|---|---|
| Mizuho | Maintain | Outperform | 2026-01-09 |
| Truist Securities | Maintain | Buy | 2025-12-29 |
| Stifel | Maintain | Buy | 2025-12-29 |
| B of A Securities | Maintain | Buy | 2025-12-26 |
| Baird | Maintain | Outperform | 2025-12-26 |
| Bernstein | Maintain | Outperform | 2025-12-26 |
| Truist Securities | Maintain | Buy | 2025-12-19 |
| Tigress Financial | Maintain | Strong Buy | 2025-12-18 |
| Morgan Stanley | Maintain | Overweight | 2025-12-01 |
| Deutsche Bank | Maintain | Hold | 2025-11-20 |
NVIDIA’s grades predominantly reflect strong buy and buy ratings with consistent maintenance of positive outlooks.
Applied Materials, Inc. Grades
This table presents the recent grades issued by respected grading firms for Applied Materials, Inc.:
| Grading Company | Action | New Grade | Date |
|---|---|---|---|
| B of A Securities | Maintain | Buy | 2026-01-13 |
| Susquehanna | Upgrade | Positive | 2026-01-12 |
| Cantor Fitzgerald | Maintain | Overweight | 2026-01-08 |
| B. Riley Securities | Maintain | Buy | 2025-12-18 |
| Mizuho | Maintain | Neutral | 2025-12-17 |
| Wells Fargo | Maintain | Overweight | 2025-12-15 |
| Jefferies | Maintain | Buy | 2025-12-15 |
| Keybanc | Maintain | Overweight | 2025-12-02 |
| UBS | Upgrade | Buy | 2025-11-25 |
| B. Riley Securities | Maintain | Buy | 2025-11-14 |
Applied Materials’ ratings generally show buy and overweight recommendations with some recent upgrades.
Which company has the best grades?
Between the two, NVIDIA Corporation has received a higher proportion of strong buy and outperform grades, indicating a more positive analyst consensus. Applied Materials, Inc. shows solid buy and overweight ratings but fewer top-tier grades. This difference could influence investors seeking stronger growth potential versus stable performance.
Strengths and Weaknesses
Below is a comparison of key strengths and weaknesses for NVIDIA Corporation and Applied Materials, Inc. based on their latest financial and operational data.
| Criterion | NVIDIA Corporation (NVDA) | Applied Materials, Inc. (AMAT) |
|---|---|---|
| Diversification | Strong, with major revenues from Data Center (115B), Gaming (11.35B), Automotive (1.69B), and Professional Visualization (1.88B) segments | Moderate, focused on Semiconductor Systems (19.9B), Applied Global Services (6.2B), and Display markets (0.9B) |
| Profitability | Very high net margin (55.85%), ROIC at 75.3%, and ROE at 91.9% indicating excellent profitability | Good net margin (24.7%), ROIC at 22.0%, ROE at 34.3%, profitable but less than NVDA |
| Innovation | Very strong, reflected by very favorable economic moat and rapidly growing ROIC (+339% over 2021-2025) | Moderate innovation, value creation but declining ROIC (-28% over 2021-2025) indicates challenges in sustaining growth |
| Global presence | Extensive, driven by leadership in AI, data centers, and gaming globally | Strong presence in semiconductor manufacturing equipment markets worldwide, but less diversified |
| Market Share | Leading in GPUs and AI hardware with dominant market share in Data Center and Gaming | Significant market share in semiconductor equipment but faces competitive pressure and slower growth |
NVIDIA demonstrates a robust and rapidly growing business with strong profitability and diversification, supported by innovation leadership. Applied Materials remains profitable with solid market positioning but shows signs of slowing growth and less diversification, suggesting a need for cautious optimism.
Risk Analysis
Below is a comparison table summarizing key risks for NVIDIA Corporation and Applied Materials, Inc. based on the most recent data from 2025.
| Metric | NVIDIA Corporation (NVDA) | Applied Materials, Inc. (AMAT) |
|---|---|---|
| Market Risk | High beta of 2.31 indicates elevated volatility | Moderate beta of 1.67 suggests average market sensitivity |
| Debt Level | Low debt-to-equity ratio at 0.13, low financial leverage | Moderate debt-to-equity at 0.35, higher but manageable leverage |
| Regulatory Risk | Exposure to international trade tensions, especially US-China relations | Similar exposure due to global operations, moderate risk |
| Operational Risk | High reliance on cutting-edge tech innovation; supply chain complexity | Complex manufacturing equipment supply chain; moderate risk |
| Environmental Risk | Moderate, given semiconductor manufacturing impact and energy use | Moderate, with focus on sustainable production processes |
| Geopolitical Risk | Significant due to global presence in sensitive tech sectors | Moderate, with operations in geopolitically sensitive regions |
NVIDIA faces the highest risk from market volatility and geopolitical tensions impacting its international supply chains, amplified by its high beta. Applied Materials has more balanced risks but must manage moderate debt and global regulatory environments. Both companies are financially stable but require caution due to sector cyclicality and geopolitical uncertainties.
Which Stock to Choose?
NVIDIA Corporation (NVDA) shows a strong income evolution with a 682.6% revenue growth over five years and a highly favorable net margin of 55.85%. Its profitability ratios, including ROE at 91.87% and ROIC at 75.28%, are excellent, supported by very low debt levels and a very favorable overall rating of B+.
Applied Materials, Inc. (AMAT) presents moderate income growth at 23.0% over the same period, with a solid net margin of 24.67%. Profitability metrics such as ROE at 34.28% and ROIC at 21.96% are favorable, though debt ratios are higher than NVDA’s, yet the company maintains a very favorable B+ rating.
For investors, NVDA’s robust income growth, superior profitability, and very favorable moat suggest potential appeal for growth-oriented profiles, while AMAT’s steadier income progression and solid financial ratios might be better suited for those valuing stability and strong cash flow. Both stocks carry a very favorable rating, indicating financial soundness but different investment characteristics.
Disclaimer: Investment carries a risk of loss of initial capital. The past performance is not a reliable indicator of future results. Be sure to understand risks before making an investment decision.
Go Further
I encourage you to read the complete analyses of NVIDIA Corporation and Applied Materials, Inc. to enhance your investment decisions: