Home > Comparison > Technology > AMAT vs NVEC
The strategic rivalry between Applied Materials, Inc. and NVE Corporation shapes innovation in the semiconductor sector. Applied Materials operates as a capital-intensive manufacturing equipment giant, serving broad semiconductor and display markets. In contrast, NVE Corporation specializes as a niche spintronics device innovator with a lean operational model. This analysis examines their divergent corporate trajectories to identify which offers superior risk-adjusted returns for a diversified portfolio in this dynamic technology landscape.
Table of contents
Companies Overview
Applied Materials and NVE Corporation both play pivotal roles in the semiconductor industry but occupy vastly different scales and niches.
Applied Materials, Inc.: Semiconductor Manufacturing Powerhouse
Applied Materials dominates as a global leader in manufacturing equipment for semiconductor fabrication. Its revenue stems from selling advanced tools and technologies across three segments: Semiconductor Systems, Applied Global Services, and Display Markets. In 2026, it focuses strategically on optimizing fab performance and expanding its footprint in cutting-edge display technologies.
NVE Corporation: Spintronics Innovator
NVE Corporation specializes in spintronic sensor and coupler technology for factory automation and medical devices. Its revenue comes from niche products that leverage electron spin for data acquisition and transmission. In 2026, NVE emphasizes research and licensing of magnetoresistive memory technology, targeting industrial IoT and custom sensor markets.
Strategic Collision: Similarities & Divergences
Applied Materials pursues a broad, equipment-based strategy with a global scale and diversified product portfolio, while NVE bets on a highly specialized, innovative technology niche. Their competition centers on semiconductor component innovation but targets different customer bases. Applied Materials offers scale-driven stability; NVE provides a high-risk, high-reward innovation profile.
Income Statement Comparison
This data dissects the core profitability and scalability of both corporate engines to reveal who dominates the bottom line in the most recent fiscal year:

| Metric | Applied Materials, Inc. (AMAT) | NVE Corporation (NVEC) |
|---|---|---|
| Revenue | 28.4B | 25.9M |
| Cost of Revenue | 14.6B | 4.2M |
| Operating Expenses | 5.5B | 5.6M |
| Gross Profit | 13.8B | 21.6M |
| EBITDA | 9.7B | 16.3M |
| EBIT | 9.5B | 16.0M |
| Interest Expense | 269M | 0 |
| Net Income | 7.0B | 15.1M |
| EPS | 8.71 | 3.12 |
| Fiscal Year | 2025 | 2025 |
Income Statement Analysis: The Bottom-Line Duel
This income statement comparison reveals which company runs its business more efficiently through revenue and profitability measures.
Applied Materials, Inc. Analysis
Applied Materials shows steady revenue growth from $23B in 2021 to $28.4B in 2025. Its gross margin holds strong near 49%, and net margin remains healthy at 24.7%. Despite a slight 6.6% dip in net margin last year, EBIT surged 13.6%, highlighting operational momentum and disciplined cost control.
NVE Corporation Analysis
NVE’s revenue declined 13% last year to $25.9M after peaking at $38.3M in 2023. Yet, its gross margin soars above 83%, and net margin impressively stands at 58.2%. EBIT margin also dominates at 61.8%. This signals high profitability but recent top-line contraction challenges sustainability.
Margin Strength vs. Revenue Growth
Applied Materials delivers consistent revenue expansion and stable margins, reflecting balanced growth and efficiency. NVE commands superior margins but faces recent revenue shrinkage. For investors, AMAT’s profile suits those prioritizing steady scale, while NVEC appeals to margin-focused strategies amid volatility.
Financial Ratios Comparison
These vital ratios act as a diagnostic tool to expose the underlying fiscal health, valuation premiums, and capital efficiency of the companies compared below:
| Ratios | Applied Materials, Inc. (AMAT) | NVE Corporation (NVEC) |
|---|---|---|
| ROE | 34.3% | 24.2% |
| ROIC | 22.0% | 21.1% |
| P/E | 26.6 | 20.5 |
| P/B | 9.11 | 4.95 |
| Current Ratio | 2.61 | 28.40 |
| Quick Ratio | 1.87 | 22.03 |
| D/E | 0.35 | 0.015 |
| Debt-to-Assets | 19.4% | 1.4% |
| Interest Coverage | 30.8 | 0 |
| Asset Turnover | 0.78 | 0.40 |
| Fixed Asset Turnover | 5.54 | 8.91 |
| Payout ratio | 19.8% | 128.4% |
| Dividend yield | 0.74% | 6.28% |
| Fiscal Year | 2025 | 2025 |
Efficiency & Valuation Duel: The Vital Signs
Financial ratios act as a company’s DNA, revealing hidden risks and operational excellence through key profitability and valuation signals.
Applied Materials, Inc.
Applied Materials delivers a robust 34.3% ROE and a solid 24.7% net margin, showcasing operational efficiency. However, its P/E of 26.6 and P/B of 9.1 mark the stock as stretched compared to sector norms. Shareholders see modest 0.74% dividends, with strong reinvestment in R&D fueling growth.
NVE Corporation
NVE posts a compelling 58.2% net margin but a lower 24.2% ROE, indicating high profitability with moderate equity efficiency. The valuation is more reasonable, with a P/E of 20.5 but a stretched P/B of 4.95. NVE balances shareholder returns with a 6.3% dividend yield and sustained R&D investment.
Valuation Stretch vs. Profitability Muscle
Applied Materials edges with higher equity returns but trades at a premium valuation. NVE offers superior net margins and dividends but at a slightly lower ROE. Investors targeting growth may prefer Applied Materials, while income-focused profiles might favor NVE’s dividend yield and margins.
Which one offers the Superior Shareholder Reward?
I observe Applied Materials (AMAT) pays a modest dividend yield of ~0.78% with a sustainable payout ratio near 20%. Its buyback program is steady, enhancing shareholder value through free cash flow (7B FCF in 2025). NVE Corporation (NVEC), by contrast, yields a hefty 6.3% dividend but at a payout ratio exceeding 100%, signaling risk. NVEC’s limited buyback activity and high payout strain sustainability. AMAT’s balanced dividend and consistent buybacks offer a more durable total return profile in 2026. I conclude AMAT provides superior shareholder reward through prudent capital allocation and sustainable income growth.
Comparative Score Analysis: The Strategic Profile
The radar chart reveals the fundamental DNA and trade-offs of Applied Materials, Inc. and NVE Corporation, highlighting their financial strengths and valuation nuances:

Applied Materials shows robust profitability with top ROE and ROA scores (5 each) but struggles on valuation metrics, scoring very low on price-to-book (1). NVE Corporation matches profitability scores but maintains a stronger balance sheet with a favorable debt-to-equity score (4) and better valuation scores overall. NVE offers a more balanced profile, while Applied Materials relies heavily on operational efficiency but risks overvaluation.
Bankruptcy Risk: Solvency Showdown
The Altman Z-Score comparison highlights both firms firmly in the safe zone, though NVE’s exceptionally high score signals superior long-term solvency and resilience in this cycle:

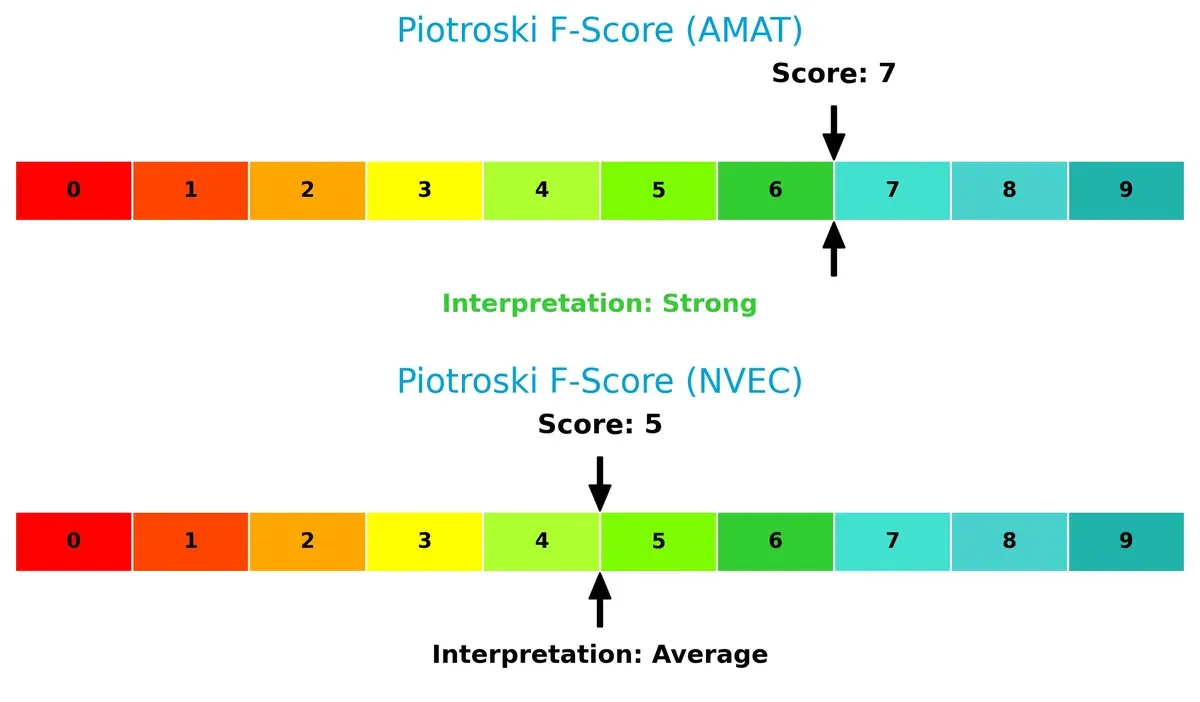
Financial Health: Quality of Operations
Applied Materials leads with a strong Piotroski F-Score of 7, indicating solid financial health, while NVE’s score of 5 suggests average operational quality and potential red flags in internal metrics:
How are the two companies positioned?
This section dissects the operational DNA of AMAT and NVEC by analyzing their revenue distribution and internal dynamics. The goal is to confront their economic moats and identify which model offers the most resilient, sustainable competitive advantage today.
Revenue Segmentation: The Strategic Mix
The following comparison dissects how Applied Materials, Inc. and NVE Corporation diversify their income streams and where their primary sector bets lie:

Applied Materials anchors its revenue in Semiconductor Systems with $19.9B, while Applied Global Services adds $6.2B, showing a balanced multi-segment presence. In contrast, NVE Corporation pivots almost entirely on its Product segment, generating $25.9M, with minimal Contract Research and Development at $1.1M. Applied Materials’ mix reduces concentration risk and leverages infrastructure dominance, whereas NVE’s heavy reliance on one segment exposes it to higher volatility.
Strengths and Weaknesses Comparison
This table compares the Strengths and Weaknesses of Applied Materials, Inc. (AMAT) and NVE Corporation (NVEC):
AMAT Strengths
- Diversified revenue streams across Semiconductor Systems and Applied Global Services
- Strong global presence with significant sales in China, Korea, and Taiwan
- Favorable profitability ratios with 24.67% net margin and 34.28% ROE
- Solid financial health indicated by current ratio of 2.61 and low debt-to-assets at 19.42%
- Innovation supported by high fixed asset turnover of 5.54
NVEC Strengths
- Exceptionally high net margin at 58.22% demonstrates strong profitability
- Very low leverage with debt-to-assets at 1.43% and near-infinite interest coverage
- Favorable ROIC of 21.14% with WACC at neutral 9.42% supports efficient capital allocation
- High fixed asset turnover of 8.91 indicates good asset utilization
- Strong quick ratio at 22.03 signals excellent short-term liquidity
AMAT Weaknesses
- Relatively high WACC at 11.37% weighs on capital efficiency
- Unfavorable valuation metrics with P/E of 26.58 and P/B of 9.11
- Dividend yield is low at 0.74%, limiting income appeal
- Neutral asset turnover at 0.78 suggests room for operational improvement
NVEC Weaknesses
- Extremely high current ratio of 28.4 may imply inefficient asset use
- Unfavorable price-to-book ratio of 4.95 may signal overvaluation
- Lower asset turnover at 0.4 reflects less efficient revenue generation
- Higher neutral P/E of 20.46 reduces growth valuation attractiveness
Both companies show favorable overall financial health and strong profitability but differ in capital structure and operational efficiency. AMAT leverages diversification and global scale, while NVEC excels in profitability and liquidity. Each faces valuation and efficiency challenges that could influence strategic priorities.
The Moat Duel: Analyzing Competitive Defensibility
A structural moat shields long-term profits from relentless competition erosion. It’s the single most critical factor for sustained value creation:
Applied Materials, Inc. (AMAT): Scale and Integration Moat
AMAT’s advantage lies in its cost leadership and integrated semiconductor equipment platform. High ROIC (above WACC by 10.6%) supports margin stability despite a recent ROIC decline. Expansion in Asia’s chip markets could deepen this moat but geopolitical risks loom in 2026.
NVE Corporation (NVEC): Innovation and Niche Specialization Moat
NVEC’s moat stems from proprietary spintronics technology, differentiating it sharply from AMAT’s broad manufacturing scale. It boasts a higher ROIC spread (11.7%) with a rising profitability trend, signaling durable value creation. Opportunities in industrial IoT and medical devices could accelerate growth in 2026.
Scale and Integration vs. Innovation and Specialization
NVEC exhibits a deeper, more durable moat driven by rising ROIC and unique technology. While AMAT leverages scale, its declining ROIC signals margin pressure ahead. NVEC appears better equipped to defend its niche market share in an evolving semiconductor landscape.
Which stock offers better returns?
Over the past year, Applied Materials, Inc. surged with strong gains and accelerating momentum, while NVE Corporation experienced a notable decline despite recent modest recovery signs.

Trend Comparison
Applied Materials, Inc. shows a 56.8% price increase over 12 months, marking a bullish trend with accelerating gains and high volatility. The stock reached a peak of 327.01 and a low of 126.95.
NVE Corporation declined 18.93% over the same period, reflecting a bearish trend despite acceleration. Its price fluctuated between 56.99 and 90.18, with low volatility compared to AMAT.
Applied Materials outperformed NVE Corporation substantially, delivering the strongest market performance amid higher volatility and robust upward momentum.
Target Prices
Applied Materials, Inc. shows a robust target price consensus from verified analysts.
| Company | Target Low | Target High | Consensus |
|---|---|---|---|
| Applied Materials, Inc. | 273 | 400 | 347.38 |
Analysts expect Applied Materials to appreciate, with a consensus target 8% above its current 322.32 price, signaling moderate upside potential. No verified target price data is available for NVE Corporation.

Don’t Let Luck Decide Your Entry Point
Optimize your entry points with our advanced ProRealTime indicators. You’ll get efficient buy signals with precise price targets for maximum performance. Start outperforming now!
How do institutions grade them?
The institutional grades for Applied Materials, Inc. are as follows:
Applied Materials, Inc. Grades
The table below summarizes recent grading actions by reputable financial institutions for Applied Materials, Inc.:
| Grading Company | Action | New Grade | Date |
|---|---|---|---|
| Mizuho | Upgrade | Outperform | 2026-01-28 |
| Deutsche Bank | Upgrade | Buy | 2026-01-23 |
| Needham | Maintain | Buy | 2026-01-20 |
| Keybanc | Maintain | Overweight | 2026-01-16 |
| Barclays | Upgrade | Overweight | 2026-01-15 |
| Wells Fargo | Maintain | Overweight | 2026-01-15 |
| Stifel | Maintain | Buy | 2026-01-14 |
| B of A Securities | Maintain | Buy | 2026-01-13 |
| Susquehanna | Upgrade | Positive | 2026-01-12 |
| Cantor Fitzgerald | Maintain | Overweight | 2026-01-08 |
NVE Corporation Grades
No reliable institutional grades are available for NVE Corporation.
Which company has the best grades?
Applied Materials, Inc. clearly holds superior institutional grades with multiple upgrades and consistent Buy or Overweight ratings. NVE Corporation lacks any available institutional grades, potentially limiting investor insight.
Risks specific to each company
The following categories identify the critical pressure points and systemic threats facing both firms in the 2026 market environment:
1. Market & Competition
Applied Materials, Inc. (AMAT)
- Operates in highly competitive semiconductor equipment markets with exposure to cyclical demand swings.
NVE Corporation (NVEC)
- Niche spintronics market with limited direct competitors but smaller scale limits market power.
2. Capital Structure & Debt
Applied Materials, Inc. (AMAT)
- Moderate debt-to-equity ratio (0.35) with strong interest coverage (35.46), indicating manageable leverage.
NVE Corporation (NVEC)
- Extremely low debt levels (0.01 debt-to-equity) and infinite interest coverage, signaling very conservative capital structure.
3. Stock Volatility
Applied Materials, Inc. (AMAT)
- Beta at 1.67, indicating higher volatility than the market and semiconductor peers.
NVE Corporation (NVEC)
- Beta at 1.20, moderately volatile but less so than AMAT, reflecting smaller size and niche focus.
4. Regulatory & Legal
Applied Materials, Inc. (AMAT)
- Global operations expose AMAT to diverse regulatory regimes, increasing compliance complexity and risk.
NVE Corporation (NVEC)
- Primarily US-based with less regulatory complexity but potential risk in emerging medical device regulations.
5. Supply Chain & Operations
Applied Materials, Inc. (AMAT)
- Large global supply chain vulnerable to geopolitical tensions and semiconductor cycle disruptions.
NVE Corporation (NVEC)
- Smaller, specialized supply chain with less scale but higher dependency on niche suppliers.
6. ESG & Climate Transition
Applied Materials, Inc. (AMAT)
- Faces significant ESG scrutiny due to scale and global footprint; must invest heavily in sustainable operations.
NVE Corporation (NVEC)
- Lower ESG risks due to smaller scale but limited resources for climate transition initiatives.
7. Geopolitical Exposure
Applied Materials, Inc. (AMAT)
- Significant exposure to Asia-Pacific markets, especially China, heightening geopolitical risks.
NVE Corporation (NVEC)
- Mostly US-focused with limited direct geopolitical exposure but reliant on global industrial IoT demand.
Which company shows a better risk-adjusted profile?
AMAT’s biggest risk lies in volatile global markets and complex geopolitical exposure, while NVEC faces risks from limited scale and niche market dependency. NVEC’s low leverage and lower volatility offer a more conservative risk profile. However, AMAT’s diversified revenue base and strong financial health provide resilience. Recent data showing AMAT’s beta at 1.67 versus NVEC’s 1.20 confirms higher market risk for AMAT. NVEC’s extremely high current ratio flags potential inefficiency despite low financial risk. Overall, NVEC shows a better risk-adjusted profile due to conservative capital structure and lower volatility.
Final Verdict: Which stock to choose?
Applied Materials’ superpower lies in its unmatched capital efficiency and robust cash generation, which fuel consistent value creation. A point of vigilance is its declining ROIC trend, signaling potential pressure on future profitability. It suits aggressive growth portfolios that can tolerate cyclicality in the semiconductor equipment sector.
NVE Corporation commands a durable moat thanks to its growing ROIC and a pristine balance sheet with minimal debt. Its strategic edge stems from high-margin niche technology and operational discipline. Relative to Applied Materials, NVEC offers better stability, fitting well into GARP portfolios seeking steady growth with defensive characteristics.
If you prioritize aggressive capital deployment and market leadership in semiconductor equipment, Applied Materials is the compelling choice due to its strong cash flows and scale. However, if you seek a company with a durable competitive advantage and superior balance sheet safety, NVE Corporation offers better stability and an improving profitability trajectory.
Disclaimer: Investment carries a risk of loss of initial capital. The past performance is not a reliable indicator of future results. Be sure to understand risks before making an investment decision.
Go Further
I encourage you to read the complete analyses of Applied Materials, Inc. and NVE Corporation to enhance your investment decisions: