In the fast-evolving semiconductor industry, Applied Materials, Inc. (AMAT) and Nova Ltd. (NVMI) stand out as key players driving innovation and technology advancement. Both companies operate in overlapping markets, focusing on cutting-edge equipment and process control systems essential for chip manufacturing. Their strategies for growth and innovation make them compelling subjects for comparison. This article will help you uncover which company presents the most attractive investment opportunity in 2026.
Table of contents
Companies Overview
I will begin the comparison between Applied Materials, Inc. and Nova Ltd. by providing an overview of these two companies and their main differences.
Applied Materials, Inc. Overview
Applied Materials, Inc. provides manufacturing equipment, services, and software to the semiconductor, display, and related industries. It operates globally through segments including Semiconductor Systems and Display Markets. The company focuses on developing advanced technologies for semiconductor fabrication and display manufacturing. Headquartered in Santa Clara, California, AMAT has a market capitalization of 214B and employs 36,000 people.
Nova Ltd. Overview
Nova Ltd. designs and produces process control systems for semiconductor manufacturing, offering metrology platforms for various process steps such as lithography and etch. Based in Rehovot, Israel, Nova serves integrated circuit manufacturers worldwide, including logic and memory sectors. With a market cap of 10.2B and 1,177 employees, the company concentrates on precision measurement technologies essential for semiconductor production.
Key similarities and differences
Both AMAT and Nova operate in the semiconductor industry, providing critical equipment and solutions for chip manufacturing. While AMAT offers a broader range of manufacturing equipment and related services across multiple segments, Nova specializes in metrology and process control systems. AMAT is significantly larger in market cap and workforce, reflecting its diversified product portfolio and global footprint, compared to Nova’s focused niche in process measurement technologies.
Income Statement Comparison
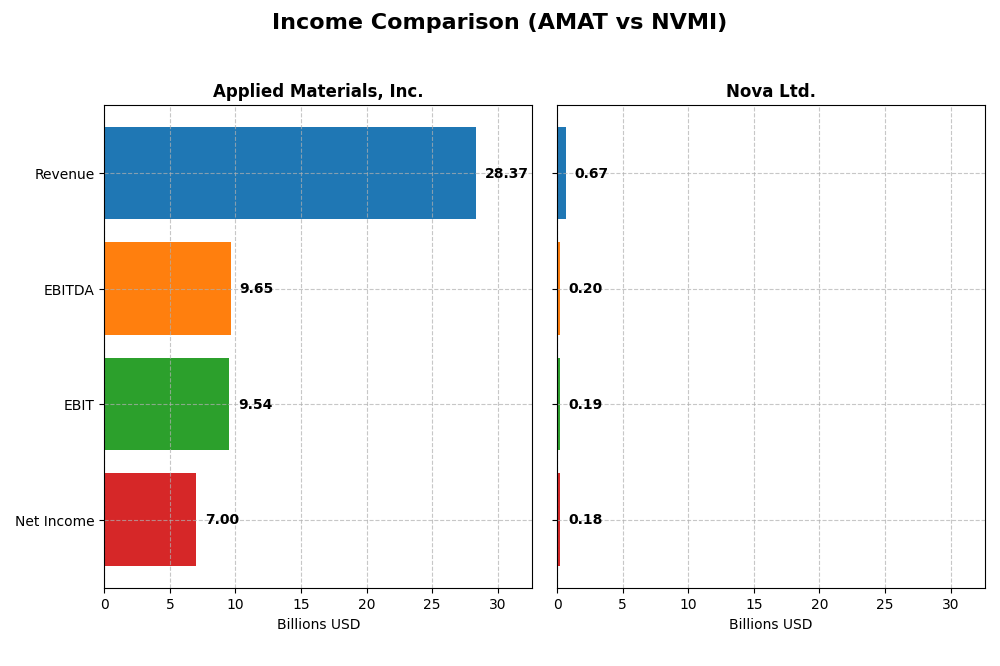
The table below compares key income statement metrics for Applied Materials, Inc. (AMAT) and Nova Ltd. (NVMI) based on their most recent fiscal year results.
| Metric | Applied Materials, Inc. (AMAT) | Nova Ltd. (NVMI) |
|---|---|---|
| Market Cap | 214.2B | 10.2B |
| Revenue | 28.37B | 672.4M |
| EBITDA | 9.65B | 204.9M |
| EBIT | 9.54B | 187.5M |
| Net Income | 7.00B | 184.9M |
| EPS | 8.71 | 6.31 |
| Fiscal Year | 2025 | 2024 |
Income Statement Interpretations
Applied Materials, Inc.
Applied Materials exhibited steady revenue growth from 2021 to 2025, reaching $28.4B in 2025. Net income increased by nearly 19% over this period, though net margin slightly declined. The latest year showed a moderate revenue growth of 4.4%, with a strong 13.6% rise in EBIT, but a small net margin contraction, reflecting higher operating expenses relative to revenue.
Nova Ltd.
Nova Ltd. demonstrated robust revenue growth of nearly 150% from 2020 to 2024, reaching $672M, with net income surging over 280%. Margins improved substantially, including net margin growth of over 50%. In 2024, revenue jumped almost 30%, supported by a 20% EBIT increase and a 34% EPS rise, indicating significant operational leverage and expanding profitability.
Which one has the stronger fundamentals?
Nova Ltd. shows stronger fundamentals in terms of rapid growth, margin expansion, and consistent profitability improvements, with over 90% of income statement metrics rated favorable. Applied Materials delivers stable growth with solid margins but faces slight margin pressure. Both companies have favorable evaluations, yet Nova’s accelerated growth and margin gains stand out more markedly.
Financial Ratios Comparison
The table below presents a side-by-side comparison of key financial ratios for Applied Materials, Inc. (AMAT) and Nova Ltd. (NVMI) based on their most recent fiscal year data.
| Ratios | Applied Materials, Inc. (AMAT) | Nova Ltd. (NVMI) |
|---|---|---|
| ROE | 34.3% | 19.8% |
| ROIC | 21.96% | 13.39% |
| P/E | 26.58 | 31.20 |
| P/B | 9.11 | 6.18 |
| Current Ratio | 2.61 | 2.32 |
| Quick Ratio | 1.87 | 1.92 |
| D/E (Debt-to-Equity) | 0.35 | 0.25 |
| Debt-to-Assets | 19.4% | 17.0% |
| Interest Coverage | 30.8 | 116.2 |
| Asset Turnover | 0.78 | 0.48 |
| Fixed Asset Turnover | 5.54 | 5.06 |
| Payout Ratio | 19.8% | 0% |
| Dividend Yield | 0.74% | 0% |
Interpretation of the Ratios
Applied Materials, Inc.
Applied Materials shows strong profitability with favorable net margin (24.67%), ROE (34.28%), and ROIC (21.96%). The liquidity position is solid, supported by a current ratio of 2.61 and low debt ratios. Concerns arise from relatively high valuation multiples (PE 26.58, PB 9.11) and a low dividend yield of 0.74%. The company pays dividends with a moderate yield but faces some valuation risks.
Nova Ltd.
Nova Ltd. exhibits favorable profitability ratios, including a net margin of 27.33% and ROE at 19.81%, though lower than Applied Materials. Liquidity and leverage metrics are sound with a current ratio of 2.32 and debt-to-assets at 16.98%. It does not pay dividends, likely prioritizing reinvestment and growth. Its valuation is elevated with a PE of 31.2 and no dividend yield, reflecting growth expectations.
Which one has the best ratios?
Both companies present favorable overall ratios with 64.29% rated positively, but Applied Materials shows stronger returns on equity and invested capital with better liquidity and debt management. Nova’s asset turnover is weaker, and it carries higher valuation multiples without shareholder returns via dividends. The choice depends on weighing profitability against growth and payout preferences.
Strategic Positioning
This section compares the strategic positioning of Applied Materials, Inc. and Nova Ltd. regarding market position, key segments, and exposure to technological disruption:
Applied Materials, Inc.
- Leading semiconductor equipment provider with strong global presence and competitive pressure in semiconductors.
- Diverse revenue streams from Semiconductor Systems, Applied Global Services, and Display segments.
- Exposure to technological disruption through advanced manufacturing equipment and software innovation.
Nova Ltd.
- Smaller semiconductor process control company facing competitive pressures in niche metrology markets.
- Concentrated product portfolio focused on metrology platforms for semiconductor process control.
- Exposure primarily via metrology technologies for process control in semiconductor fabrication.
Applied Materials, Inc. vs Nova Ltd. Positioning
Applied Materials has a diversified portfolio across equipment, services, and display markets, providing multiple revenue drivers but facing broad competitive pressures. Nova has a more concentrated focus on process control metrology, enabling specialization but with narrower market coverage.
Which has the best competitive advantage?
Applied Materials demonstrates a slightly favorable moat by creating value despite declining profitability, while Nova shows growing profitability but is currently shedding value, indicating Applied Materials holds a stronger competitive advantage based on MOAT evaluation.
Stock Comparison
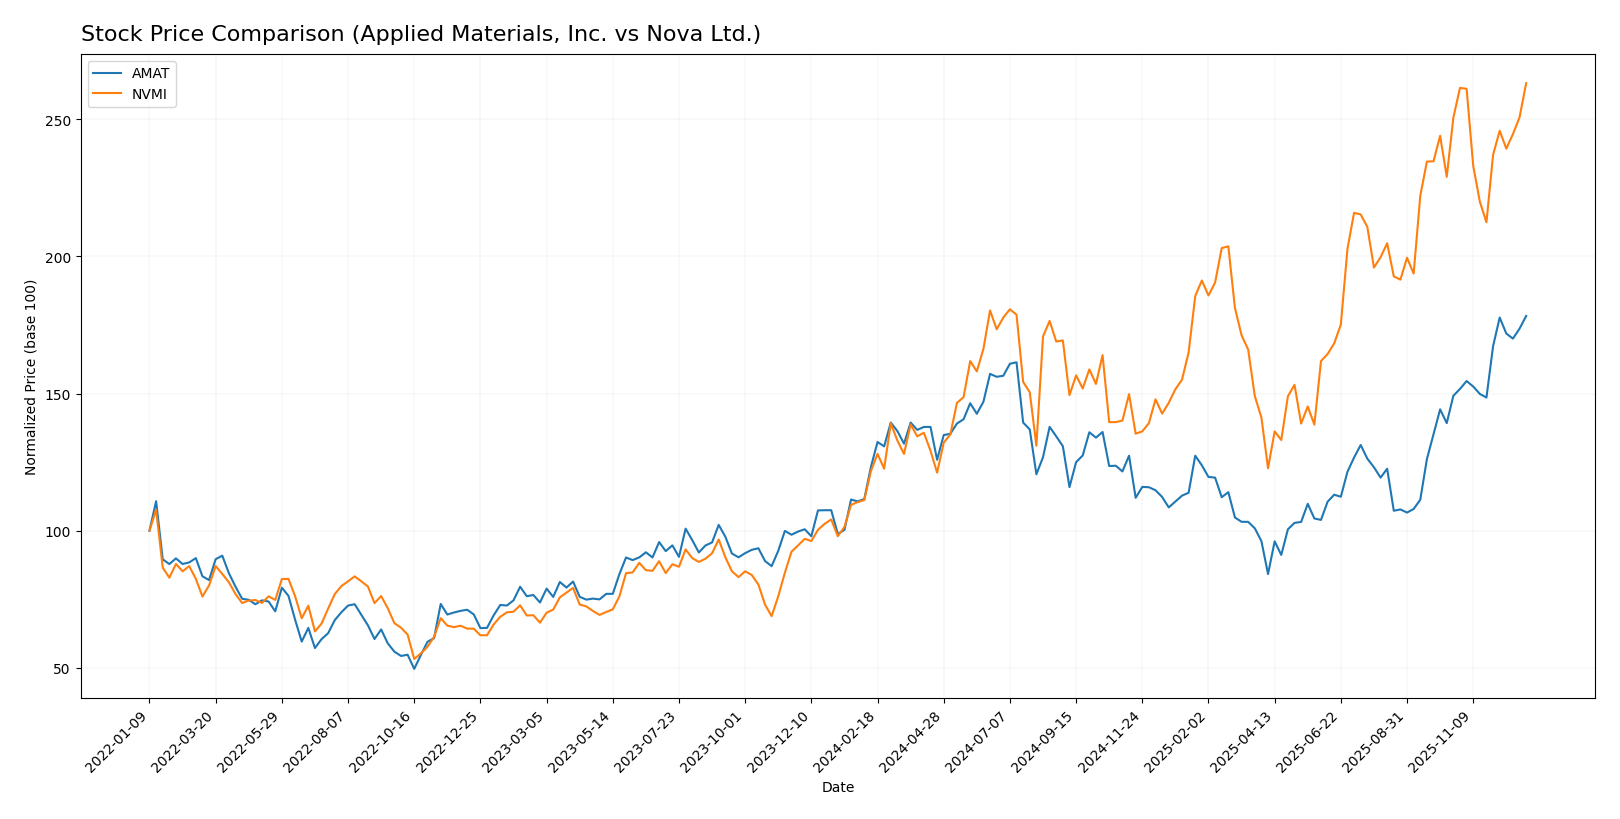
The stock price chart illustrates significant bullish trends for both Applied Materials, Inc. and Nova Ltd. over the past 12 months, with notable price appreciations and evolving trading volumes shaping their market dynamics.
Trend Analysis
Applied Materials, Inc. experienced a strong bullish trend over the past year, with a 44.68% price increase, showing acceleration and a high volatility level marked by a 30.28 standard deviation.
Nova Ltd. posted a more pronounced bullish trend with a 116.2% rise during the same period, though the acceleration decelerated, and volatility was higher at a 50.36 standard deviation.
Comparing both, Nova Ltd. delivered the highest market performance with a 116.2% gain, significantly outperforming Applied Materials, Inc.’s 44.68% increase over the past 12 months.
Target Prices
Analyst consensus target prices for Applied Materials, Inc. and Nova Ltd. suggest moderate upside potential from current market levels.
| Company | Target High | Target Low | Consensus |
|---|---|---|---|
| Applied Materials, Inc. | 360 | 205 | 278.17 |
| Nova Ltd. | 390 | 335 | 362.5 |
The consensus targets indicate that Applied Materials’ stock, currently at $268.87, could appreciate modestly toward the $278 average target. Nova Ltd., trading at $347.34, shows a higher expected upside with a consensus near $362.5.
Analyst Opinions Comparison
This section compares the analysts’ ratings and financial scores for Applied Materials, Inc. and Nova Ltd.:
Rating Comparison
AMAT Rating
- Rating: B+, classified as Very Favorable by analysts.
- Discounted Cash Flow Score: 3, indicating a moderate valuation based on future cash flows.
- ROE Score: 5, showing very favorable efficiency in generating profit from shareholders’ equity.
- ROA Score: 5, reflecting very favorable use of assets to produce earnings.
- Debt To Equity Score: 2, representing moderate financial risk with some reliance on debt.
- Overall Score: 3, denoting a moderate overall financial standing.
NVMI Rating
- Rating: B-, classified as Very Favorable by analysts.
- Discounted Cash Flow Score: 3, indicating a moderate valuation based on future cash flows.
- ROE Score: 4, showing favorable but lower efficiency than AMAT in profit generation.
- ROA Score: 5, reflecting very favorable use of assets to produce earnings.
- Debt To Equity Score: 1, indicating very unfavorable financial risk with high debt relative to equity.
- Overall Score: 3, denoting a moderate overall financial standing.
Which one is the best rated?
Applied Materials holds a higher rating of B+ compared to Nova’s B-, and scores better on Return on Equity and Debt to Equity, indicating stronger profitability and moderate financial risk. Both share the same overall and discounted cash flow scores.
Scores Comparison
Here is a comparison of the financial scores for Applied Materials, Inc. and Nova Ltd.:
AMAT Scores
- Altman Z-Score: 12.03, indicating a safe zone with very low bankruptcy risk.
- Piotroski Score: 7, reflecting strong financial health and investment potential.
NVMI Scores
- Altman Z-Score: 6.54, indicating a safe zone with low bankruptcy risk.
- Piotroski Score: 7, reflecting strong financial health and investment potential.
Which company has the best scores?
Both AMAT and NVMI are in the safe zone for Altman Z-Score and share the same strong Piotroski Score of 7. AMAT has a higher Altman Z-Score, suggesting a comparatively lower bankruptcy risk.
Grades Comparison
The grades assigned to Applied Materials, Inc. and Nova Ltd. by various reputable grading companies are as follows:
Applied Materials, Inc. Grades
The table below summarizes recent grades from recognized grading companies for Applied Materials, Inc.:
| Grading Company | Action | New Grade | Date |
|---|---|---|---|
| B. Riley Securities | Maintain | Buy | 2025-12-18 |
| Mizuho | Maintain | Neutral | 2025-12-17 |
| Jefferies | Maintain | Buy | 2025-12-15 |
| Wells Fargo | Maintain | Overweight | 2025-12-15 |
| Keybanc | Maintain | Overweight | 2025-12-02 |
| UBS | Upgrade | Buy | 2025-11-25 |
| Wells Fargo | Maintain | Overweight | 2025-11-14 |
| Morgan Stanley | Maintain | Overweight | 2025-11-14 |
| B. Riley Securities | Maintain | Buy | 2025-11-14 |
| Cantor Fitzgerald | Maintain | Overweight | 2025-11-14 |
Overall, the grades for Applied Materials, Inc. predominantly indicate a positive outlook, with several Buy and Overweight ratings maintained or upgraded.
Nova Ltd. Grades
The table below presents recent grades from recognized grading companies for Nova Ltd.:
| Grading Company | Action | New Grade | Date |
|---|---|---|---|
| Jefferies | Maintain | Buy | 2025-12-15 |
| Evercore ISI Group | Maintain | Outperform | 2025-11-07 |
| Benchmark | Maintain | Buy | 2025-11-07 |
| B of A Securities | Maintain | Buy | 2025-06-24 |
| Cantor Fitzgerald | Maintain | Overweight | 2025-06-24 |
| Benchmark | Maintain | Buy | 2025-05-09 |
| Citigroup | Maintain | Buy | 2025-05-09 |
| B of A Securities | Maintain | Buy | 2025-04-16 |
| Cantor Fitzgerald | Maintain | Overweight | 2025-03-14 |
| Benchmark | Maintain | Buy | 2025-02-14 |
Nova Ltd. consistently received strong Buy and Outperform ratings, reflecting sustained confidence from analysts.
Which company has the best grades?
Both companies have earned favorable grades from reputable firms, but Nova Ltd. shows a more consistent pattern of Buy and Outperform ratings compared to Applied Materials, Inc., which has a mix of Buy, Overweight, and Neutral grades. This consistency may suggest stronger analyst confidence, potentially influencing investor sentiment.
Strengths and Weaknesses
Below is a comparison of Applied Materials, Inc. (AMAT) and Nova Ltd. (NVMI) across key investment criteria based on the most recent financial and operational data.
| Criterion | Applied Materials, Inc. (AMAT) | Nova Ltd. (NVMI) |
|---|---|---|
| Diversification | Highly diversified with three main segments: Semiconductor Systems (19.9B in 2024), Applied Global Services (6.2B), and Display & Adjacent Markets (885M). | Limited diversification, primarily a single product line generating 538M in 2024. |
| Profitability | Strong profitability: Net Margin 24.7%, ROE 34.3%, ROIC 22.0%, all favorable. | Solid profitability with Net Margin 27.3%, ROE 19.8%, ROIC 13.4%, favorable but lower than AMAT. |
| Innovation | Significant investment in advanced semiconductor technologies sustaining competitive edge, though ROIC trend is declining (-28%). | Improving innovation as indicated by a strong ROIC growth trend (+70%), but currently shedding value (ROIC just above WACC). |
| Global presence | Extensive global operations supporting large-scale semiconductor manufacturing markets. | Smaller global footprint relative to AMAT, more niche positioning. |
| Market Share | Large market share in semiconductor equipment with steady revenue growth to 29.7B in 2024. | Smaller market share with revenues of 538M, but showing growth momentum. |
Key takeaways: AMAT demonstrates strong diversification and high profitability, making it a stable investment, though its profitability trend is declining. NVMI is less diversified and currently less profitable, but its improving ROIC trend suggests growing potential. Investors should weigh AMAT’s established position against NVMI’s growth prospects.
Risk Analysis
Below is a summary table of key risks for Applied Materials, Inc. (AMAT) and Nova Ltd. (NVMI) based on the most recent data:
| Metric | Applied Materials, Inc. (AMAT) | Nova Ltd. (NVMI) |
|---|---|---|
| Market Risk | High beta (1.666), tech sector cyclicality | Higher beta (1.839), sensitive to semiconductor demand |
| Debt level | Moderate debt-to-equity (0.35), good interest coverage (35.46) | Low debt-to-equity (0.25), excellent interest coverage (116.2) |
| Regulatory Risk | Exposure to US-China trade tensions and export controls | Geopolitical risks due to Israel base and global supply chains |
| Operational Risk | Large global operations with complex supply chain | Smaller scale, but reliant on specialized tech manufacturing |
| Environmental Risk | Industry-wide pressure to reduce carbon footprint | Same sector pressures, plus local regulatory compliance |
| Geopolitical Risk | US-China tensions impact sales and supply chain | Middle East geopolitical instability and global trade dependencies |
The most likely and impactful risks for both companies arise from market volatility in the semiconductor sector and geopolitical tensions. AMAT faces significant exposure to US-China relations affecting manufacturing and sales. NVMI’s geopolitical risk is pronounced due to its Israel base amid regional instability. Both maintain healthy debt levels, mitigating financial distress risk. Operational and environmental risks remain industry standard but should be monitored given evolving regulations.
Which Stock to Choose?
Applied Materials, Inc. (AMAT) shows a generally favorable income evolution with a 23% revenue growth over 2021-2025 and solid profitability despite a slight net margin decline. Financial ratios are mostly favorable, including a strong ROE of 34.3% and a low debt-to-equity ratio of 0.35. Its debt level is manageable, and the company holds a very favorable B+ rating, supported by a safe zone Altman Z-Score.
Nova Ltd. (NVMI) exhibits strong income growth, with revenue surging 150% over 2020-2024 and improving net margin by 53.7%. Financial ratios are favorable overall, though some valuations such as P/E and P/B are unfavorable. Debt is higher relative to equity, and the company holds a B- rating. NVMI demonstrates a safe zone Altman Z-Score but shows signs of shedding value despite growing ROIC.
Considering ratings, income statements, and financial ratios, AMAT might appear more suitable for investors prioritizing stable profitability and strong capital efficiency, while NVMI could be interpreted as appealing to those with a growth-oriented profile accepting higher valuation and leverage risks. The choice could depend on whether an investor favors quality and stability or aggressive growth potential.
Disclaimer: Investment carries a risk of loss of initial capital. The past performance is not a reliable indicator of future results. Be sure to understand risks before making an investment decision.
Go Further
I encourage you to read the complete analyses of Applied Materials, Inc. and Nova Ltd. to enhance your investment decisions: