Home > Comparison > Technology > AMAT vs MPWR
The strategic rivalry between Applied Materials, Inc. and Monolithic Power Systems, Inc. defines the semiconductor sector’s innovation and growth trajectory. Applied Materials operates as a capital-intensive manufacturing equipment leader, while Monolithic Power Systems excels as a high-margin semiconductor power solutions provider. This analysis pits industrial scale against specialized agility, assessing which business model offers superior risk-adjusted returns for diversified portfolios in a rapidly evolving technology landscape.
Table of contents
Companies Overview
Applied Materials and Monolithic Power Systems are pivotal players driving innovation in semiconductors.
Applied Materials, Inc.: Semiconductor Manufacturing Equipment Leader
Applied Materials dominates the semiconductor equipment market by providing manufacturing equipment and software essential for chip fabrication. Its revenue relies heavily on advanced technology segments like Semiconductor Systems, Applied Global Services, and Display markets. In 2026, the company strategically focuses on integrating cutting-edge process technologies and factory automation to optimize chip production efficiency globally.
Monolithic Power Systems, Inc.: Power Electronics Innovator
Monolithic Power Systems excels in designing and marketing power electronics ICs that convert and control voltages across computing, automotive, and industrial sectors. Its revenue engine flows from DC to DC integrated circuits and lighting control ICs. In 2026, the company advances its strategic focus on expanding product applications and global distribution to capture broader market segments.
Strategic Collision: Similarities & Divergences
Both firms lead semiconductor innovation but differ in focus: Applied Materials targets fabrication equipment while Monolithic Power Systems specializes in power management ICs. Their primary battleground is semiconductor technology advancement, but they occupy distinct niches—capital-intensive equipment versus integrated circuit design. This divergence shapes unique investment profiles with varying risk and growth dynamics.
Income Statement Comparison
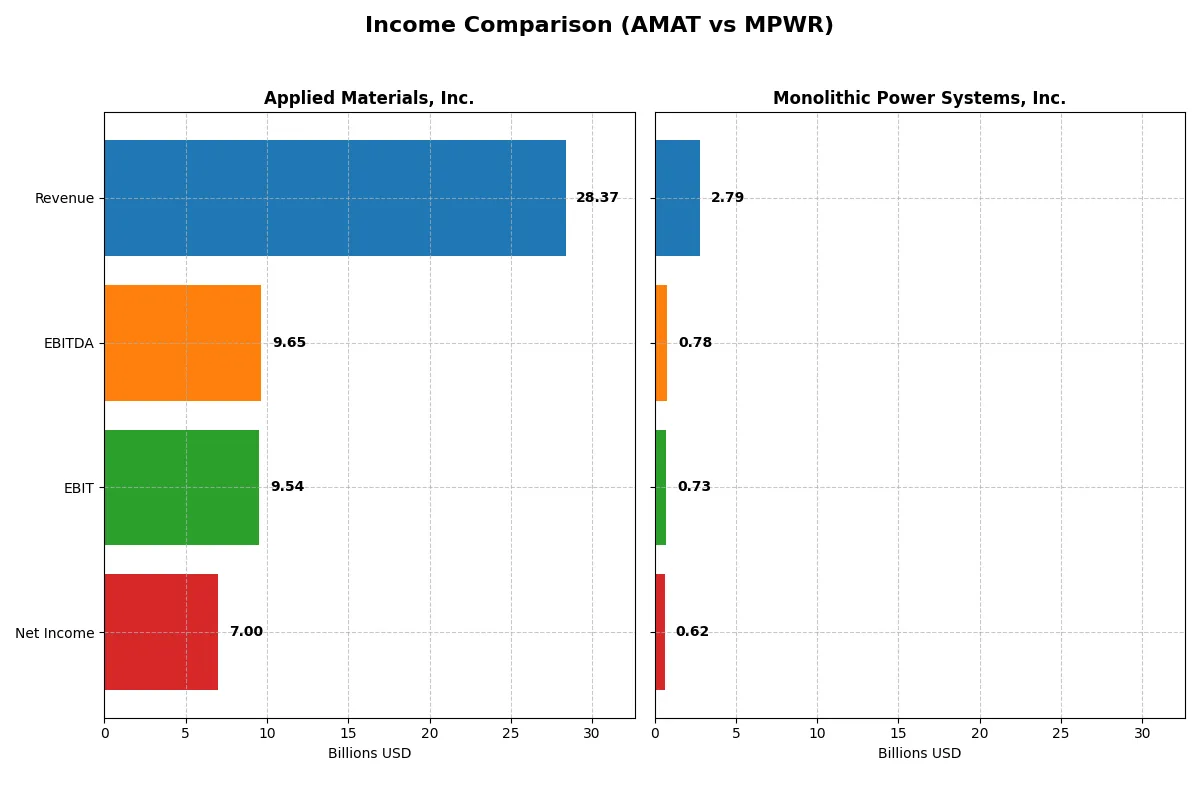
This data dissects the core profitability and scalability of both corporate engines to reveal who dominates the bottom line:
| Metric | Applied Materials, Inc. (AMAT) | Monolithic Power Systems, Inc. (MPWR) |
|---|---|---|
| Revenue | 28.4B | 2.79B |
| Cost of Revenue | 14.6B | 1.25B |
| Operating Expenses | 5.52B | 811M |
| Gross Profit | 13.8B | 1.54B |
| EBITDA | 9.65B | 780M |
| EBIT | 9.54B | 729M |
| Interest Expense | 269M | 0 |
| Net Income | 7.00B | 616M |
| EPS | 8.71 | 12.82 |
| Fiscal Year | 2025 | 2025 |
Income Statement Analysis: The Bottom-Line Duel
This income statement comparison reveals which company operates with superior efficiency and sustainable profitability in a competitive market.
Applied Materials, Inc. Analysis
Applied Materials grew revenue steadily from 23B in 2021 to 28.4B in 2025, with net income rising from 5.9B to 7B. Its gross margin remains robust near 49%, while net margin holds a healthy 24.7%. In 2025, efficiency gains lifted EBIT by 13.6%, though net margin slightly contracted, signaling stable but cautious momentum.
Monolithic Power Systems, Inc. Analysis
Monolithic Power expanded revenue sharply from 1.2B in 2021 to 2.8B in 2025, with net income surging from 242M to 616M. The firm boasts an impressive gross margin above 55%, though net margin slipped to 22.1% in 2025. Despite strong top-line growth and 35% EBIT expansion, net margin and EPS fell sharply last year, reflecting volatility in profitability.
Growth Scale vs. Margin Consistency
Applied Materials delivers steady revenue growth with consistent margins and strong operating efficiency, while Monolithic Power exhibits rapid top-line expansion but volatile net profitability. AMAT’s profile suits investors prioritizing margin stability. MPWR appeals to those seeking high growth but willing to tolerate earnings swings.
Financial Ratios Comparison
These vital ratios act as a diagnostic tool to expose the underlying fiscal health, valuation premiums, and capital efficiency of the companies compared:
| Ratios | Applied Materials, Inc. (AMAT) | Monolithic Power Systems, Inc. (MPWR) |
|---|---|---|
| ROE | 34.28% | 16.55% |
| ROIC | 21.96% | 14.93% |
| P/E | 26.58 | 70.69 |
| P/B | 9.11 | 11.70 |
| Current Ratio | 2.61 | 5.91 |
| Quick Ratio | 1.87 | 4.38 |
| D/E | 0.35 | 0.00 |
| Debt-to-Assets | 19.42% | 0.00% |
| Interest Coverage | 30.81 | N/A |
| Asset Turnover | 0.78 | 0.65 |
| Fixed Asset Turnover | 5.54 | 4.45 |
| Payout ratio | 19.78% | 46.25% |
| Dividend yield | 0.74% | 0.65% |
| Fiscal Year | 2025 | 2025 |
Efficiency & Valuation Duel: The Vital Signs
Financial ratios act as a company’s DNA, uncovering operational strength and hidden risks crucial for investment decisions.
Applied Materials, Inc.
Applied Materials demonstrates robust profitability with a 34.3% ROE and a strong 24.7% net margin, signaling operational excellence. Its valuation appears stretched at a 26.6 P/E and 9.1 P/B ratio. Shareholders receive modest dividends (0.74% yield), reflecting a balanced capital allocation between returns and growth investments.
Monolithic Power Systems, Inc.
Monolithic Power shows moderate profitability with a 16.6% ROE and a 22.1% net margin, though its valuation is highly stretched, carrying a 70.7 P/E and 11.7 P/B ratio. The company offers a low dividend yield (0.65%), favoring reinvestment heavily into R&D, supporting future growth.
Premium Valuation vs. Operational Safety
Applied Materials offers stronger profitability and a more reasonable valuation than Monolithic Power, which trades at a steep premium. AMAT’s balanced dividend and growth profile suit investors prioritizing operational safety. MPWR’s growth-focused model appeals to those tolerating high valuation risk.
Which one offers the Superior Shareholder Reward?
I see that Applied Materials (AMAT) delivers a modest dividend yield near 0.8%, with a conservative payout ratio around 20%. Their steady buybacks amplify total returns sustainably. Monolithic Power Systems (MPWR) offers a lower yield (~0.65%) but a far higher payout ratio near 46%, signaling riskier dividend sustainability. MPWR’s balance sheet shows no debt and robust cash, yet its sky-high P/E (~70x) and thin free cash flow metrics undermine confidence. AMAT’s balanced distribution via dividends and buybacks, supported by solid free cash flow coverage, offers a more reliable reward in 2026. I favor AMAT for a superior total return profile.
Comparative Score Analysis: The Strategic Profile
The radar chart reveals the fundamental DNA and trade-offs of Applied Materials and Monolithic Power Systems, highlighting their financial strengths and valuation differences:
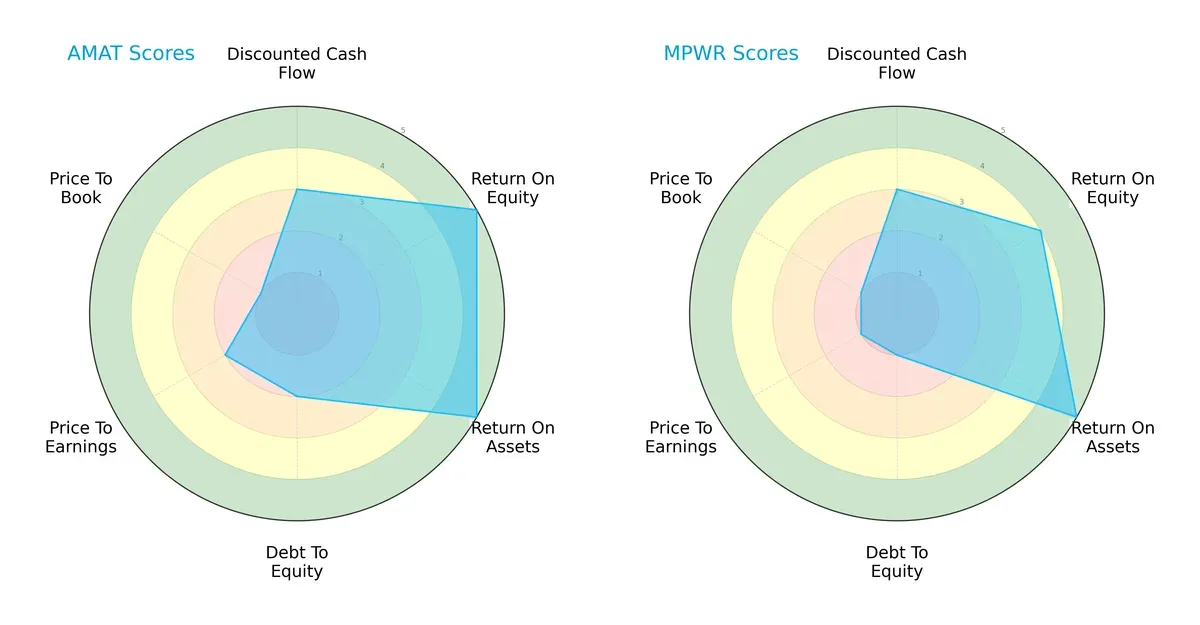
Applied Materials shows superior returns on equity (5 vs. 4) and assets (5 vs. 5), but bears heavier financial risk with a weaker debt-to-equity score (2 vs. 1). Both firms share moderate DCF scores (3) but struggle with valuation metrics, where Monolithic Power fares slightly worse (PE and PB scores of 1). Applied Materials presents a more balanced profile, blending profitability with acceptable risk, while Monolithic Power relies heavily on asset efficiency but carries higher leverage and valuation concerns.
Bankruptcy Risk: Solvency Showdown
The Altman Z-Score gap strongly favors Monolithic Power (63.2 vs. 13.8), indicating both companies are firmly in the safe zone but Monolithic Power exhibits extraordinary solvency and lower bankruptcy risk in this cycle:

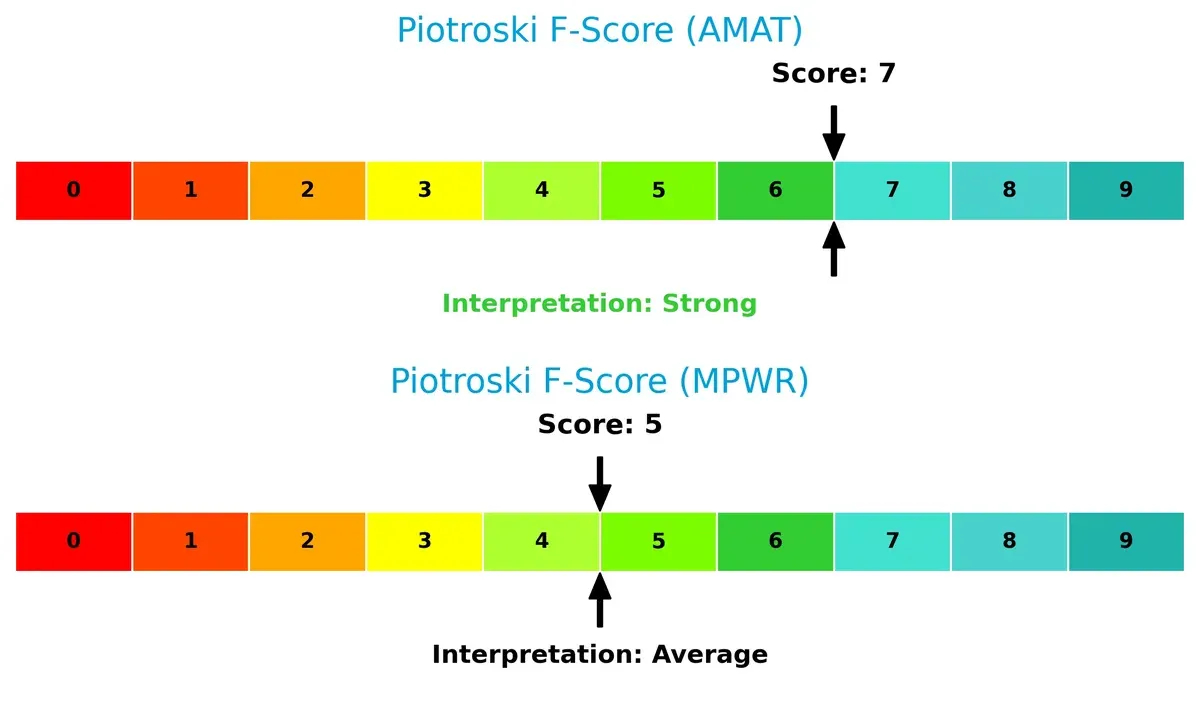
Financial Health: Quality of Operations
Applied Materials’ Piotroski F-Score of 7 signals strong financial health, while Monolithic Power’s 5 suggests moderate stability with some internal metric weaknesses:
How are the two companies positioned?
This section dissects the operational DNA of AMAT and MPWR by comparing their revenue distribution by segment and internal dynamics. The goal is to confront their economic moats to identify which business model offers the most resilient and sustainable competitive advantage today.
Revenue Segmentation: The Strategic Mix
The following visual comparison dissects how Applied Materials, Inc. and Monolithic Power Systems, Inc. diversify their income streams and where their primary sector bets lie:

Applied Materials anchors its revenue in Semiconductor Systems with $19.9B, supplemented by $6.2B from Applied Global Services and $885M from Display and Adjacent Markets. This mix shows robust diversification with a strong infrastructure foothold. Monolithic Power Systems, however, relies heavily on DC To DC Products, generating $1.7B versus just $102M from Lighting Control Products, revealing concentration risk but a clear focus on power management solutions.
Strengths and Weaknesses Comparison
This table compares the strengths and weaknesses of Applied Materials, Inc. and Monolithic Power Systems, Inc.:
Applied Materials Strengths
- High net margin at 24.67%
- Strong ROE of 34.28%
- Favorable ROIC at 21.96%
- Solid current and quick ratios
- Diversified revenue across three segments
- Large global presence, especially in China and Korea
Monolithic Power Systems Strengths
- Favorable net margin at 22.07%
- Positive ROE of 16.55%
- Zero debt and infinite interest coverage
- Strong quick ratio at 4.38
- Focused product portfolio with growing revenues
- Presence in China and Taiwan markets
Applied Materials Weaknesses
- Unfavorable WACC at 11.37% vs. ROIC
- High P/E at 26.58 and P/B at 9.11
- Lower dividend yield at 0.74%
- Moderate asset turnover (0.78)
- Heavy reliance on semiconductor systems segment
- Exposure to unfavorable regions like Europe with lower revenue
Monolithic Power Systems Weaknesses
- Unfavorable WACC at 10.63% vs. ROIC
- Very high P/E at 70.69 and P/B at 11.7
- Unfavorable current ratio at 5.91
- Narrow product diversification
- Lower ROE and ROIC compared to AMAT
- Smaller global revenue footprint
Overall, Applied Materials benefits from diversified revenue streams and strong profitability metrics but faces valuation and capital efficiency challenges. Monolithic Power Systems shows financial strength with zero debt and solid margins but is limited by narrow product focus and higher valuation multiples. Both companies’ strategies reflect trade-offs between diversification and financial leverage.
The Moat Duel: Analyzing Competitive Defensibility
A structural moat is the only true shield guarding long-term profits from relentless competition erosion. Let’s dissect the nature of these moats:
Applied Materials, Inc.: Capital-Intensive Scale and Technology Leadership
Applied Materials leverages a cost advantage moat, rooted in massive scale and proprietary semiconductor equipment technology. Its 10.6% ROIC premium over WACC confirms value creation despite a recent ROIC decline. Expansion into advanced chip manufacturing deepens this moat in 2026.
Monolithic Power Systems, Inc.: Innovation-Driven Niche Dominance
Monolithic Power’s moat stems from intangible assets and specialized power management ICs, differentiating it from Applied’s scale focus. Its 4.3% ROIC premium over WACC signals value creation with a smaller but growing footprint. Strong 2025 revenue growth suggests potential for niche market disruption in 2026.
Scale Moat vs. Innovation Moat: Who Defends Better?
Applied Materials commands a wider moat through capital intensity and technology scale, while Monolithic Power builds a narrower moat via innovation agility. Applied is better equipped to defend market share amid intensifying competition in 2026.
Which stock offers better returns?
Over the past 12 months, Applied Materials, Inc. and Monolithic Power Systems, Inc. both showed strong price appreciation with accelerating bullish trends and rising trading volumes.

Trend Comparison
Applied Materials, Inc. gained 62.35% over the last year with price acceleration and a high volatility of 40.87, reaching a peak of 327.01 and a low of 126.95.
Monolithic Power Systems, Inc. outperformed with a 79.02% rise over the same period, showing stronger acceleration and higher volatility at 150.74, with prices ranging from 477.39 to 1229.82.
Monolithic Power Systems delivered the highest market performance, outperforming Applied Materials by more than 16 percentage points over the past twelve months.
Target Prices
Analysts present a bullish consensus on Applied Materials and Monolithic Power Systems with robust upside potential.
| Company | Target Low | Target High | Consensus |
|---|---|---|---|
| Applied Materials, Inc. | 290 | 405 | 360.56 |
| Monolithic Power Systems, Inc. | 1200 | 1500 | 1313.71 |
The consensus targets for AMAT and MPWR exceed their current prices by 12% and 7%, respectively, signaling moderate to strong growth expectations.

Don’t Let Luck Decide Your Entry Point
Optimize your entry points with our advanced ProRealTime indicators. You’ll get efficient buy signals with precise price targets for maximum performance. Start outperforming now!
How do institutions grade them?
This section compares the latest institutional grades assigned to Applied Materials, Inc. and Monolithic Power Systems, Inc.:
Applied Materials, Inc. Grades
The table below summarizes recent grades from major financial institutions for Applied Materials, Inc.
| Grading Company | Action | New Grade | Date |
|---|---|---|---|
| Citigroup | maintain | Buy | 2026-02-04 |
| Morgan Stanley | maintain | Overweight | 2026-02-02 |
| Mizuho | upgrade | Outperform | 2026-01-28 |
| Deutsche Bank | upgrade | Buy | 2026-01-23 |
| Needham | maintain | Buy | 2026-01-20 |
| Keybanc | maintain | Overweight | 2026-01-16 |
| Wells Fargo | maintain | Overweight | 2026-01-15 |
| Barclays | upgrade | Overweight | 2026-01-15 |
| Stifel | maintain | Buy | 2026-01-14 |
| B of A Securities | maintain | Buy | 2026-01-13 |
Monolithic Power Systems, Inc. Grades
The table below summarizes recent grades from major financial institutions for Monolithic Power Systems, Inc.
| Grading Company | Action | New Grade | Date |
|---|---|---|---|
| Truist Securities | maintain | Buy | 2026-02-06 |
| Keybanc | maintain | Overweight | 2026-02-06 |
| Rosenblatt | maintain | Neutral | 2026-02-06 |
| Wells Fargo | maintain | Overweight | 2026-02-06 |
| Needham | maintain | Buy | 2026-02-06 |
| Stifel | maintain | Buy | 2026-02-04 |
| Wells Fargo | maintain | Overweight | 2026-01-26 |
| Wells Fargo | upgrade | Overweight | 2026-01-15 |
| Truist Securities | maintain | Buy | 2025-12-19 |
| Citigroup | maintain | Buy | 2025-11-03 |
Which company has the best grades?
Applied Materials, Inc. holds a slight edge with multiple upgrades to Buy and Outperform ratings. Monolithic Power Systems, Inc. maintains steady Buy and Overweight grades but fewer upgrades. Investors may view AMAT’s upgrades as a sign of growing institutional confidence.
Risks specific to each company
The following categories identify the critical pressure points and systemic threats facing both firms in the 2026 market environment:
1. Market & Competition
Applied Materials, Inc.
- Faces intense global semiconductor equipment competition; strong market cap supports R&D and innovation.
Monolithic Power Systems, Inc.
- Competes in niche power electronics with fewer players but must sustain innovation to keep edge.
2. Capital Structure & Debt
Applied Materials, Inc.
- Maintains moderate debt with a D/E of 0.35, interest coverage very strong at 35.46x.
Monolithic Power Systems, Inc.
- Debt-free balance sheet, zero leverage, and infinite interest coverage reduce financial risk.
3. Stock Volatility
Applied Materials, Inc.
- Beta at 1.68 indicates higher volatility than the market, reflecting semiconductor cyclicality.
Monolithic Power Systems, Inc.
- Slightly lower beta of 1.46 signals somewhat less volatility, yet still sensitive to tech sector swings.
4. Regulatory & Legal
Applied Materials, Inc.
- Global operations expose it to complex trade regulations, especially US-China tensions.
Monolithic Power Systems, Inc.
- Also exposed to international regulatory shifts, with emphasis on automotive and industrial sectors.
5. Supply Chain & Operations
Applied Materials, Inc.
- Large scale and diverse supply chain; geopolitical risks could disrupt semiconductor equipment supply.
Monolithic Power Systems, Inc.
- Smaller scale but dependent on global suppliers; supply chain shocks can impact production agility.
6. ESG & Climate Transition
Applied Materials, Inc.
- Invests in sustainable manufacturing processes; faces pressure to reduce carbon footprint in energy-intensive production.
Monolithic Power Systems, Inc.
- Focused on energy-efficient power ICs; ESG initiatives key to maintaining customer trust and compliance.
7. Geopolitical Exposure
Applied Materials, Inc.
- Significant exposure to Asia-Pacific, including China and Taiwan, heightening geopolitical risk.
Monolithic Power Systems, Inc.
- Also exposed to Asia but with less scale; US-China tensions still a notable threat.
Which company shows a better risk-adjusted profile?
Applied Materials’ main risk is geopolitical exposure amid global semiconductor tensions. Monolithic Power’s biggest threat is valuation risk, with high P/E and P/B ratios amplifying market corrections. Despite higher volatility, Applied Materials benefits from a stronger capital structure and diversified operations, giving it a better risk-adjusted profile in 2026.
Final Verdict: Which stock to choose?
Applied Materials, Inc. (AMAT) stands out for its unmatched capital efficiency and robust value creation. Its ability to generate high returns on invested capital consistently signals a durable competitive edge. A point of vigilance is its slightly declining profitability trend, which warrants close monitoring. AMAT suits investors with an appetite for steady, quality growth in a diversified portfolio.
Monolithic Power Systems, Inc. (MPWR) boasts a strategic moat rooted in innovative power management technology and recurring revenue streams. It offers superior balance sheet strength with zero debt and an exceptionally high current ratio, presenting a safer financial profile relative to AMAT. MPWR fits well in a Growth at a Reasonable Price (GARP) strategy, appealing to those seeking growth with a margin of safety.
If you prioritize consistent value creation and operational excellence, AMAT is the compelling choice due to its strong return metrics and industry positioning. However, if you seek higher growth potential with a conservative balance sheet, MPWR offers better stability and innovative edge, albeit at a premium valuation. Both companies show slightly declining profitability trends, so discipline in risk management remains essential.
Disclaimer: Investment carries a risk of loss of initial capital. The past performance is not a reliable indicator of future results. Be sure to understand risks before making an investment decision.
Go Further
I encourage you to read the complete analyses of Applied Materials, Inc. and Monolithic Power Systems, Inc. to enhance your investment decisions: