In the fast-evolving semiconductor industry, Micron Technology, Inc. (MU) and Applied Materials, Inc. (AMAT) stand out as key players driving innovation and market growth. While Micron specializes in memory and storage solutions, Applied Materials focuses on manufacturing equipment critical to chip production. This comparison sheds light on their overlapping roles in technology advancement. Join me as we explore which company presents the most compelling investment opportunity today.

Table of contents
Companies Overview
I will begin the comparison between Micron Technology, Inc. and Applied Materials, Inc. by providing an overview of these two companies and their main differences.
Micron Technology, Inc. Overview
Micron Technology, Inc. designs, manufactures, and sells memory and storage products worldwide, operating through four business units focused on compute, mobile, storage, and embedded markets. It offers DRAM, NAND, and NOR memory products under the Micron and Crucial brands. The company serves cloud servers, enterprise, client, graphics, networking, mobile devices, automotive, industrial, and consumer sectors.
Applied Materials, Inc. Overview
Applied Materials, Inc. provides manufacturing equipment, services, and software primarily to the semiconductor, display, and related industries. It operates three segments: Semiconductor Systems, Applied Global Services, and Display and Adjacent Markets, offering technologies for chip fabrication and display production. The company has a global presence, including the US, Asia, and Europe, focusing on equipment and integrated solutions to optimize manufacturing processes.
Key similarities and differences
Both companies operate in the semiconductor sector but focus on distinct areas: Micron on memory and storage products, Applied Materials on manufacturing equipment and services. While Micron emphasizes product sales across various memory technologies, Applied Materials specializes in equipment and solutions for semiconductor fabrication and display markets. They differ in operational scope and product offerings but share exposure to global technology markets.
Income Statement Comparison
This table presents a side-by-side comparison of key income statement metrics for Micron Technology, Inc. and Applied Materials, Inc. for their most recent fiscal year.

| Metric | Micron Technology, Inc. | Applied Materials, Inc. |
|---|---|---|
| Market Cap | 373B | 240B |
| Revenue | 37.4B | 28.4B |
| EBITDA | 18.5B | 9.7B |
| EBIT | 10.1B | 9.5B |
| Net Income | 8.54B | 7.00B |
| EPS | 7.65 | 8.71 |
| Fiscal Year | 2025 | 2025 |
Income Statement Interpretations
Micron Technology, Inc.
Micron Technology’s revenue grew significantly from $15.5B in 2023 to $37.4B in 2025, with net income recovering from a $5.8B loss in 2023 to $8.5B in 2025. Margins improved notably, with a gross margin near 40% and net margin at 22.8% in 2025. The latest year showed strong margin expansion and exceptional earnings growth, reflecting a robust turnaround.
Applied Materials, Inc.
Applied Materials’ revenue increased steadily from $23.1B in 2021 to $28.4B in 2025, with net income rising to $7.0B in 2025. Gross and EBIT margins were healthy at 48.7% and 33.6%, respectively. However, net margin showed some decline recently, slipping to 24.7% in 2025. Growth in revenue and earnings was more moderate, with slight margin pressure in the most recent year.
Which one has the stronger fundamentals?
Micron Technology exhibits stronger fundamentals with higher revenue and net income growth rates, alongside improved margins and a full favorable income statement evaluation. Applied Materials, while profitable with solid margins, shows slower revenue growth and some margin deterioration, leading to a less consistent income statement assessment. Micron’s recent performance indicates more dynamic financial improvement.
Financial Ratios Comparison
The table below presents the most recent financial ratios for Micron Technology, Inc. (MU) and Applied Materials, Inc. (AMAT) based on their fiscal year 2025 data, providing a clear view of their operational efficiency, profitability, liquidity, and leverage.
| Ratios | Micron Technology, Inc. (MU) | Applied Materials, Inc. (AMAT) |
|---|---|---|
| ROE | 15.76% | 34.28% |
| ROIC | 12.12% | 21.96% |
| P/E | 15.94 | 26.58 |
| P/B | 2.51 | 9.11 |
| Current Ratio | 2.52 | 2.61 |
| Quick Ratio | 1.79 | 1.87 |
| D/E (Debt-to-Equity) | 0.28 | 0.35 |
| Debt-to-Assets | 18.45% | 19.42% |
| Interest Coverage | 20.69 | 30.81 |
| Asset Turnover | 0.45 | 0.78 |
| Fixed Asset Turnover | 0.79 | 5.54 |
| Payout ratio | 6.11% | 19.78% |
| Dividend yield | 0.38% | 0.74% |
Interpretation of the Ratios
Micron Technology, Inc.
Micron Technology shows a generally favorable ratio profile with strong net margin at 22.84% and return on equity at 15.76%, indicating efficient profitability. The current and quick ratios are solid at 2.52 and 1.79, reflecting good liquidity. However, asset turnover ratios are weaker, suggesting less efficient asset use. Its dividend yield is low at 0.38%, with payouts covered by free cash flow but posing some sustainability concerns.
Applied Materials, Inc.
Applied Materials exhibits robust profitability with a net margin of 24.67% and an impressive return on equity of 34.28%. Liquidity ratios remain favorable, and the company benefits from a strong fixed asset turnover of 5.54, highlighting efficient asset utilization. Its dividend yield stands at 0.74%, supported by solid cash flow coverage, though the elevated price-to-book ratio raises valuation questions.
Which one has the best ratios?
Between the two, Applied Materials has a higher proportion of favorable ratios (64.29% versus 57.14%) and stronger returns on equity and invested capital. Micron Technology has a more conservative valuation and liquidity profile but weaker asset turnover. Overall, both companies present favorable fundamentals with distinct strengths and manageable weaknesses.
Strategic Positioning
This section compares the strategic positioning of Micron Technology, Inc. and Applied Materials, Inc. regarding market position, key segments, and exposure to technological disruption:
Micron Technology, Inc.
- Larger market cap (~373B USD), faces competitive pressure in semiconductors memory segment.
- Focused on memory and storage products: DRAM, NAND, NOR across computing, mobile, and storage markets.
- Moderate exposure through evolving memory technologies but no direct mention of disruption risk.
Applied Materials, Inc.
- Smaller market cap (~240B USD), operates in equipment and services for semiconductor fabrication.
- Diversified segments: semiconductor systems equipment, global services, display technologies.
- Exposure via advanced semiconductor manufacturing technologies and factory automation software.
Micron Technology, Inc. vs Applied Materials, Inc. Positioning
Micron concentrates on memory products, driving revenue mainly from DRAM and NAND, while Applied Materials offers a more diversified portfolio including equipment and services, covering semiconductor and display industries. Micron’s market cap is larger, but Applied’s broader segment range supports varied revenue drivers.
Which has the best competitive advantage?
Both have a slightly favorable moat rating; Micron is shedding value but improving profitability, while Applied Materials creates value with declining profitability, indicating neither demonstrates a strong sustainable competitive advantage currently.
Stock Comparison
The stock price chart highlights significant bullish movements for both Micron Technology, Inc. and Applied Materials, Inc. over the past 12 months, with Micron showing stronger acceleration and wider price fluctuations.
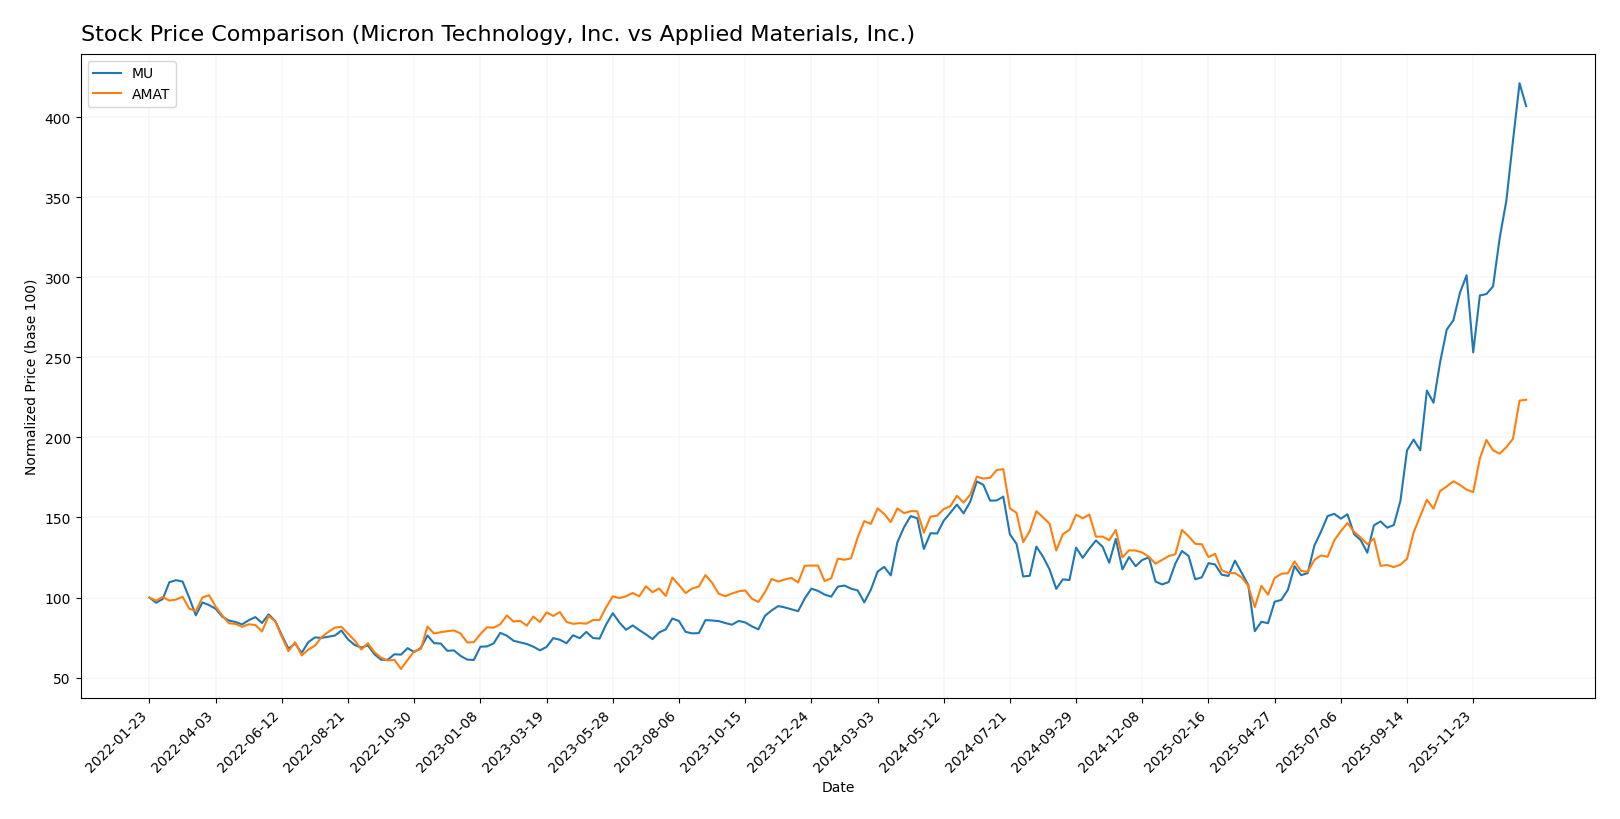
Trend Analysis
Micron Technology, Inc. (MU) displayed a robust bullish trend over the past year with a 287.62% price increase, marked by acceleration and a high standard deviation of 57.56. The stock reached a peak of 345.09 and a low of 64.72.
Applied Materials, Inc. (AMAT) also showed a bullish trend with a 53.12% price rise and acceleration, accompanied by a standard deviation of 33.84. The stock’s highest and lowest prices were 301.89 and 126.95, respectively.
Comparing both, Micron Technology delivered the highest market performance with a substantially greater percentage increase and stronger acceleration than Applied Materials over the analyzed period.
Target Prices
Analysts present a balanced target price consensus for these semiconductor leaders.
| Company | Target High | Target Low | Consensus |
|---|---|---|---|
| Micron Technology, Inc. | 450 | 190 | 328.22 |
| Applied Materials, Inc. | 400 | 250 | 315.57 |
Overall, Micron’s consensus target slightly exceeds its current price of 333.35, while Applied Materials’ target consensus aligns closely with its current price of 301.89, reflecting moderate analyst optimism.
Analyst Opinions Comparison
This section compares analysts’ ratings and grades for Micron Technology, Inc. (MU) and Applied Materials, Inc. (AMAT):
Rating Comparison
MU Rating
- Rating: B, considered very favorable overall.
- Discounted Cash Flow Score: 1, rated very unfavorable.
- ROE Score: 4, favorable efficiency in generating profit from equity.
- ROA Score: 5, very favorable asset utilization.
- Debt To Equity Score: 3, moderate financial risk.
- Overall Score: 3, moderate overall financial standing.
AMAT Rating
- Rating: B+, also very favorable overall.
- Discounted Cash Flow Score: 3, rated moderate.
- ROE Score: 5, very favorable efficiency in generating profit.
- ROA Score: 5, very favorable asset utilization.
- Debt To Equity Score: 2, moderate but lower risk.
- Overall Score: 3, moderate overall financial standing.
Which one is the best rated?
Based strictly on the data, AMAT holds a slightly better rating (B+) compared to MU’s (B). AMAT scores higher in discounted cash flow and return on equity, indicating stronger financial efficiency and valuation metrics.
Scores Comparison
The following table compares the Altman Z-Score and Piotroski Score for Micron Technology, Inc. (MU) and Applied Materials, Inc. (AMAT):
MU Scores
- Altman Z-Score: 10.5, indicating a safe zone with low bankruptcy risk.
- Piotroski Score: 7, reflecting strong financial health.
AMAT Scores
- Altman Z-Score: 13.45, indicating a safe zone with very low bankruptcy risk.
- Piotroski Score: 7, reflecting strong financial health.
Which company has the best scores?
Both MU and AMAT have Altman Z-Scores placing them in the safe zone, with AMAT’s score higher, implying slightly lower bankruptcy risk. Their Piotroski Scores are equal at 7, indicating comparable financial strength based on the provided data.
Grades Comparison
The following presents a detailed comparison of recent grades from reputable grading companies for Micron Technology, Inc. and Applied Materials, Inc.:
Micron Technology, Inc. Grades
Here are the latest grades assigned by established grading companies for Micron Technology, Inc.:
| Grading Company | Action | New Grade | Date |
|---|---|---|---|
| Keybanc | Maintain | Overweight | 2026-01-13 |
| B of A Securities | Maintain | Buy | 2026-01-13 |
| Lynx Global | Maintain | Buy | 2026-01-12 |
| Mizuho | Maintain | Outperform | 2026-01-09 |
| UBS | Maintain | Buy | 2026-01-07 |
| Piper Sandler | Maintain | Overweight | 2026-01-07 |
| Piper Sandler | Maintain | Overweight | 2025-12-18 |
| Barclays | Maintain | Overweight | 2025-12-18 |
| Keybanc | Maintain | Overweight | 2025-12-18 |
| Wolfe Research | Maintain | Outperform | 2025-12-18 |
Micron Technology shows a consistent trend of positive ratings, predominantly “Buy,” “Overweight,” and “Outperform,” with no recent downgrades.
Applied Materials, Inc. Grades
Below is a summary of recent grades from recognized grading firms for Applied Materials, Inc.:
| Grading Company | Action | New Grade | Date |
|---|---|---|---|
| B of A Securities | Maintain | Buy | 2026-01-13 |
| Susquehanna | Upgrade | Positive | 2026-01-12 |
| Cantor Fitzgerald | Maintain | Overweight | 2026-01-08 |
| B. Riley Securities | Maintain | Buy | 2025-12-18 |
| Mizuho | Maintain | Neutral | 2025-12-17 |
| Wells Fargo | Maintain | Overweight | 2025-12-15 |
| Jefferies | Maintain | Buy | 2025-12-15 |
| Keybanc | Maintain | Overweight | 2025-12-02 |
| UBS | Upgrade | Buy | 2025-11-25 |
| B. Riley Securities | Maintain | Buy | 2025-11-14 |
Applied Materials exhibits mostly favorable ratings, with multiple “Buy” and “Overweight” grades, alongside some “Neutral” and an upgrade from “Neutral” to “Positive.”
Which company has the best grades?
Both companies have received predominantly positive grades, but Micron Technology displays a stronger consensus with more consistent “Overweight” and “Outperform” ratings, indicating a slightly more bullish outlook. This consistency could imply a more stable perception among analysts, potentially impacting investor confidence differently than the somewhat mixed but positive grades seen for Applied Materials.
Strengths and Weaknesses
Below is a comparison of the key strengths and weaknesses of Micron Technology, Inc. (MU) and Applied Materials, Inc. (AMAT) based on recent data.
| Criterion | Micron Technology, Inc. (MU) | Applied Materials, Inc. (AMAT) |
|---|---|---|
| Diversification | Moderate product diversification with DRAM (28.6B) and NAND (8.5B) as main revenue drivers. | Diversified across Applied Global Services (6.2B), Display (0.9B), and Semiconductor Systems (19.9B). |
| Profitability | Favorable net margin (22.8%), ROE (15.8%), and ROIC (12.1%), but WACC is relatively high (10.5%). | Higher profitability with net margin (24.7%), ROE (34.3%), and ROIC (22.0%), though WACC is higher at 11.4%. |
| Innovation | Growing ROIC trend indicates improving operational efficiency but currently shedding value versus cost of capital. | Strong value creation with ROIC well above WACC, but ROIC is declining, signaling caution on sustainability. |
| Global presence | Solid global footprint in memory products markets, with strong focus on DRAM and NAND segments. | Broad global exposure in semiconductor equipment and services sectors, supporting multiple end markets. |
| Market Share | Leading position in memory products, especially DRAM. | Leading supplier in semiconductor manufacturing equipment with diversified market segments. |
Key takeaways: MU shows improving profitability and a focused product portfolio but is yet to achieve a durable competitive advantage. AMAT delivers strong value creation despite a declining profitability trend, supported by diversified revenue streams and global presence. Both companies present favorable fundamentals, yet investors should monitor MU’s moat development and AMAT’s ROIC trajectory closely.
Risk Analysis
Below is a comparative table outlining key risks for Micron Technology, Inc. (MU) and Applied Materials, Inc. (AMAT) based on the most recent data from 2025.
| Metric | Micron Technology, Inc. (MU) | Applied Materials, Inc. (AMAT) |
|---|---|---|
| Market Risk | High beta (1.50), cyclical semiconductor demand | Higher beta (1.67), exposure to semiconductor capital spending cycles |
| Debt level | Low debt-to-equity (0.28), favorable leverage | Moderate debt-to-equity (0.35), still favorable but higher leverage |
| Regulatory Risk | Moderate, US tech regulations and export controls | Moderate, operates globally with diverse regulatory environments |
| Operational Risk | Challenges in asset turnover (0.45 unfavorable) | Better asset turnover (0.78 neutral) but complexity in global operations |
| Environmental Risk | Exposure to energy-intensive manufacturing | Similar exposure, with focus on sustainable manufacturing practices |
| Geopolitical Risk | US-China trade tensions impact supply chains | Significant exposure to Asia-Pacific geopolitical tensions |
The most likely and impactful risks for both companies stem from market volatility linked to semiconductor cycles and geopolitical tensions, particularly US-China relations affecting supply chains. Micron shows stronger financial stability with lower debt and favorable liquidity but faces operational challenges in asset efficiency. Applied Materials enjoys higher returns but carries slightly higher leverage and valuation risks. Both remain in a safe financial zone according to Altman Z-scores, but caution is warranted given sector cyclicality and global uncertainties.
Which Stock to Choose?
Micron Technology, Inc. (MU) shows a strong income evolution with a 48.85% revenue growth in 2025 and favorable profitability metrics, including a 22.84% net margin and 15.76% ROE. Its debt levels are well managed with a debt-to-equity ratio of 0.28, and the overall financial ratios are mostly favorable, though WACC and asset turnover are less so. The company holds a very favorable B rating with a solid Altman Z-Score indicating financial safety.
Applied Materials, Inc. (AMAT) presents stable income growth with a 4.39% revenue increase in 2025 and strong profitability, reflected in a 24.67% net margin and a high 34.28% ROE. Debt metrics remain favorable, and financial ratios are predominantly positive, despite some unfavorable valuation multiples. It holds a very favorable B+ rating, with excellent Altman Z-Score and a consistent strong Piotroski score.
For investors prioritizing growth potential and improving profitability, Micron Technology’s accelerating income and improving ROIC might appear more attractive. Conversely, those valuing robust profitability and financial strength with a slight decline in ROIC could find Applied Materials preferable. Thus, the choice may depend on whether the investor favors growth momentum or established profitability.
Disclaimer: Investment carries a risk of loss of initial capital. The past performance is not a reliable indicator of future results. Be sure to understand risks before making an investment decision.
Go Further
I encourage you to read the complete analyses of Micron Technology, Inc. and Applied Materials, Inc. to enhance your investment decisions: