Home > Comparison > Technology > AMAT vs MXL
The strategic rivalry between Applied Materials, Inc. and MaxLinear, Inc. shapes the semiconductor industry’s evolution. Applied Materials operates as a capital-intensive manufacturing equipment leader, while MaxLinear focuses on high-performance mixed-signal communication SoCs. This clash highlights a contrast between broad industrial scale and specialized innovation. This analysis aims to identify which company presents the superior risk-adjusted profile for inclusion in a diversified portfolio navigating technology sector dynamics.
Table of contents
Companies Overview
Applied Materials and MaxLinear both hold pivotal roles in the semiconductor industry, shaping key technology segments globally.
Applied Materials, Inc.: Semiconductor Equipment Powerhouse
Applied Materials dominates as a leading manufacturer of semiconductor fabrication equipment. Its revenue stems from selling advanced tools and software that drive chip production, including epitaxy and chemical vapor deposition technologies. In 2026, its strategic focus centers on optimizing semiconductor systems and expanding global services to maintain its technological edge and scale.
MaxLinear, Inc.: Communications SoC Specialist
MaxLinear specializes in high-performance analog and mixed-signal system-on-chip (SoC) solutions for wired and wireless communications. It generates revenue by integrating RF, digital signal processing, and power management into communication platforms used in broadband modems, routers, and 5G infrastructure. The company’s 2026 strategy targets enhancing end-to-end communication platforms and broadening its market reach in connected home and industrial applications.
Strategic Collision: Similarities & Divergences
Both companies operate within semiconductors but pursue distinct philosophies: Applied Materials drives growth through capital-intensive manufacturing equipment, while MaxLinear focuses on integrated SoC innovation. Their primary competition unfolds in the broader semiconductor ecosystem, where fabrication tools meet communication chipsets. Investors will note Applied Materials’ scale and manufacturing moat contrast sharply with MaxLinear’s niche specialization and agility in communications technology.
Income Statement Comparison
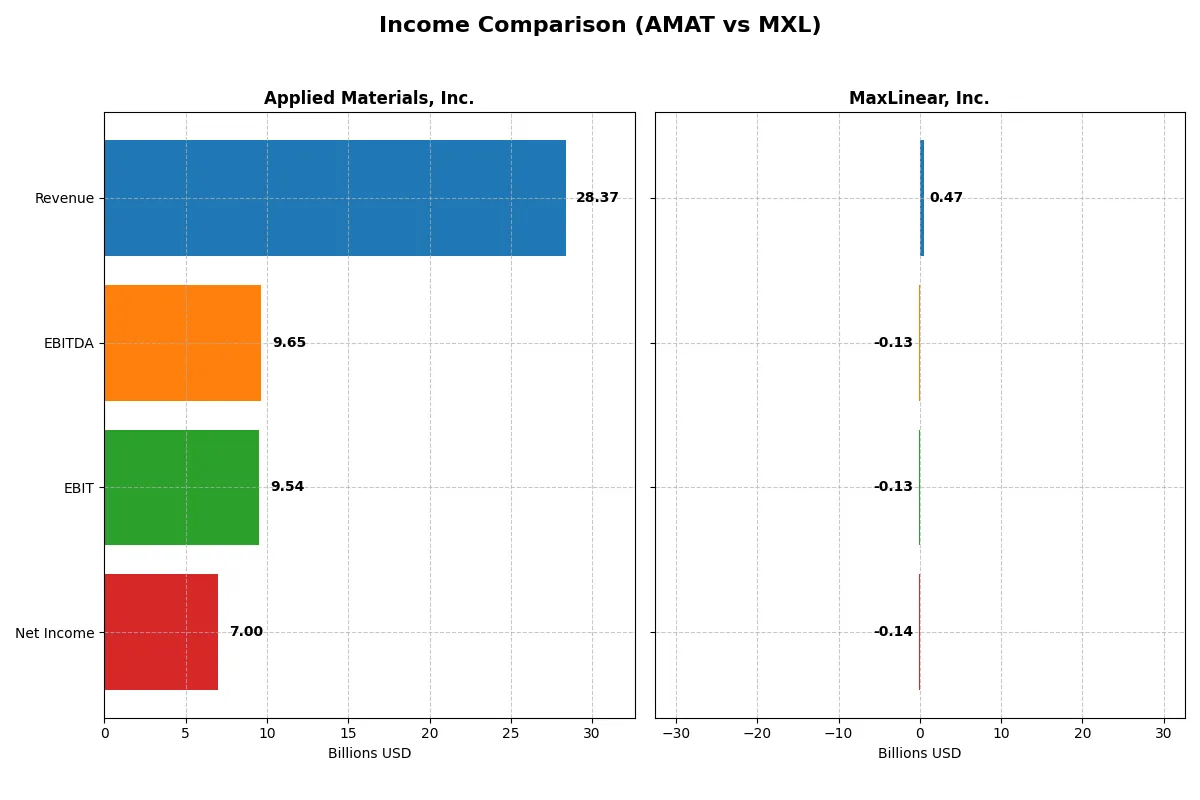
This data dissects the core profitability and scalability of both corporate engines to reveal who dominates the bottom line:
| Metric | Applied Materials, Inc. (AMAT) | MaxLinear, Inc. (MXL) |
|---|---|---|
| Revenue | 28.4B | 468M |
| Cost of Revenue | 14.6B | 202M |
| Operating Expenses | 5.52B | 393M |
| Gross Profit | 13.8B | 266M |
| EBITDA | 9.65B | -131M |
| EBIT | 9.54B | -131M |
| Interest Expense | 269M | 10.1M |
| Net Income | 7.00B | -137M |
| EPS | 8.71 | -1.58 |
| Fiscal Year | 2025 | 2025 |
Income Statement Analysis: The Bottom-Line Duel
This income statement comparison reveals which company operates with superior efficiency and bottom-line strength in the competitive tech sector.
Applied Materials, Inc. Analysis
Applied Materials shows steady revenue growth, reaching $28.4B in 2025, with net income climbing to $7B. Its gross margin holds firm at 48.7%, reflecting solid cost control. The net margin stands at a healthy 24.7%, though it slightly contracted year-over-year. The company’s EBIT margin of 33.6% signals robust operating efficiency and momentum heading into 2026.
MaxLinear, Inc. Analysis
MaxLinear’s revenue surged by 29.7% to $468M in 2025, yet it remains unprofitable, with a net loss of $137M. Despite a strong gross margin of 56.8%, the company posts a negative EBIT margin of -28%, underscoring operational challenges. However, its recent margin improvements and 57% net margin growth suggest a turnaround in progress, albeit from a weak base.
Margin Power vs. Growth Struggles
Applied Materials dominates with scale and profitability, delivering consistent net income and solid margins. MaxLinear impresses with rapid revenue growth and improving margins but faces persistent losses. Investors seeking stable profits should lean toward Applied Materials, while MaxLinear’s profile suits those willing to accept higher risk for potential gains.
Financial Ratios Comparison
These vital ratios act as a diagnostic tool to expose the underlying fiscal health, valuation premiums, and capital efficiency of companies under review:
| Ratios | Applied Materials, Inc. (AMAT) | MaxLinear, Inc. (MXL) |
|---|---|---|
| ROE | 34.3% | -47.5% |
| ROIC | 21.96% | -24.31% |
| P/E | 26.6 | -6.74 |
| P/B | 9.11 | 3.20 |
| Current Ratio | 2.61 | 1.77 |
| Quick Ratio | 1.87 | 1.28 |
| D/E (Debt to Equity) | 0.35 | 0.29 |
| Debt-to-Assets | 19.4% | 17.2% |
| Interest Coverage | 30.8 | -15.5 |
| Asset Turnover | 0.78 | 0.42 |
| Fixed Asset Turnover | 5.54 | 4.65 |
| Payout ratio | 19.8% | 0% |
| Dividend yield | 0.74% | 0% |
| Fiscal Year | 2025 | 2024 |
Efficiency & Valuation Duel: The Vital Signs
Ratios act as a company’s DNA, exposing hidden risks and operational excellence critical for investment decisions.
Applied Materials, Inc.
Applied Materials posts a robust 34.3% ROE and 24.7% net margin, signaling strong profitability. Its P/E of 26.6 and P/B of 9.1 suggest a stretched valuation relative to market benchmarks. The firm rewards shareholders modestly with a 0.74% dividend yield, while reinvesting heavily in R&D at 12.6% of revenue, fueling sustainable growth.
MaxLinear, Inc.
MaxLinear struggles with a negative ROE of -47.5% and a steep net margin loss of -68%, reflecting operational challenges. Its P/E ratio is negative, indicating losses, while a P/B of 3.2 is relatively moderate. The company pays no dividend, instead allocating over 62% of revenue to R&D, aiming to reverse its profitability issues through innovation.
Profitability Strength vs. Recovery Potential
Applied Materials offers a superior balance of strong profitability and clear operational efficiency, albeit at a premium valuation. MaxLinear’s metrics reveal significant financial stress but aggressive R&D investment suggests a turnaround focus. Investors seeking stability may prefer Applied Materials; those favoring speculative recovery might consider MaxLinear’s risk profile.
Which one offers the Superior Shareholder Reward?
I compare Applied Materials, Inc. (AMAT) and MaxLinear, Inc. (MXL) on dividends, buybacks, and reinvestment. AMAT pays consistent dividends yielding around 0.8%, with a sustainable payout ratio near 20%. It generates robust free cash flow (~7B per 1B shares) and supports buybacks, enhancing total returns. MXL pays no dividends, suffers negative net margins, and lacks free cash flow, reflecting operational challenges. Its reinvestment focuses on R&D but without clear near-term shareholder rewards. AMAT’s balanced distribution and strong cash flow offer a more sustainable, superior shareholder reward in 2026.
Comparative Score Analysis: The Strategic Profile
The radar chart reveals the fundamental DNA and trade-offs of Applied Materials, Inc. and MaxLinear, Inc., highlighting their financial strengths and valuation nuances:
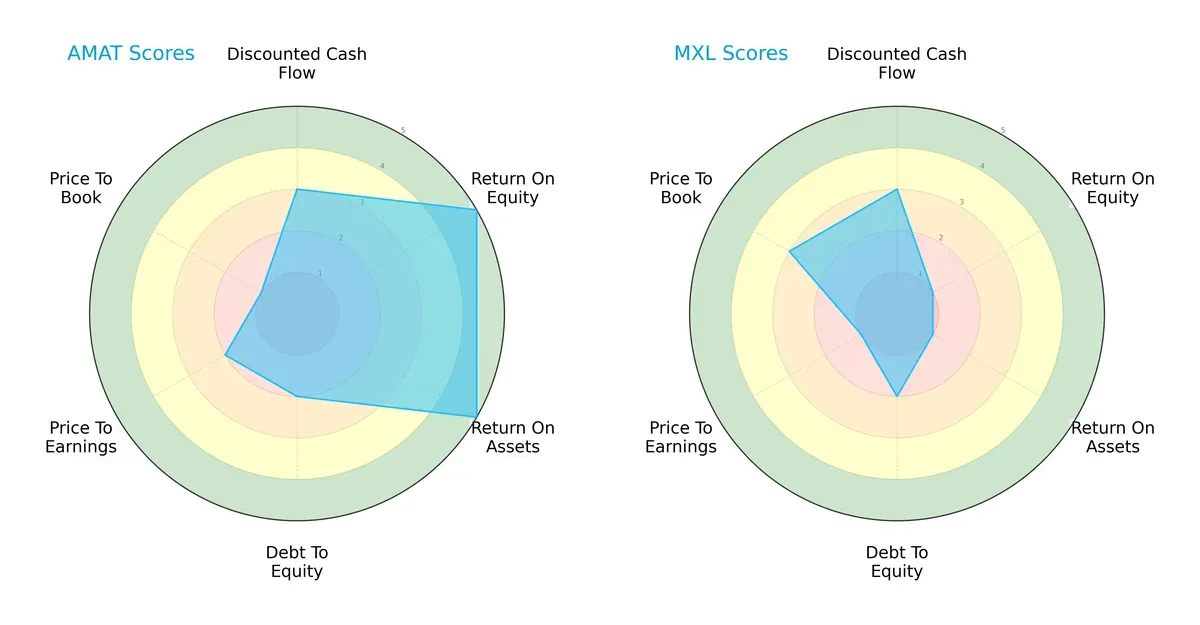
Applied Materials shows robust returns with top scores in ROE (5) and ROA (5), signaling efficient capital use. MaxLinear lags significantly in profitability (ROE 1, ROA 1) but holds a better Price-to-Book ratio (3 vs. 1). Both share moderate Debt-to-Equity scores (2). Applied Materials presents a more balanced profile; MaxLinear relies heavily on valuation metrics to attract investors.
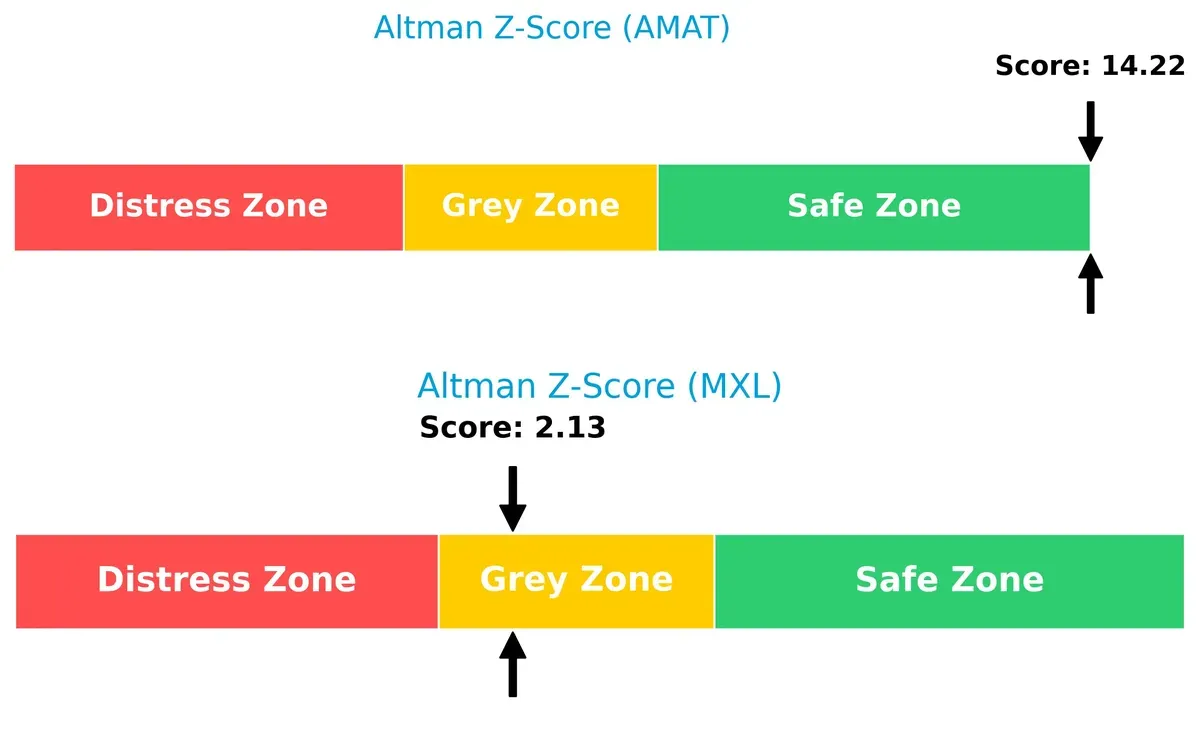
Bankruptcy Risk: Solvency Showdown
Applied Materials’ Altman Z-Score (14.2) far exceeds MaxLinear’s 2.13, indicating a strong solvency position versus a moderate bankruptcy risk for MaxLinear in this market cycle:
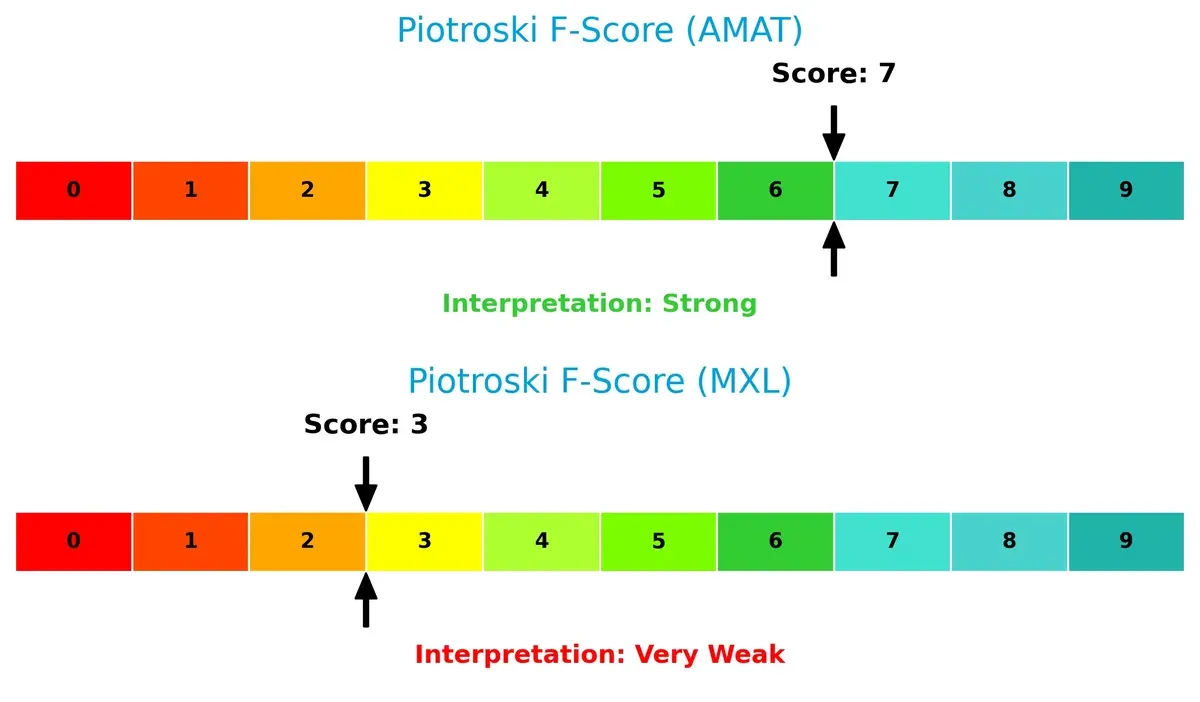
Financial Health: Quality of Operations
Applied Materials scores a healthy 7 on the Piotroski scale, reflecting strong operational quality and financial stability. MaxLinear’s 3 signals red flags, suggesting weaker internal controls and financial stress relative to its peer:
How are the two companies positioned?
This section dissects the operational DNA of Applied Materials and MaxLinear by comparing their revenue distribution and internal strengths and weaknesses. The goal: confront their economic moats to reveal which model delivers the most resilient competitive advantage today.
Revenue Segmentation: The Strategic Mix
This comparison dissects how Applied Materials, Inc. and MaxLinear, Inc. diversify their income streams and where their primary sector bets lie:
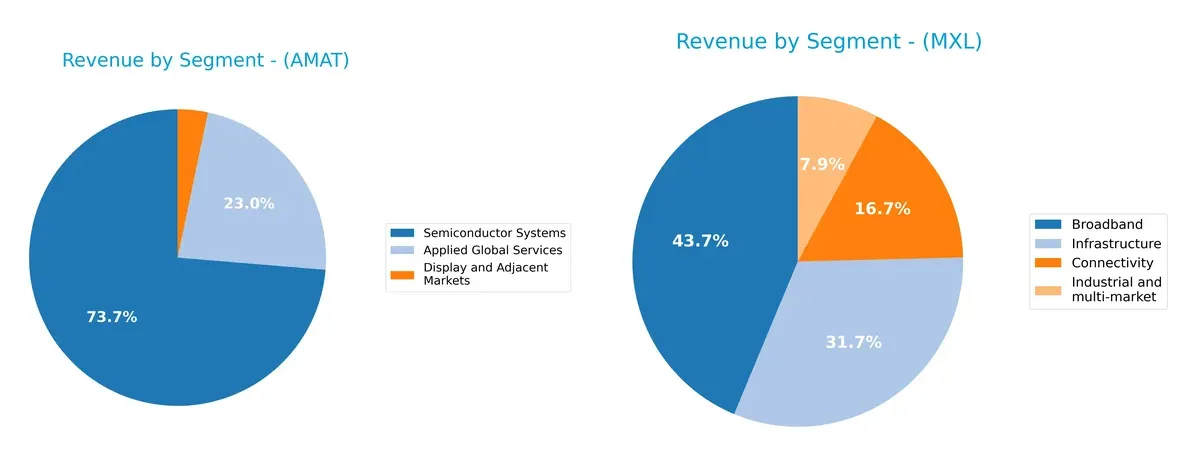
Applied Materials dwarfs MaxLinear in scale, anchored by its Semiconductor Systems segment with $19.9B in 2024. AMAT shows moderate diversification, with $6.2B from Applied Global Services and $885M from Display markets. MaxLinear relies more evenly on Broadband ($204M), Infrastructure ($148M), Connectivity ($78M), and Industrial markets ($37M) in 2025, reflecting a balanced portfolio but smaller size. AMAT’s concentration in semiconductors signals infrastructure dominance and sector expertise, while MXL’s spread mitigates concentration risk but lacks AMAT’s ecosystem lock-in.
Strengths and Weaknesses Comparison
This table compares the Strengths and Weaknesses of Applied Materials and MaxLinear:
Applied Materials Strengths
- Strong profitability with 24.67% net margin and 34.28% ROE
- Favorable liquidity ratios (current ratio 2.61, quick ratio 1.87)
- Low debt leverage (D/E 0.35)
- Diverse revenue streams including Semiconductor Systems and Global Services
- Significant global presence in China, Korea, Taiwan, and the US
- High fixed asset turnover at 5.54
MaxLinear Strengths
- Positive P/E ratio reflecting market valuation
- Favorable liquidity with current ratio 1.77 and quick ratio 1.28
- Low debt leverage (D/E 0.29) and debt to assets at 17.23%
- Revenue diversification across Broadband, Connectivity, and Infrastructure segments
- Presence in Asia and the US markets
- Moderate fixed asset turnover at 4.65
Applied Materials Weaknesses
- High valuation multiples (P/E 26.58, P/B 9.11) may pressure returns
- Dividend yield low at 0.74%
- WACC at 11.37% is above ideal, increasing capital costs
- Neutral asset turnover at 0.78 limits efficiency
- Exposure to volatile semiconductor markets
MaxLinear Weaknesses
- Negative profitability metrics with -68.01% net margin and -47.49% ROE
- Negative interest coverage (-13.01) signals financial distress
- Unfavorable asset turnover at 0.42 reduces operational efficiency
- No dividend yield
- Elevated WACC at 11.7% increases financing risks
Applied Materials demonstrates robust profitability and global scale with some valuation concerns. MaxLinear faces significant profitability challenges despite decent liquidity and diversification. These factors shape their strategic priorities differently in 2026.
The Moat Duel: Analyzing Competitive Defensibility
A structural moat is the only durable shield protecting long-term profits from relentless competitive erosion. Let’s dissect how two semiconductor firms defend their turf:
Applied Materials, Inc.: Intangible Asset and Scale Moat
Applied Materials leverages cutting-edge semiconductor equipment technology and massive scale to sustain high ROIC above WACC. Its margin stability reflects entrenched customer relationships and innovation depth. In 2026, expansion into next-gen chip fabrication could reinforce this moat despite a recent ROIC decline.
MaxLinear, Inc.: Emerging Technology Moat with Growth Challenges
MaxLinear’s moat hinges on mixed-signal SoC integration, differentiating it from Applied Materials’ equipment focus. However, negative ROIC versus WACC signals value erosion. Accelerated revenue growth signals potential, but profitability must improve for a durable moat. Disruptive 5G and fiber optics markets are key opportunities ahead.
Scale and Innovation vs. Growth and Profitability: Who Defends Better?
Applied Materials holds a wider, more mature moat rooted in intangible assets and scale, enabling steady value creation despite profitability pressures. MaxLinear’s moat is narrower and unstable, relying on potential market disruption but currently shedding value. Thus, Applied Materials is better equipped to defend its semiconductor market share long term.
Which stock offers better returns?
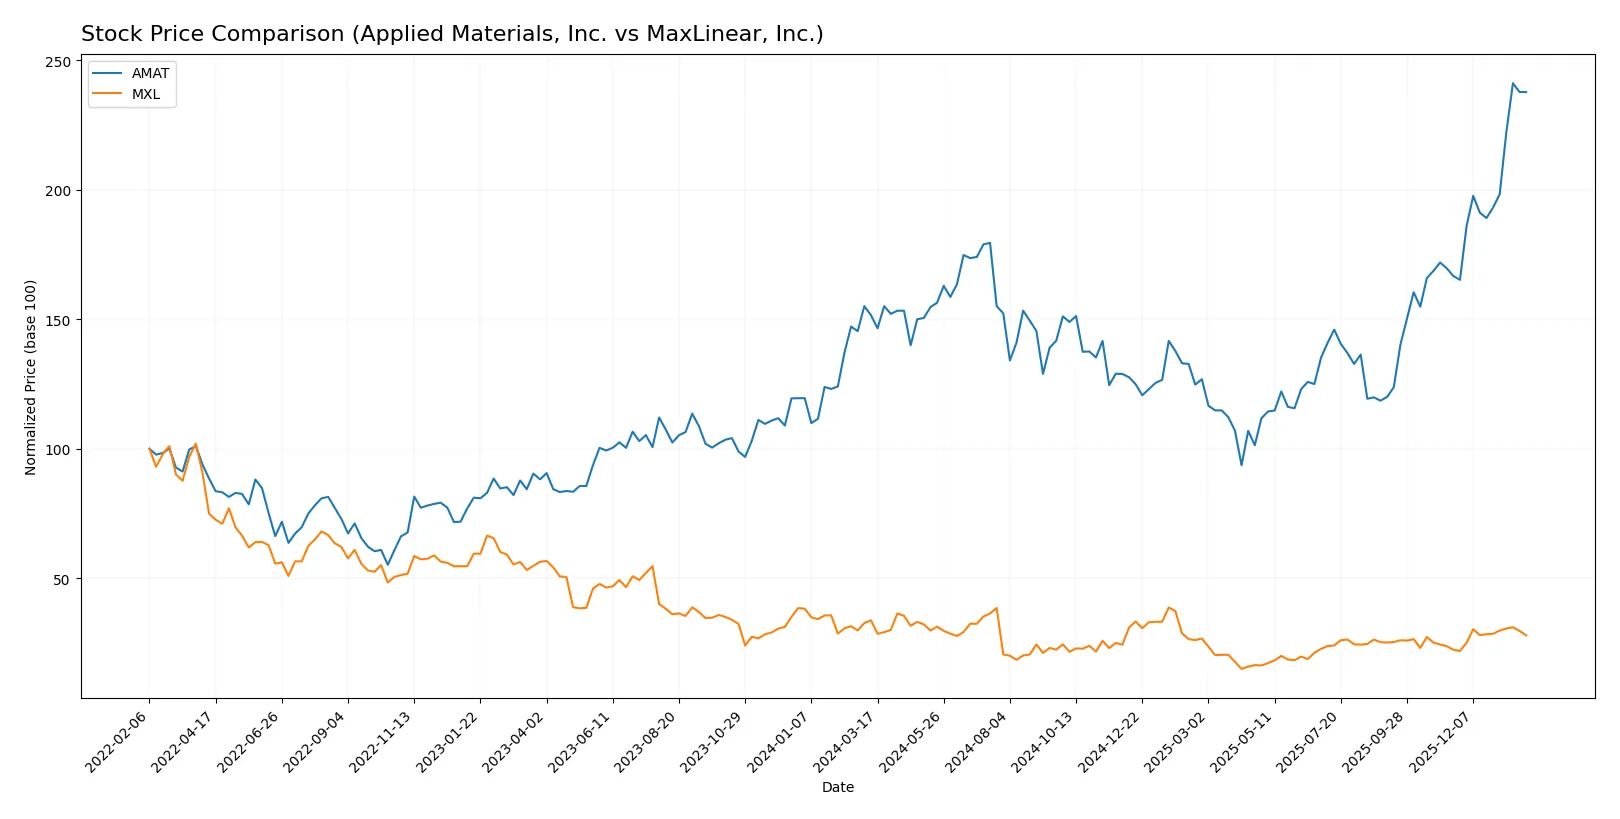
Over the past year, Applied Materials, Inc. surged impressively while MaxLinear, Inc. faced a notable decline, reflecting divergent trading dynamics and market sentiment.
Trend Comparison
Applied Materials, Inc. recorded a strong 56.8% price increase over 12 months, showing a bullish trend with accelerating momentum and high volatility between $126.95 and $327.01.
MaxLinear, Inc. experienced a 17.26% price drop over the same period, marking a bearish trend despite recent acceleration, with lower volatility and prices ranging from $9.31 to $24.05.
Applied Materials, Inc. outperformed MaxLinear, Inc. by a wide margin, delivering the highest market performance over the analyzed year.
Target Prices
Analysts present a constructive target price consensus for Applied Materials and MaxLinear, reflecting moderate upside potential.
| Company | Target Low | Target High | Consensus |
|---|---|---|---|
| Applied Materials, Inc. | 273 | 400 | 347.38 |
| MaxLinear, Inc. | 15 | 25 | 21 |
The consensus target for Applied Materials sits about 8% above the current price of 322.32, signaling cautious optimism. MaxLinear’s consensus target at 21 suggests roughly 21% upside from its present 17.35, indicating stronger growth expectations.

Don’t Let Luck Decide Your Entry Point
Optimize your entry points with our advanced ProRealTime indicators. You’ll get efficient buy signals with precise price targets for maximum performance. Start outperforming now!
How do institutions grade them?
I present the latest institutional grades for Applied Materials, Inc. and MaxLinear, Inc.:
Applied Materials, Inc. Grades
The table below shows recent grade changes and actions by major grading firms:
| Grading Company | Action | New Grade | Date |
|---|---|---|---|
| Mizuho | Upgrade | Outperform | 2026-01-28 |
| Deutsche Bank | Upgrade | Buy | 2026-01-23 |
| Needham | Maintain | Buy | 2026-01-20 |
| Keybanc | Maintain | Overweight | 2026-01-16 |
| Barclays | Upgrade | Overweight | 2026-01-15 |
| Wells Fargo | Maintain | Overweight | 2026-01-15 |
| Stifel | Maintain | Buy | 2026-01-14 |
| B of A Securities | Maintain | Buy | 2026-01-13 |
| Susquehanna | Upgrade | Positive | 2026-01-12 |
| Cantor Fitzgerald | Maintain | Overweight | 2026-01-08 |
MaxLinear, Inc. Grades
Below are recent grades and actions from recognized grading institutions:
| Grading Company | Action | New Grade | Date |
|---|---|---|---|
| Wells Fargo | Maintain | Equal Weight | 2026-01-30 |
| Benchmark | Maintain | Buy | 2026-01-16 |
| Benchmark | Maintain | Buy | 2025-10-24 |
| Benchmark | Maintain | Buy | 2025-10-17 |
| Benchmark | Maintain | Buy | 2025-09-02 |
| Loop Capital | Maintain | Hold | 2025-08-04 |
| Wells Fargo | Maintain | Equal Weight | 2025-07-24 |
| Susquehanna | Maintain | Neutral | 2025-07-24 |
| Benchmark | Maintain | Buy | 2025-07-24 |
| Susquehanna | Maintain | Neutral | 2025-07-22 |
Which company has the best grades?
Applied Materials holds stronger recent upgrades and higher-tier grades like Outperform and Overweight. MaxLinear’s grades mostly remain steady with Buy and Equal Weight. Investors may view Applied Materials as having more positive momentum.
Risks specific to each company
The following categories identify the critical pressure points and systemic threats facing both firms in the 2026 market environment:
1. Market & Competition
Applied Materials, Inc.
- Dominates semiconductor equipment with broad tech portfolio and global reach.
MaxLinear, Inc.
- Faces fierce competition in RF and mixed-signal SoCs, limiting market share growth.
2. Capital Structure & Debt
Applied Materials, Inc.
- Low debt-to-equity (0.35) and strong interest coverage (35.46) signal financial stability.
MaxLinear, Inc.
- Moderate debt level (0.29) but negative interest coverage (-13.01) raises solvency concerns.
3. Stock Volatility
Applied Materials, Inc.
- Beta 1.67 indicates above-market volatility but stable for a tech giant.
MaxLinear, Inc.
- Higher beta 1.77 suggests greater price swings, increasing trading risk.
4. Regulatory & Legal
Applied Materials, Inc.
- Operates globally with exposure to export controls and trade regulations.
MaxLinear, Inc.
- Smaller scale but exposed to telecom regulations and export compliance risks.
5. Supply Chain & Operations
Applied Materials, Inc.
- Complex global supply chain with potential disruptions in Asia-Pacific regions.
MaxLinear, Inc.
- Relies on specialized components, vulnerable to supply constraints and delays.
6. ESG & Climate Transition
Applied Materials, Inc.
- Increasing pressure to reduce carbon footprint in manufacturing processes.
MaxLinear, Inc.
- ESG initiatives less mature, facing growing investor scrutiny.
7. Geopolitical Exposure
Applied Materials, Inc.
- Significant exposure to US-China tensions and semiconductor export restrictions.
MaxLinear, Inc.
- Exposure to geopolitical risks in telecom infrastructure markets.
Which company shows a better risk-adjusted profile?
Applied Materials faces intense geopolitical and supply-chain risks but boasts a strong financial footing and market position. MaxLinear struggles with poor profitability and solvency signals, compounded by higher volatility and regulatory exposure. Applied Materials’s high Altman Z-score (14.2, safe zone) versus MaxLinear’s grey zone score (2.1) confirms superior risk resilience. The most impactful risk for Applied Materials is geopolitical tensions disrupting global supply chains. For MaxLinear, earnings losses and negative interest coverage threaten survival. Applied Materials offers a better risk-adjusted profile, supported by robust capital structure and operational scale.
Final Verdict: Which stock to choose?
Applied Materials, Inc. (AMAT) stands out as a cash-generating powerhouse with a durable competitive edge in semiconductor equipment. Its ability to consistently create value through a strong ROIC exceeding its WACC is impressive. A point of vigilance remains its declining profitability trend, which calls for close monitoring. AMAT suits portfolios targeting disciplined growth with moderate risk tolerance.
MaxLinear, Inc. (MXL) offers an intriguing growth story anchored in specialized wireless and broadband chipsets, leveraging a niche moat. However, its financial instability and value destruction reflected in persistently negative returns highlight significant risk. Relative to AMAT, MXL presents a higher volatility profile. It could appeal to speculative investors willing to endure short-term turbulence for potential turnaround gains.
If you prioritize stable value creation and proven capital efficiency, AMAT is the compelling choice due to its robust financial health and portfolio fit. However, if you seek high-risk, high-reward opportunities and can tolerate operational setbacks, MXL offers superior growth potential but with considerable uncertainty. Each scenario demands rigorous risk assessment aligned with your investment horizon.
Disclaimer: Investment carries a risk of loss of initial capital. The past performance is not a reliable indicator of future results. Be sure to understand risks before making an investment decision.
Go Further
I encourage you to read the complete analyses of Applied Materials, Inc. and MaxLinear, Inc. to enhance your investment decisions: