In today’s fast-evolving semiconductor industry, Applied Materials, Inc. and Marvell Technology, Inc. stand out as key players driving innovation and growth. Applied Materials leads in manufacturing equipment and advanced materials, while Marvell specializes in integrated circuits and storage solutions. Their overlapping markets and distinct strategies make them ideal for comparison. In this article, I will help you decide which company offers the most compelling investment opportunity in 2026.
Table of contents
Companies Overview
I will begin the comparison between Applied Materials, Inc. and Marvell Technology, Inc. by providing an overview of these two companies and their main differences.
Applied Materials, Inc. Overview
Applied Materials, Inc. provides manufacturing equipment, services, and software to semiconductor, display, and related industries. It operates through three segments: Semiconductor Systems, Applied Global Services, and Display and Adjacent Markets. The company is a market leader in equipment used for fabricating semiconductor chips and displays, serving customers globally with advanced technology solutions.
Marvell Technology, Inc. Overview
Marvell Technology, Inc. designs, develops, and sells integrated circuits, including analog, mixed-signal, and digital signal processing products. It offers Ethernet solutions, storage controllers, and application processors for various technology sectors. Headquartered in Delaware, Marvell serves a broad international market with a focus on connectivity and data infrastructure components.
Key similarities and differences
Both companies operate in the semiconductor industry and serve global markets with advanced technology products. Applied Materials focuses on semiconductor manufacturing equipment and services, while Marvell specializes in integrated circuits and storage solutions. Applied Materials has a broader product scope including display technologies, whereas Marvell emphasizes networking and data storage components.
Income Statement Comparison
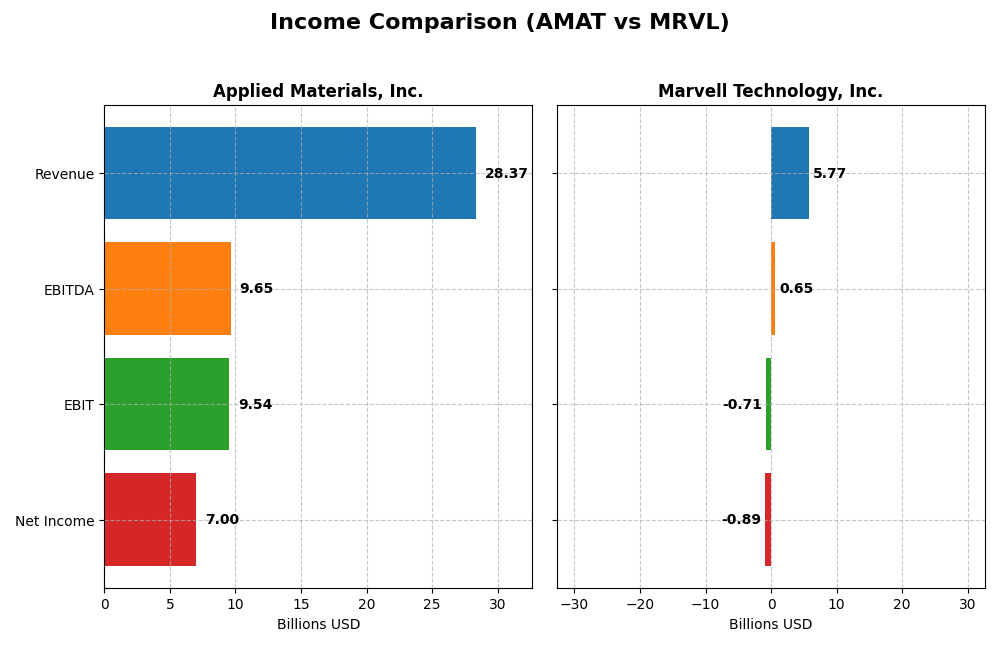
The table below presents a side-by-side comparison of key income statement metrics for Applied Materials, Inc. and Marvell Technology, Inc. for their most recent fiscal year.
| Metric | Applied Materials, Inc. (AMAT) | Marvell Technology, Inc. (MRVL) |
|---|---|---|
| Market Cap | 260B | 69B |
| Revenue | 28.37B | 5.77B |
| EBITDA | 9.65B | 652M |
| EBIT | 9.54B | -705M |
| Net Income | 7.00B | -885M |
| EPS | 8.71 | -1.02 |
| Fiscal Year | 2025 | 2025 |
Income Statement Interpretations
Applied Materials, Inc.
Applied Materials shows consistent revenue growth from 23B in 2021 to 28.4B in 2025, reflecting a 23% overall increase. Net income rose favorably by almost 19% over the period, reaching 7B in 2025. Margins remain robust, with gross margin at 48.7% and net margin at 24.7%. The latest year saw stable revenue growth but a slight net margin decline.
Marvell Technology, Inc.
Marvell’s revenue surged significantly by 94% from 3B in 2021 to 5.8B in 2025. However, net income declined sharply, resulting in a net loss of 885M in 2025. Margins deteriorated, with a negative EBIT margin of -12.2% and net margin of -15.4%. The recent year showed modest revenue improvement but worsening operating income and continued net losses.
Which one has the stronger fundamentals?
Applied Materials demonstrates stronger fundamentals overall, supported by favorable gross, EBIT, and net margins, and positive net income growth. Conversely, Marvell, despite rapid revenue growth, struggles with persistent losses and unfavorable EBIT and net margins. The income statement evaluation favors Applied Materials, indicating better profitability and financial stability.
Financial Ratios Comparison
The table below presents the most recent key financial ratios for Applied Materials, Inc. (AMAT) and Marvell Technology, Inc. (MRVL) based on their fiscal year 2025 data, allowing for a clear comparison of profitability, liquidity, leverage, and market valuation metrics.
| Ratios | Applied Materials, Inc. (AMAT) | Marvell Technology, Inc. (MRVL) |
|---|---|---|
| ROE | 34.3% | -6.6% |
| ROIC | 21.96% | -3.88% |
| P/E | 26.58 | -110.37 |
| P/B | 9.11 | 7.27 |
| Current Ratio | 2.61 | 1.54 |
| Quick Ratio | 1.87 | 1.03 |
| D/E (Debt-to-Equity) | 0.35 | 0.32 |
| Debt-to-Assets | 19.4% | 21.5% |
| Interest Coverage | 30.81 | -3.80 |
| Asset Turnover | 0.78 | 0.29 |
| Fixed Asset Turnover | 5.54 | 5.56 |
| Payout Ratio | 19.8% | -23.4% |
| Dividend Yield | 0.74% | 0.21% |
Interpretation of the Ratios
Applied Materials, Inc.
Applied Materials shows mostly strong financial ratios with favorable net margin at 24.67%, ROE at 34.28%, and ROIC at 21.96%. Its liquidity and solvency ratios are solid, including a current ratio of 2.61 and debt-to-equity of 0.35. However, valuation ratios like PE at 26.58 and PB at 9.11 are less favorable. The company pays dividends with a modest yield of 0.74%, indicating moderate shareholder returns supported by free cash flow coverage.
Marvell Technology, Inc.
Marvell Technology exhibits weak profitability ratios, including a negative net margin of -15.35%, ROE at -6.59%, and ROIC at -3.88%. Liquidity ratios are acceptable with a current ratio of 1.54, but interest coverage is negative, signaling financial stress. Marvell pays a low dividend yield of 0.21%, reflecting limited returns to shareholders amid ongoing losses and a focus on reinvestment.
Which one has the best ratios?
Applied Materials presents a more favorable overall ratio profile, with stronger profitability, liquidity, and solvency metrics compared to Marvell’s unfavorable profitability and coverage ratios. While Applied Materials faces some valuation challenges, its robust returns and dividend payments contrast with Marvell’s ongoing negative earnings and weaker financial health.
Strategic Positioning
This section compares the strategic positioning of Applied Materials, Inc. and Marvell Technology, Inc. based on Market position, Key segments, and exposure to disruption:
Applied Materials, Inc.
- Leading semiconductor equipment provider facing competitive pressure in global markets.
- Operates three segments: Semiconductor Systems, Applied Global Services, Display and Adjacent Markets.
- Exposure through advanced manufacturing technologies and software for semiconductor fabrication.
Marvell Technology, Inc.
- Designs and sells integrated circuits, competing in diverse semiconductor niches.
- Focuses on Ethernet, storage controllers, processors, and networking solutions.
- Exposure via integrated circuits and evolving storage and networking technologies.
Applied Materials, Inc. vs Marvell Technology, Inc. Positioning
Applied Materials has a diversified business model across manufacturing equipment, services, and display markets, while Marvell concentrates on integrated circuits and networking solutions. Applied Materials benefits from broad segment coverage, Marvell’s focus may limit diversification.
Which has the best competitive advantage?
Applied Materials shows a slightly favorable moat with value creation despite declining profitability. Marvell’s moat is very unfavorable, shedding value with a steeply declining ROIC trend, indicating weaker competitive advantage.
Stock Comparison
The stock prices of Applied Materials, Inc. (AMAT) and Marvell Technology, Inc. (MRVL) have shown significant movements and distinct trading dynamics over the past 12 months, with AMAT exhibiting strong acceleration and MRVL showing signs of recent deceleration.

Trend Analysis
Applied Materials, Inc. (AMAT) demonstrated a bullish trend over the past year with a 66.04% price increase, showing acceleration and notable volatility with a standard deviation of 34.73. The highest price reached was 327.36, while the lowest was 126.95.
Marvell Technology, Inc. (MRVL) also registered a bullish trend with a 22.2% gain over the year but experienced deceleration recently. Volatility was lower than AMAT’s, with a 16.46 standard deviation, and prices ranged from 49.43 to 124.76.
Comparing both, AMAT delivered the highest market performance with a significantly larger price increase and accelerating momentum, while MRVL’s recent trend turned negative with a price decline of 11.91%.
Target Prices
The current analyst consensus presents a balanced outlook with defined target ranges for both Applied Materials, Inc. and Marvell Technology, Inc.
| Company | Target High | Target Low | Consensus |
|---|---|---|---|
| Applied Materials, Inc. | 400 | 273 | 323.43 |
| Marvell Technology, Inc. | 156 | 80 | 117 |
Applied Materials’ consensus target of 323.43 is close to its current price of 326.08, suggesting a fairly valued stock. Marvell Technology’s consensus target of 117 is significantly above its current price of 80.53, indicating potential upside according to analysts.
Analyst Opinions Comparison
This section compares analysts’ ratings and grades for Applied Materials, Inc. (AMAT) and Marvell Technology, Inc. (MRVL):
Rating Comparison
AMAT Rating
- Rating: B+ with a very favorable status.
- Discounted Cash Flow Score: 3, indicating moderate value.
- ROE Score: 5, very favorable, showing excellent equity profit generation.
- ROA Score: 5, very favorable, demonstrating efficient asset use.
- Debt To Equity Score: 2, moderate risk with some leverage.
- Overall Score: 3, moderate overall financial standing.
MRVL Rating
- Rating: B+ with a very favorable status.
- Discounted Cash Flow Score: 3, indicating moderate value.
- ROE Score: 4, favorable, showing good equity profit generation.
- ROA Score: 5, very favorable, demonstrating efficient asset use.
- Debt To Equity Score: 2, moderate risk with some leverage.
- Overall Score: 3, moderate overall financial standing.
Which one is the best rated?
Both AMAT and MRVL share the same overall rating of B+ and identical discounted cash flow, ROA, debt-to-equity, and overall scores. AMAT scores higher in ROE, indicating a stronger ability to generate profit from equity, while MRVL’s ROE is slightly lower but still favorable.
Scores Comparison
The comparison of scores for Applied Materials, Inc. (AMAT) and Marvell Technology, Inc. (MRVL) highlights their financial stability and strength:
AMAT Scores
- Altman Z-Score: 13.45, indicating a safe zone status.
- Piotroski Score: 7, reflecting a strong financial state.
MRVL Scores
- Altman Z-Score: 6.76, also indicating a safe zone.
- Piotroski Score: 7, reflecting a strong financial state.
Which company has the best scores?
Both AMAT and MRVL are firmly in the safe zone for Altman Z-Score and have identical Piotroski Scores of 7, indicating similarly strong financial health. AMAT has a notably higher Altman Z-Score, suggesting comparatively greater financial stability.
Grades Comparison
Here is a comparison of the recent grades assigned to Applied Materials, Inc. and Marvell Technology, Inc.:
Applied Materials, Inc. Grades
The following table summarizes recent reliable grades from recognized grading companies for Applied Materials, Inc.:
| Grading Company | Action | New Grade | Date |
|---|---|---|---|
| B of A Securities | Maintain | Buy | 2026-01-13 |
| Susquehanna | Upgrade | Positive | 2026-01-12 |
| Cantor Fitzgerald | Maintain | Overweight | 2026-01-08 |
| B. Riley Securities | Maintain | Buy | 2025-12-18 |
| Mizuho | Maintain | Neutral | 2025-12-17 |
| Wells Fargo | Maintain | Overweight | 2025-12-15 |
| Jefferies | Maintain | Buy | 2025-12-15 |
| Keybanc | Maintain | Overweight | 2025-12-02 |
| UBS | Upgrade | Buy | 2025-11-25 |
| B. Riley Securities | Maintain | Buy | 2025-11-14 |
Overall, Applied Materials maintains a strong buy consensus with mostly buy and overweight grades and occasional upgrades.
Marvell Technology, Inc. Grades
The following table presents recent reliable grades from recognized grading companies for Marvell Technology, Inc.:
| Grading Company | Action | New Grade | Date |
|---|---|---|---|
| Rosenblatt | Maintain | Buy | 2026-01-07 |
| Melius Research | Upgrade | Buy | 2026-01-05 |
| Benchmark | Downgrade | Hold | 2025-12-08 |
| B. Riley Securities | Maintain | Buy | 2025-12-03 |
| JP Morgan | Maintain | Overweight | 2025-12-03 |
| Susquehanna | Maintain | Positive | 2025-12-03 |
| Benchmark | Maintain | Buy | 2025-12-03 |
| Oppenheimer | Maintain | Outperform | 2025-12-03 |
| Stifel | Maintain | Buy | 2025-12-03 |
| Rosenblatt | Maintain | Buy | 2025-12-03 |
Marvell Technology exhibits a predominantly positive rating trend with mostly buy and outperform grades, though there was one recent downgrade to hold.
Which company has the best grades?
Both companies carry a consensus “Buy” rating, but Marvell Technology has a larger number of buy ratings and an outperform grade, signaling slightly stronger analyst enthusiasm. Applied Materials shows consistent buy and overweight ratings with fewer downgrades. This difference could influence investors’ perceptions of stability and growth potential.
Strengths and Weaknesses
Below is a comparison table highlighting key strengths and weaknesses of Applied Materials, Inc. (AMAT) and Marvell Technology, Inc. (MRVL) based on their latest financial and operational data.
| Criterion | Applied Materials, Inc. (AMAT) | Marvell Technology, Inc. (MRVL) |
|---|---|---|
| Diversification | Strong diversification with three main segments: Semiconductor Systems (19.9B), Applied Global Services (6.2B), and Display & Adjacent Markets (885M) | Moderate diversification across Data Center (4.16B), Enterprise Networking (626M), Carrier Infrastructure (338M), Automotive & Industrial (322M), Consumer (316M) |
| Profitability | High profitability: Net margin 24.67%, ROE 34.28%, ROIC 21.96% | Negative profitability: Net margin -15.35%, ROE -6.59%, ROIC -3.88% |
| Innovation | Consistently investing in semiconductor technologies, leading market in equipment | Innovation challenged by negative returns; market focus on data centers and networking but profitability issues persist |
| Global presence | Broad global operations supported by diversified segments and strong services | Global presence with focus on data center and networking markets, but smaller scale compared to AMAT |
| Market Share | Leading market share in semiconductor equipment and services | Growing presence in semiconductor solutions but trailing in profitability and scale |
Key takeaways: AMAT demonstrates strong profitability and diversified revenue streams, though its ROIC has declined recently. MRVL faces profitability challenges with negative margins and declining returns, reflecting risks in its current strategy despite growth in data center products. Caution is advised considering MRVL’s unfavorable financial health.
Risk Analysis
Below is a comparative table summarizing key risk factors for Applied Materials, Inc. (AMAT) and Marvell Technology, Inc. (MRVL) based on the latest data from 2025.
| Metric | Applied Materials, Inc. (AMAT) | Marvell Technology, Inc. (MRVL) |
|---|---|---|
| Market Risk | Beta 1.67 indicates moderate volatility | Beta 1.95 indicates higher volatility |
| Debt level | Debt/Equity 0.35, Debt to Assets 19.42% (favorable) | Debt/Equity 0.32, Debt to Assets 21.5% (favorable) |
| Regulatory Risk | Moderate, operates globally including US, China, Asia | Moderate, operates in diverse markets including US, Asia, Israel |
| Operational Risk | Strong operational efficiency (ROIC 21.96%, asset turnover neutral) | Operational challenges (negative net margin, low asset turnover 0.29) |
| Environmental Risk | Industry pressures on sustainability, no major incidents reported | Similar industry pressures, no major incidents reported |
| Geopolitical Risk | Exposure to China, Taiwan, Korea markets | Exposure to China, Taiwan, South Korea, Israel |
The most impactful risks are operational and market risks. Marvell faces profitability challenges with negative margins and lower operational efficiency, increasing its financial risk despite manageable debt. Applied Materials shows stronger financial health but remains exposed to geopolitical tensions in Asia. Caution is advised given MRVL’s unfavorable profitability and interest coverage risks.
Which Stock to Choose?
Applied Materials, Inc. (AMAT) shows steady income growth with a 23% rise in revenue over five years and favorable profitability metrics, including a 24.67% net margin. Its financial ratios are mostly favorable, supported by low debt levels and a strong current ratio of 2.61. The company holds a very favorable rating of B+ and demonstrates value creation with ROIC exceeding WACC, despite a declining trend.
Marvell Technology, Inc. (MRVL) presents mixed financial results with significant revenue growth of 94% over five years but negative profitability, reflected in a -15.35% net margin and unfavorable returns on equity and capital. Financial ratios are predominantly unfavorable, though debt levels remain moderate, and it shares the same B+ rating. MRVL is currently destroying value with ROIC well below WACC and declining profitability.
Investors prioritizing stability, consistent profitability, and value creation might find AMAT’s profile more favorable, whereas those focused on rapid revenue growth and willing to tolerate higher risk could interpret MRVL’s profile as a growth opportunity, albeit with caution given its weaker financial health.
Disclaimer: Investment carries a risk of loss of initial capital. The past performance is not a reliable indicator of future results. Be sure to understand risks before making an investment decision.
Go Further
I encourage you to read the complete analyses of Applied Materials, Inc. and Marvell Technology, Inc. to enhance your investment decisions: