In the fast-evolving semiconductor industry, Applied Materials, Inc. (AMAT) and Lattice Semiconductor Corporation (LSCC) stand out as key players with distinct approaches to innovation and market focus. AMAT leads in manufacturing equipment and advanced technologies, while LSCC specializes in programmable semiconductors and IP licensing. This comparison explores their strategic strengths and market positions to help you decide which company presents the most compelling investment opportunity in 2026.
Table of contents
Companies Overview
I will begin the comparison between Applied Materials and Lattice Semiconductor by providing an overview of these two companies and their main differences.
Applied Materials Overview
Applied Materials, Inc. provides manufacturing equipment, services, and software primarily for the semiconductor, display, and related industries. Operating globally, it develops and sells advanced semiconductor fabrication tools and technologies. The company holds a strong position in the market with a broad product portfolio and segments that include Semiconductor Systems, Applied Global Services, and Display and Adjacent Markets.
Lattice Semiconductor Overview
Lattice Semiconductor Corporation develops and sells semiconductor products worldwide, focusing on field programmable gate arrays and video connectivity application-specific standard products. It also licenses its technology portfolio through IP and patent services. Serving original equipment manufacturers in communications, computing, consumer, industrial, and automotive markets, Lattice operates with a specialized product range and a global distribution network.
Key similarities and differences
Both companies operate in the semiconductor industry and serve global markets, but Applied Materials focuses on manufacturing equipment and services for chip fabrication and display technologies, while Lattice Semiconductor specializes in programmable logic devices and IP licensing. Applied Materials has a larger scale and broader product segments, whereas Lattice targets niche markets with fewer employees and a narrower product portfolio.
Income Statement Comparison
This table presents a side-by-side comparison of key income statement metrics for Applied Materials, Inc. and Lattice Semiconductor Corporation for their most recent fiscal years.
| Metric | Applied Materials, Inc. (AMAT) | Lattice Semiconductor Corporation (LSCC) |
|---|---|---|
| Market Cap | 260B | 12.2B |
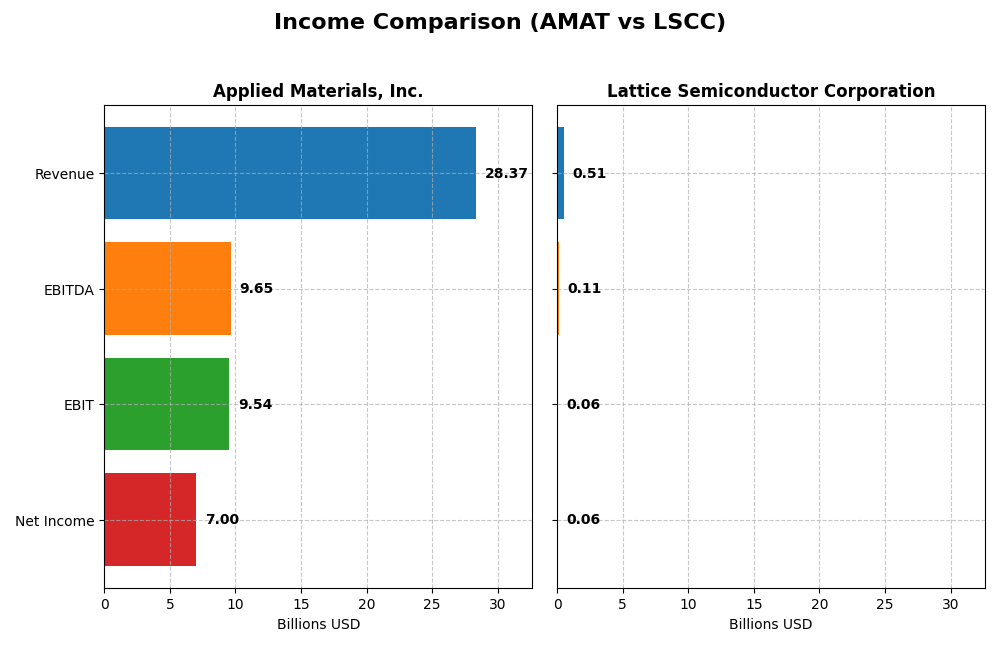
| Revenue | 28.4B | 509M |
| EBITDA | 9.65B | 107M |
| EBIT | 9.54B | 61M |
| Net Income | 7.0B | 61M |
| EPS | 8.71 | 0.44 |
| Fiscal Year | 2025 | 2024 |
Income Statement Interpretations
Applied Materials, Inc.
Applied Materials demonstrated steady revenue growth from $23.1B in 2021 to $28.4B in 2025, with net income rising from $5.9B to $7.0B over the same period. Gross and EBIT margins remained favorable, around 48.7% and 33.6% respectively. The latest year showed moderate revenue growth of 4.4% but a slight net margin decline, indicating margin pressure despite higher operating income.
Lattice Semiconductor Corporation
Lattice Semiconductor’s revenue grew from $408M in 2020 to $509M in 2024, with net income increasing from $47M to $61M. Margins are favorable, especially a strong gross margin of 66.8%, but EBIT and net margins are significantly lower than Applied Materials. The most recent year saw a sharp 30.9% revenue decline and a 65.9% net margin drop, reflecting a challenging period after prior growth.
Which one has the stronger fundamentals?
Applied Materials shows stronger fundamentals with larger scale, more consistent revenue and net income growth, and stable, high margins. Lattice Semiconductor, while maintaining a solid gross margin and overall positive growth over five years, experienced significant setbacks recently. Applied Materials’ income statement reflects a more resilient and balanced financial performance.
Financial Ratios Comparison
The table below presents a side-by-side comparison of key financial ratios for Applied Materials, Inc. (AMAT) and Lattice Semiconductor Corporation (LSCC) based on their most recent fiscal year data.
| Ratios | Applied Materials, Inc. (2025) | Lattice Semiconductor Corporation (2024) |
|---|---|---|
| ROE | 34.3% | 8.6% |
| ROIC | 21.96% | 4.6% |
| P/E | 26.6 | 132.7 |
| P/B | 9.11 | 11.41 |
| Current Ratio | 2.61 | 3.66 |
| Quick Ratio | 1.87 | 2.62 |
| D/E (Debt-to-Equity) | 0.35 | 0.02 |
| Debt-to-Assets | 19.4% | 1.8% |
| Interest Coverage | 30.8 | 129.5 |
| Asset Turnover | 0.78 | 0.60 |
| Fixed Asset Turnover | 5.54 | 7.62 |
| Payout ratio | 19.8% | 0% |
| Dividend yield | 0.74% | 0% |
Interpretation of the Ratios
Applied Materials, Inc.
Applied Materials exhibits strong profitability ratios, with net margin at 24.67%, ROE at 34.28%, and ROIC at 21.96%, all marked favorable. Liquidity and solvency metrics also appear solid, including a current ratio of 2.61 and low debt-to-assets at 19.42%. However, valuation ratios like P/E at 26.58 and P/B at 9.11 are less favorable. The company pays dividends with a modest yield of 0.74%, supported by stable payout coverage, though the yield is considered low.
Lattice Semiconductor Corporation
Lattice Semiconductor shows mixed financial strength: a favorable net margin of 12% contrasts with weaker returns on equity (8.6%) and invested capital (4.59%). The company’s valuation appears stretched with a high P/E of 132.74 and P/B of 11.41. Liquidity is strong in quick ratio terms but the current ratio is flagged unfavorable. Lattice does not pay dividends, likely prioritizing reinvestment and growth, consistent with its semiconductor market positioning.
Which one has the best ratios?
Applied Materials presents a more favorable overall ratio profile, showing higher profitability, reasonable leverage, and liquidity, despite some valuation concerns. Lattice Semiconductor’s ratios reveal more weaknesses, particularly in returns and valuation, alongside no dividend distribution. Therefore, Applied Materials currently demonstrates stronger financial ratios compared to Lattice Semiconductor.
Strategic Positioning
This section compares the strategic positioning of Applied Materials, Inc. and Lattice Semiconductor Corporation regarding market position, key segments, and exposure to technological disruption:
Applied Materials, Inc.
- Leading global semiconductor equipment provider facing intense competition in semiconductors and display markets.
- Diversified revenue from Semiconductor Systems, Applied Global Services, and Display markets driving growth.
- Technologies cover wide semiconductor manufacturing processes; moderate exposure to rapid technological change.
Lattice Semiconductor Corporation
- Smaller semiconductor firm focused on niche FPGA products amid competitive industry pressures.
- Concentrated on FPGA product families and licensing in communications, computing, and industrial sectors.
- Focuses on FPGA innovation and IP licensing, vulnerable to fast-paced semiconductor advancements.
Applied Materials, Inc. vs Lattice Semiconductor Corporation Positioning
Applied Materials pursues a diversified strategy across multiple semiconductor manufacturing segments, offering broad market exposure but facing competitive pressure in mature industries. Lattice Semiconductor concentrates on specialized FPGA products and IP licensing, allowing focused innovation but with narrower diversification and higher risk from market shifts.
Which has the best competitive advantage?
Applied Materials shows a slightly favorable moat with value creation despite declining profitability, while Lattice Semiconductor has a very unfavorable moat, destroying value with declining returns, indicating Applied Materials currently holds the stronger competitive advantage.
Stock Comparison
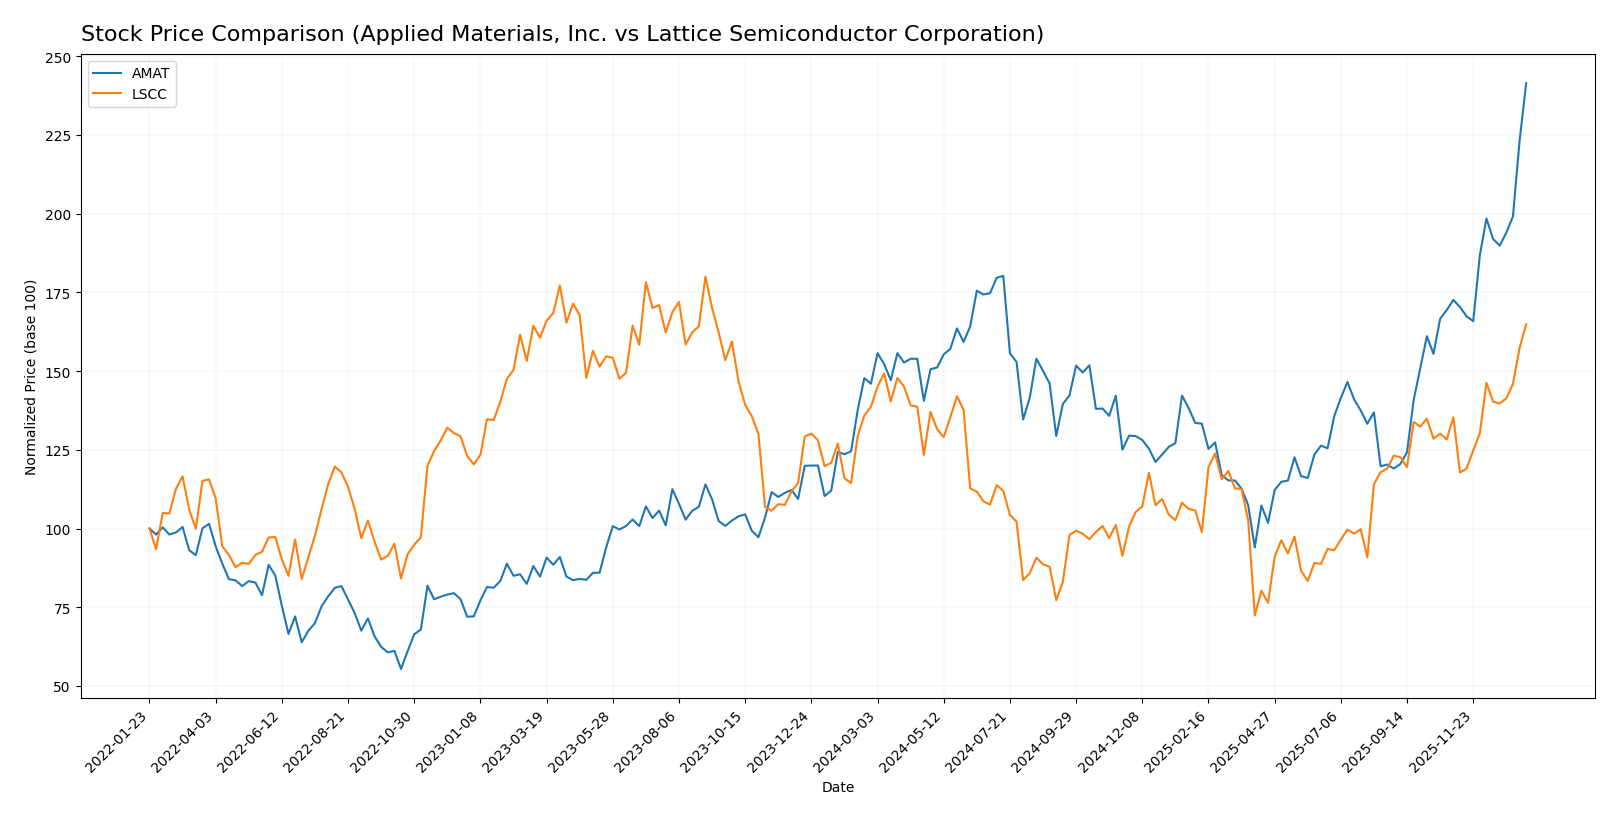
The 12-month stock price movements of Applied Materials, Inc. (AMAT) and Lattice Semiconductor Corporation (LSCC) reveal distinct bullish trends, with AMAT showing stronger acceleration and higher volatility, while LSCC exhibits steadier gains and buyer dominance in recent trading.
Trend Analysis
Applied Materials, Inc. (AMAT) experienced a strong bullish trend over the past year with a 65.37% price increase and accelerating momentum, hitting a high of 326.05 and a low of 126.95, alongside significant volatility (34.68 std deviation).
Lattice Semiconductor Corporation (LSCC) showed a bullish trend with an 18.88% price rise and accelerating gains, reaching a high of 88.87 and low of 39.03, with moderate volatility (11.09 std deviation).
Comparing both stocks, AMAT delivered the highest market performance over the past year with a substantially larger price increase and more pronounced acceleration relative to LSCC.
Target Prices
The consensus target prices for Applied Materials, Inc. and Lattice Semiconductor Corporation indicate varied analyst expectations based on recent evaluations.
| Company | Target High | Target Low | Consensus |
|---|---|---|---|
| Applied Materials, Inc. | 400 | 273 | 323.43 |
| Lattice Semiconductor Corporation | 105 | 65 | 83 |
Analysts see Applied Materials trading near its consensus target of 323.43 USD, slightly below the current price of 325.82 USD. Lattice Semiconductor’s consensus target of 83 USD is below its current price of 88.87 USD, suggesting moderate caution among analysts.
Analyst Opinions Comparison
This section compares analysts’ ratings and grades for Applied Materials, Inc. (AMAT) and Lattice Semiconductor Corporation (LSCC):
Rating Comparison
AMAT Rating
- Rating: B+, categorized as Very Favorable.
- Discounted Cash Flow Score: 3, assessed as Moderate valuation.
- ROE Score: 5, indicating very favorable efficiency in generating equity returns.
- ROA Score: 5, very favorable asset utilization.
- Debt To Equity Score: 2, moderate financial risk with some leverage.
- Overall Score: 3, a moderate summary of financial standing.
LSCC Rating
- Rating: B-, categorized as Very Favorable.
- Discounted Cash Flow Score: 3, also Moderate valuation.
- ROE Score: 2, showing moderate efficiency in generating equity returns.
- ROA Score: 3, moderate asset utilization.
- Debt To Equity Score: 4, favorable financial stability with lower leverage.
- Overall Score: 2, representing a moderate but slightly lower financial standing.
Which one is the best rated?
Based strictly on the provided data, AMAT holds a higher rating (B+) compared to LSCC (B-), with stronger scores in ROE and ROA. LSCC shows better debt management but a lower overall score, making AMAT the better-rated company in this comparison.
Scores Comparison
Here is the comparison of the Altman Z-Score and Piotroski Score for Applied Materials, Inc. (AMAT) and Lattice Semiconductor Corporation (LSCC):
AMAT Scores
- Altman Z-Score: 13.45, indicating a safe zone from bankruptcy risk.
- Piotroski Score: 7, reflecting strong financial health.
LSCC Scores
- Altman Z-Score: 52.69, indicating a safe zone from bankruptcy risk.
- Piotroski Score: 5, reflecting average financial health.
Which company has the best scores?
LSCC shows a higher Altman Z-Score, suggesting stronger bankruptcy safety, but AMAT has a higher Piotroski Score, indicating better overall financial strength. Both have strengths depending on the metric considered.
Grades Comparison
Here is a detailed comparison of the grading data for Applied Materials, Inc. and Lattice Semiconductor Corporation:
Applied Materials, Inc. Grades
The following table lists recent grades for Applied Materials, Inc. from reputable grading companies:
| Grading Company | Action | New Grade | Date |
|---|---|---|---|
| B of A Securities | Maintain | Buy | 2026-01-13 |
| Susquehanna | Upgrade | Positive | 2026-01-12 |
| Cantor Fitzgerald | Maintain | Overweight | 2026-01-08 |
| B. Riley Securities | Maintain | Buy | 2025-12-18 |
| Mizuho | Maintain | Neutral | 2025-12-17 |
| Wells Fargo | Maintain | Overweight | 2025-12-15 |
| Jefferies | Maintain | Buy | 2025-12-15 |
| Keybanc | Maintain | Overweight | 2025-12-02 |
| UBS | Upgrade | Buy | 2025-11-25 |
| B. Riley Securities | Maintain | Buy | 2025-11-14 |
The overall trend for Applied Materials shows consistent buy and overweight ratings, with recent upgrades indicating growing analyst confidence.
Lattice Semiconductor Corporation Grades
The table below presents recent grades for Lattice Semiconductor Corporation from recognized grading firms:
| Grading Company | Action | New Grade | Date |
|---|---|---|---|
| Keybanc | Maintain | Overweight | 2026-01-13 |
| Stifel | Maintain | Buy | 2025-11-04 |
| Baird | Maintain | Outperform | 2025-11-04 |
| Needham | Maintain | Buy | 2025-11-04 |
| Rosenblatt | Maintain | Buy | 2025-11-04 |
| Benchmark | Maintain | Buy | 2025-11-04 |
| Susquehanna | Maintain | Positive | 2025-10-22 |
| Keybanc | Maintain | Overweight | 2025-09-30 |
| Needham | Maintain | Buy | 2025-09-22 |
| Benchmark | Maintain | Buy | 2025-09-11 |
Lattice Semiconductor’s grades consistently show buy and outperform ratings, reflecting steady analyst support without recent upgrades or downgrades.
Which company has the best grades?
Both companies hold a consensus “Buy” rating, but Applied Materials has a higher volume of buy ratings and recent upgrades, suggesting stronger analyst momentum. This could influence investor sentiment by signaling more robust confidence in Applied Materials’ near-term prospects relative to Lattice Semiconductor.
Strengths and Weaknesses
Below is a comparative table outlining the key strengths and weaknesses of Applied Materials, Inc. (AMAT) and Lattice Semiconductor Corporation (LSCC) based on the most recent financial and operational data.
| Criterion | Applied Materials, Inc. (AMAT) | Lattice Semiconductor Corporation (LSCC) |
|---|---|---|
| Diversification | Highly diversified across semiconductor systems, display markets, and global services with $19.9B revenue in semiconductor systems alone (2024). | Limited diversification, primarily focused on licensing and service revenues (~$17M in 2022). |
| Profitability | Strong profitability with net margin 24.67%, ROE 34.28%, and ROIC 21.96% (2025). | Moderate profitability; net margin 12%, but ROE 8.6% and ROIC 4.59% are weak (2024). |
| Innovation | Solid innovation track with consistent value creation (ROIC > WACC by 10.57%) but declining ROIC trend (-28%). | Weak innovation reflected in value destruction (ROIC < WACC by -7.22%) and a steep declining ROIC trend (-44.6%). |
| Global presence | Strong global footprint with diversified markets and sustainable revenue streams. | More niche, smaller scale with less global reach. |
| Market Share | Leading market share in semiconductor systems, generating nearly $20B annually. | Smaller market share with revenues under $0.4B and concentrated in licensing. |
Key takeaways: AMAT demonstrates robust profitability, diversification, and a strong market position despite a declining ROIC trend, signaling caution. LSCC shows significant challenges with value destruction, lower profitability, and limited diversification, suggesting higher investment risk.
Risk Analysis
Below is a comparative risk overview for Applied Materials, Inc. (AMAT) and Lattice Semiconductor Corporation (LSCC) based on the most recent data available.
| Metric | Applied Materials, Inc. (AMAT) | Lattice Semiconductor Corporation (LSCC) |
|---|---|---|
| Market Risk | Beta 1.67, moderate volatility | Beta 1.72, slightly higher volatility |
| Debt level | Moderate (D/E 0.35), manageable | Very low (D/E 0.02), minimal debt risk |
| Regulatory Risk | Medium, exposure to US, Asia markets | Medium, global operations, sensitive to IP regulations |
| Operational Risk | Moderate, large-scale manufacturing complexity | Moderate, smaller scale but tech-dependent |
| Environmental Risk | Moderate, manufacturing emissions and resource use | Low, less resource-intensive operations |
| Geopolitical Risk | High, significant exposure in China, Taiwan, Korea | High, similar regional exposure |
The most impactful risks are geopolitical tensions affecting supply chains, especially for AMAT with its large global footprint. Market volatility is notable for both due to high betas. AMAT’s moderate debt level is well covered by strong interest coverage, while LSCC’s very low debt reduces financial risk but reflects growth-stage investment. Regulatory and operational risks remain moderate but should be monitored closely given the semiconductor industry’s rapid technological evolution.
Which Stock to Choose?
Applied Materials, Inc. (AMAT) shows a favorable income evolution with 23% revenue growth over five years and strong profitability metrics such as a 24.7% net margin and 34.3% ROE. Its debt levels and liquidity ratios are solid, supported by a very favorable B+ rating and a slightly favorable moat despite declining ROIC.
Lattice Semiconductor Corporation (LSCC) exhibits favorable overall income growth but recent revenue and earnings declines. Profitability ratios like net margin at 12% and ROE at 8.6% are weaker, though debt metrics are low. It holds a very favorable B- rating but a very unfavorable moat, reflecting value destruction and declining profitability.
For investors, AMAT’s strong profitability, stable debt profile, and favorable rating might appeal to those seeking quality and value creation. LSCC’s profile could be more aligned with risk-tolerant investors focused on potential turnaround or growth opportunities despite recent setbacks and weaker financial ratios.
Disclaimer: Investment carries a risk of loss of initial capital. The past performance is not a reliable indicator of future results. Be sure to understand risks before making an investment decision.
Go Further
I encourage you to read the complete analyses of Applied Materials, Inc. and Lattice Semiconductor Corporation to enhance your investment decisions: