Home > Comparison > Technology > AMAT vs LRCX
The strategic rivalry between Applied Materials, Inc. and Lam Research Corporation shapes the semiconductor equipment industry’s future. Applied Materials operates as a diversified manufacturer with a broad product portfolio spanning semiconductor systems and display markets. In contrast, Lam Research focuses on specialized wafer fabrication tools with a high-precision engineering approach. This analysis examines their contrasting business models to identify which offers superior risk-adjusted returns for a diversified portfolio.

Table of contents
Companies Overview
Applied Materials and Lam Research dominate the semiconductor equipment landscape, shaping chip manufacturing technologies worldwide.
Applied Materials, Inc.: Industry-Leading Semiconductor Equipment Provider
Applied Materials serves the semiconductor, display, and related industries with manufacturing equipment and integrated services. Its core revenue stems from advanced fabrication tools including epitaxy, ion implantation, and chemical vapor deposition. In 2026, it focused on expanding its Applied Global Services to optimize fab productivity and scaling display technologies across global markets.
Lam Research Corporation: Specialist in Semiconductor Wafer Fabrication
Lam Research designs and services semiconductor processing equipment essential for integrated circuit fabrication. Its revenue relies on precision etching, deposition, and cleaning technologies like plasma CVD and atomic layer deposition. The company prioritized innovation in wafer cleaning and etch solutions to support next-generation chip manufacturing efficiency and yield improvements.
Strategic Collision: Similarities & Divergences
Both firms champion equipment innovation in semiconductor fabrication but diverge strategically; Applied Materials offers a broader suite including display tech, while Lam focuses on wafer-specific processing. Their competitive battleground lies in securing fabs as customers optimize chip yield and process complexity. Investors encounter distinct profiles: Applied Materials as a diversified leader, Lam Research as a specialized enabler in a high-stakes capital equipment niche.
Income Statement Comparison
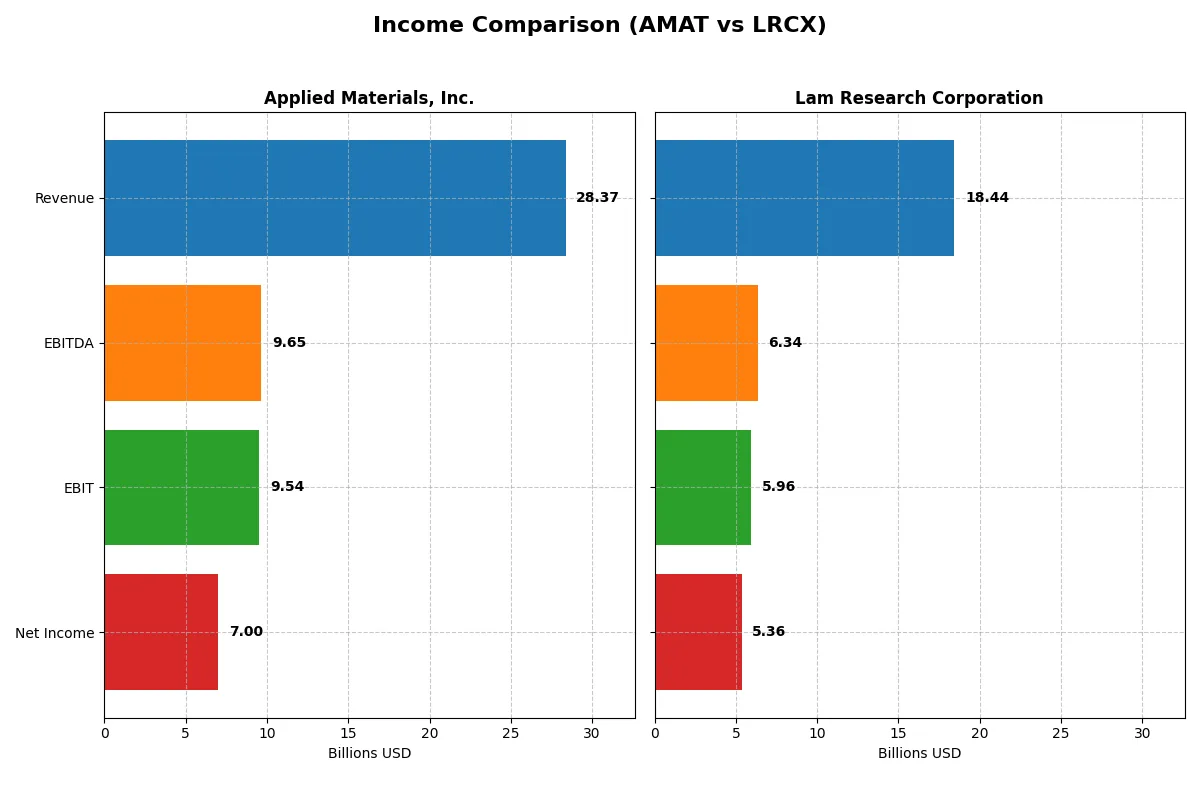
This data dissects the core profitability and scalability of both corporate engines to reveal who dominates the bottom line:
| Metric | Applied Materials, Inc. (AMAT) | Lam Research Corporation (LRCX) |
|---|---|---|
| Revenue | 28.4B | 18.4B |
| Cost of Revenue | 14.6B | 9.5B |
| Operating Expenses | 5.5B | 3.1B |
| Gross Profit | 13.8B | 9.0B |
| EBITDA | 9.7B | 6.3B |
| EBIT | 9.5B | 6.0B |
| Interest Expense | 269M | 178M |
| Net Income | 7.0B | 5.4B |
| EPS | 8.71 | 4.17 |
| Fiscal Year | 2025 | 2025 |
Income Statement Analysis: The Bottom-Line Duel
This income statement comparison reveals how efficiently Applied Materials and Lam Research convert sales into profits and sustain margin strength.
Applied Materials, Inc. Analysis
Applied Materials shows steady revenue growth, reaching $28.4B in 2025 with net income at $7.0B. Its gross margin holds firm at 48.7%, and net margin remains healthy near 24.7%. Despite slight net margin contraction recently, AMAT’s EBIT surged 13.6%, reflecting operational momentum and solid cost management.
Lam Research Corporation Analysis
Lam Research’s revenue jumped 23.7% to $18.4B in 2025, with net income climbing 40% to $5.4B. It sustains a strong gross margin of 48.7% and superior net margin of 29.1%. Lam’s EBIT expanded over 31%, driven by robust top-line growth and disciplined operating expense control, signaling accelerating profitability.
Margin Strength vs. Growth Momentum
Lam Research outpaces Applied Materials in revenue and net income growth rates and exhibits stronger net margin expansion. Applied Materials offers a larger revenue base and solid EBIT gains but shows slight margin pressure recently. Lam’s profile suits growth-focused investors, while Applied Materials appeals to those valuing scale with consistent earnings.
Financial Ratios Comparison
These vital ratios act as a diagnostic tool to expose the underlying fiscal health, valuation premiums, and capital efficiency of each company:
| Ratios | Applied Materials, Inc. (AMAT) | Lam Research Corporation (LRCX) |
|---|---|---|
| ROE | 34.3% | 54.3% |
| ROIC | 21.9% | 34.0% |
| P/E | 26.6 | 23.4 |
| P/B | 9.11 | 12.7 |
| Current Ratio | 2.61 | 2.21 |
| Quick Ratio | 1.87 | 1.55 |
| D/E (Debt-to-Equity) | 0.35 | 0.48 |
| Debt-to-Assets | 19.4% | 22.3% |
| Interest Coverage | 30.8 | 33.1 |
| Asset Turnover | 0.78 | 0.86 |
| Fixed Asset Turnover | 5.54 | 7.59 |
| Payout ratio | 19.8% | 21.5% |
| Dividend yield | 0.74% | 0.92% |
| Fiscal Year | 2025 | 2025 |
Efficiency & Valuation Duel: The Vital Signs
Financial ratios act as a company’s DNA, uncovering hidden risks and operational strengths that shape investor decisions.
Applied Materials, Inc.
Applied Materials delivers strong profitability with a 34.28% ROE and a solid 24.67% net margin, signaling efficient operations. However, its valuation looks stretched, with a P/E of 26.58 and P/B of 9.11 above typical sector norms. The company offers modest dividends at 0.74%, indicating some shareholder return but leans on reinvestment for growth.
Lam Research Corporation
Lam Research commands superior returns with an impressive 54.33% ROE and a 29.06% net margin, confirming operational excellence. Its valuation is less stretched, with a P/E of 23.36 considered neutral, though the P/B at 12.69 remains elevated. Dividend yield at 0.92% is low, showing a balance between shareholder returns and growth reinvestment.
Premium Valuation vs. Operational Safety
Both firms exhibit favorable ratios, but Lam Research’s higher profitability and balanced valuation offer a stronger risk-reward profile. Applied Materials suits investors prioritizing steady operational efficiency, while Lam fits those seeking higher returns with moderate valuation premiums.
Which one offers the Superior Shareholder Reward?
I see Applied Materials (AMAT) and Lam Research (LRCX) both distribute cash through dividends and buybacks, but with differing intensity and sustainability. AMAT yields about 0.8% with a payout ratio near 20%, well covered by free cash flow (FCF coverage ratio >2x), signaling a secure, growing stream. Its buyback program is robust, enhancing total shareholder return. LRCX offers a slightly higher yield (~0.9%) but with a higher payout ratio (~21-27%), pushing sustainability limits amid elevated debt leverage. LRCX’s buybacks are consistent but less aggressive than AMAT’s. I find AMAT’s balanced payout and stronger FCF backing more sustainable for long-term value. Thus, AMAT offers a superior total return profile in 2026.
Comparative Score Analysis: The Strategic Profile
The radar chart reveals the fundamental DNA and trade-offs of Applied Materials and Lam Research, highlighting their financial strengths and vulnerabilities:
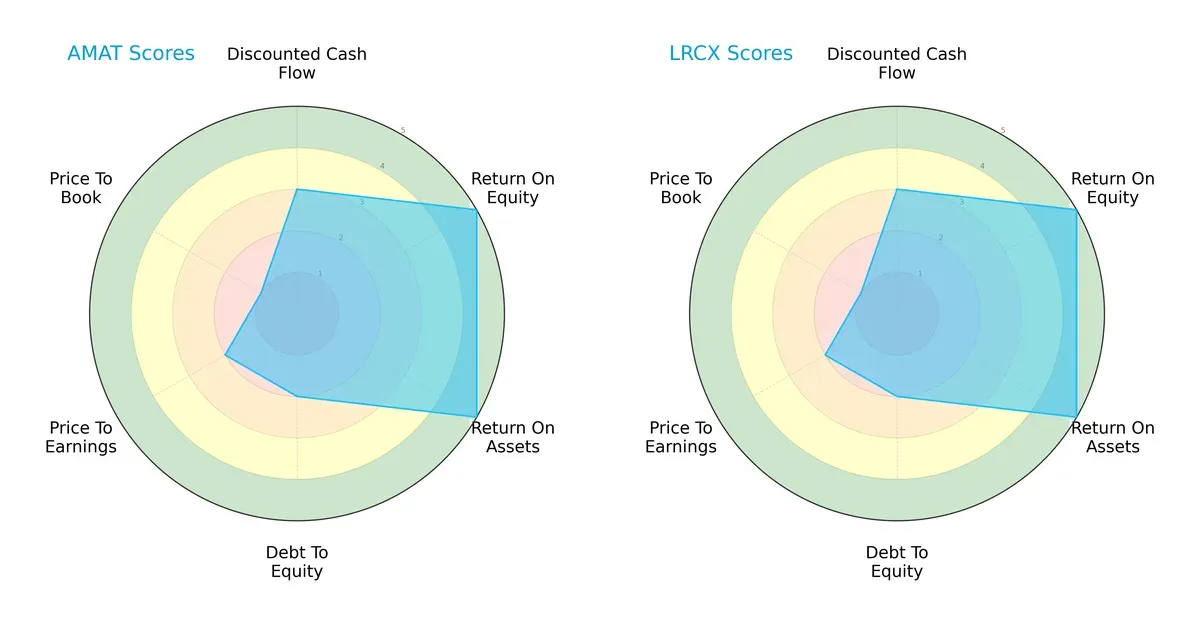
Both Applied Materials and Lam Research share identical scores across DCF (3), ROE (5), ROA (5), and Debt/Equity (2), indicating similar operational efficiency and moderate leverage. However, both struggle with valuation metrics, scoring low on PE (2) and PB (1), signaling possible overvaluation or market skepticism. Neither company holds a clear moat advantage; their profiles are balanced but constrained by valuation concerns.
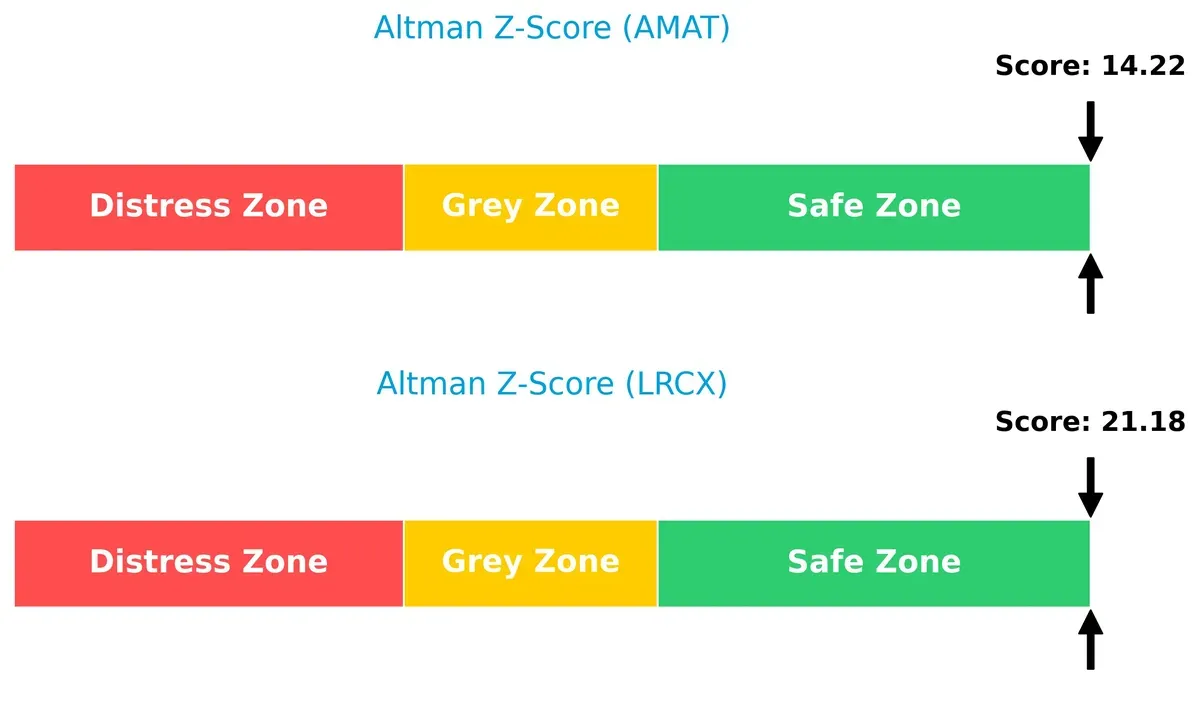
Bankruptcy Risk: Solvency Showdown
Lam Research’s Altman Z-Score of 21.18 significantly surpasses Applied Materials’ 14.22, placing both comfortably in the safe zone but marking Lam Research as the more resilient survivor in adverse cycles:
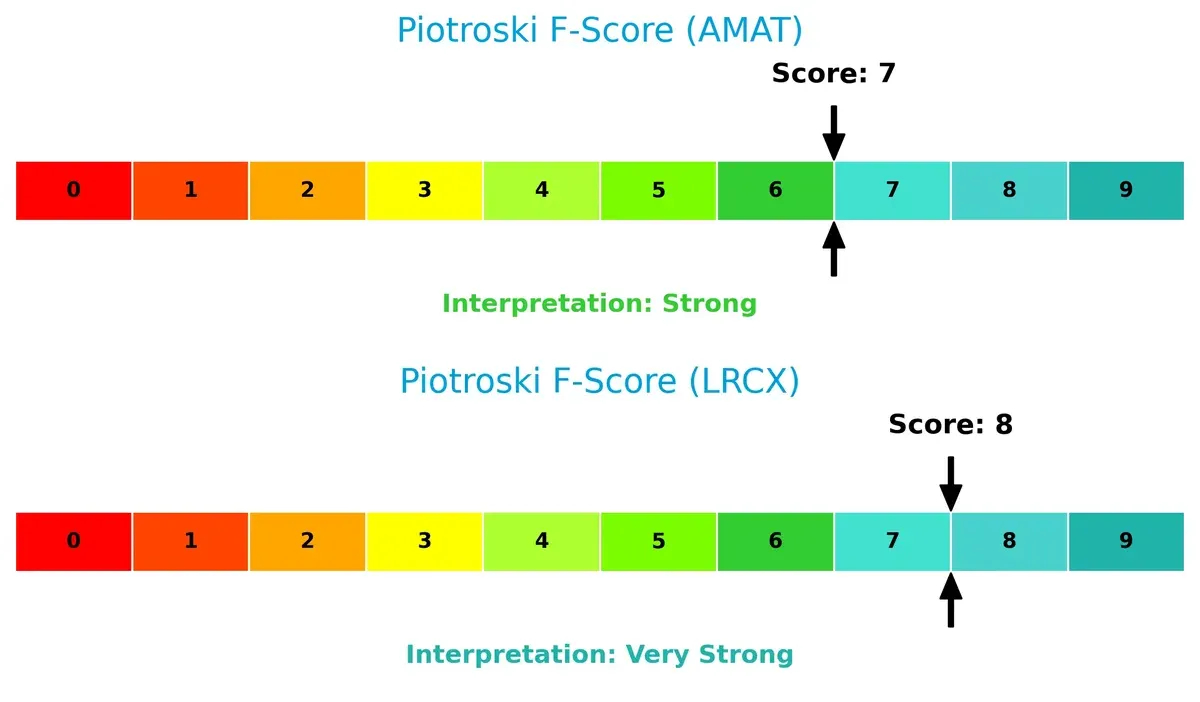
Financial Health: Quality of Operations
Lam Research edges out Applied Materials with a Piotroski F-Score of 8 versus 7, indicating very strong financial health and operational quality. Applied Materials, while strong, shows slight red flags in efficiency or liquidity metrics relative to Lam Research:
How are the two companies positioned?
This section dissects the operational DNA of AMAT and LRCX by comparing revenue distribution and internal dynamics. The goal is to confront their economic moats and identify which model offers the most resilient competitive advantage today.
Revenue Segmentation: The Strategic Mix
This comparison dissects how Applied Materials, Inc. and Lam Research Corporation diversify income streams and reveals their primary sector bets:
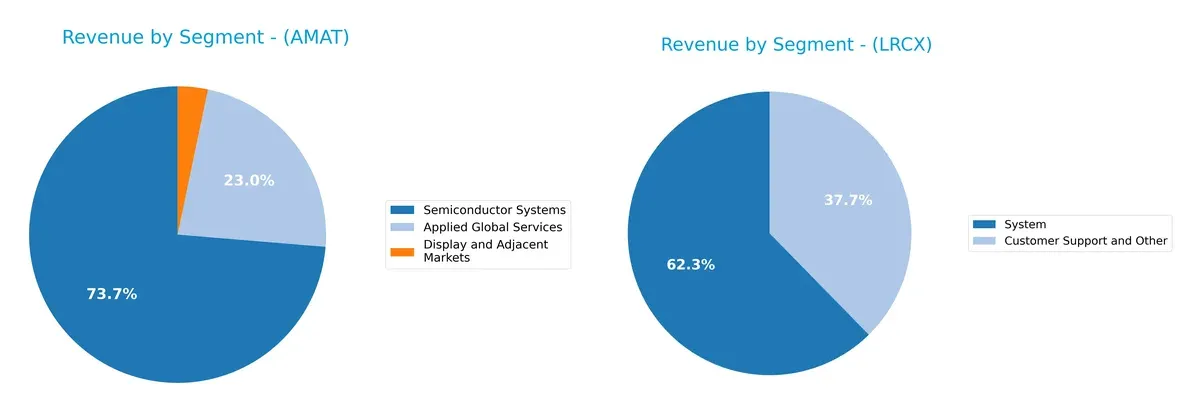
Applied Materials anchors revenue in Semiconductor Systems with $19.9B in 2024, dwarfing its other segments. Its diversified services segment, at $6.2B, complements this. Lam Research pivots around its System segment with $11.5B in 2025, supported by $6.9B in Customer Support. Applied Materials shows broader diversification, reducing concentration risk, while Lam Research leans heavily on system sales, exposing it to market cyclicality but benefiting from infrastructure dominance.
Strengths and Weaknesses Comparison
This table compares the strengths and weaknesses of Applied Materials, Inc. (AMAT) and Lam Research Corporation (LRCX):
AMAT Strengths
- Diverse revenue streams across Applied Global Services, Semiconductor Systems, and Display markets
- Strong profitability with 24.67% net margin and 34.28% ROE
- Healthy liquidity ratios: current ratio 2.61, quick ratio 1.87
- Low leverage with debt-to-assets at 19.42%
- Significant global presence, especially strong in China and Korea
- Solid fixed asset turnover at 5.54
LRCX Strengths
- Higher profitability: 29.06% net margin, 54.33% ROE, and 34.0% ROIC
- Good liquidity: current ratio 2.21, quick ratio 1.55
- Moderate leverage with debt-to-assets at 22.28%
- Strong asset efficiency with fixed asset turnover 7.59
- Global footprint with broad exposure in China, Korea, and Taiwan
- Balanced revenue from Customer Support and Systems segments
AMAT Weaknesses
- Unfavorable valuation multiples: PE 26.58 and PB 9.11
- Weighted average cost of capital (WACC) at 11.37% exceeds ROIC margin of comfort
- Dividend yield low at 0.74%
- Asset turnover modest at 0.78
- Relatively concentrated revenue sources, heavily dependent on Semiconductor Systems
- Higher exposure to geopolitical risks through China reliance
LRCX Weaknesses
- Unfavorable valuation with PB at 12.69
- WACC of 12.05% is elevated though justified by returns
- Lower dividend yield at 0.92%
- Asset turnover neutral at 0.86
- Revenue concentration in Systems segment with less diversification
- Smaller U.S. revenue base compared to AMAT
Both companies show robust profitability and liquidity, reflecting operational strength. AMAT’s wider product diversification contrasts with LRCX’s superior returns and asset efficiency. Valuation and geopolitical exposure remain key challenges for both, influencing strategic risk management going forward.
The Moat Duel: Analyzing Competitive Defensibility
A structural moat alone shields long-term profits from relentless competitive erosion in dynamic sectors like semiconductors:
Applied Materials, Inc. (AMAT): Technological Breadth with Margin Resilience
AMAT’s moat centers on intangible assets and advanced manufacturing expertise. Its stable 48.7% gross margin and 33.6% EBIT margin reflect efficient capital use. However, a declining ROIC trend signals margin pressure, requiring innovation in new semiconductor and display markets to sustain advantage in 2026.
Lam Research Corporation (LRCX): Precision Etching with Expanding Profitability
LRCX’s moat is rooted in specialized process technology and high switching costs. It posts a slightly higher 48.7% gross margin and a stronger 29.1% net margin, alongside a growing ROIC trend. This indicates robust value creation and suggests continued expansion in wafer fabrication equipment and services through 2026.
Moat Strength Showdown: Innovation Breadth vs. Specialized Precision
LRCX commands a wider and more durable moat, evidenced by its growing ROIC and consistent margin expansion. AMAT creates value but faces margin contraction risks. LRCX is better equipped to defend and grow its market share in the evolving semiconductor equipment landscape.
Which stock offers better returns?
The past year shows strong bullish momentum for both Applied Materials and Lam Research, with significant price gains and accelerating trends shaping their trading dynamics.
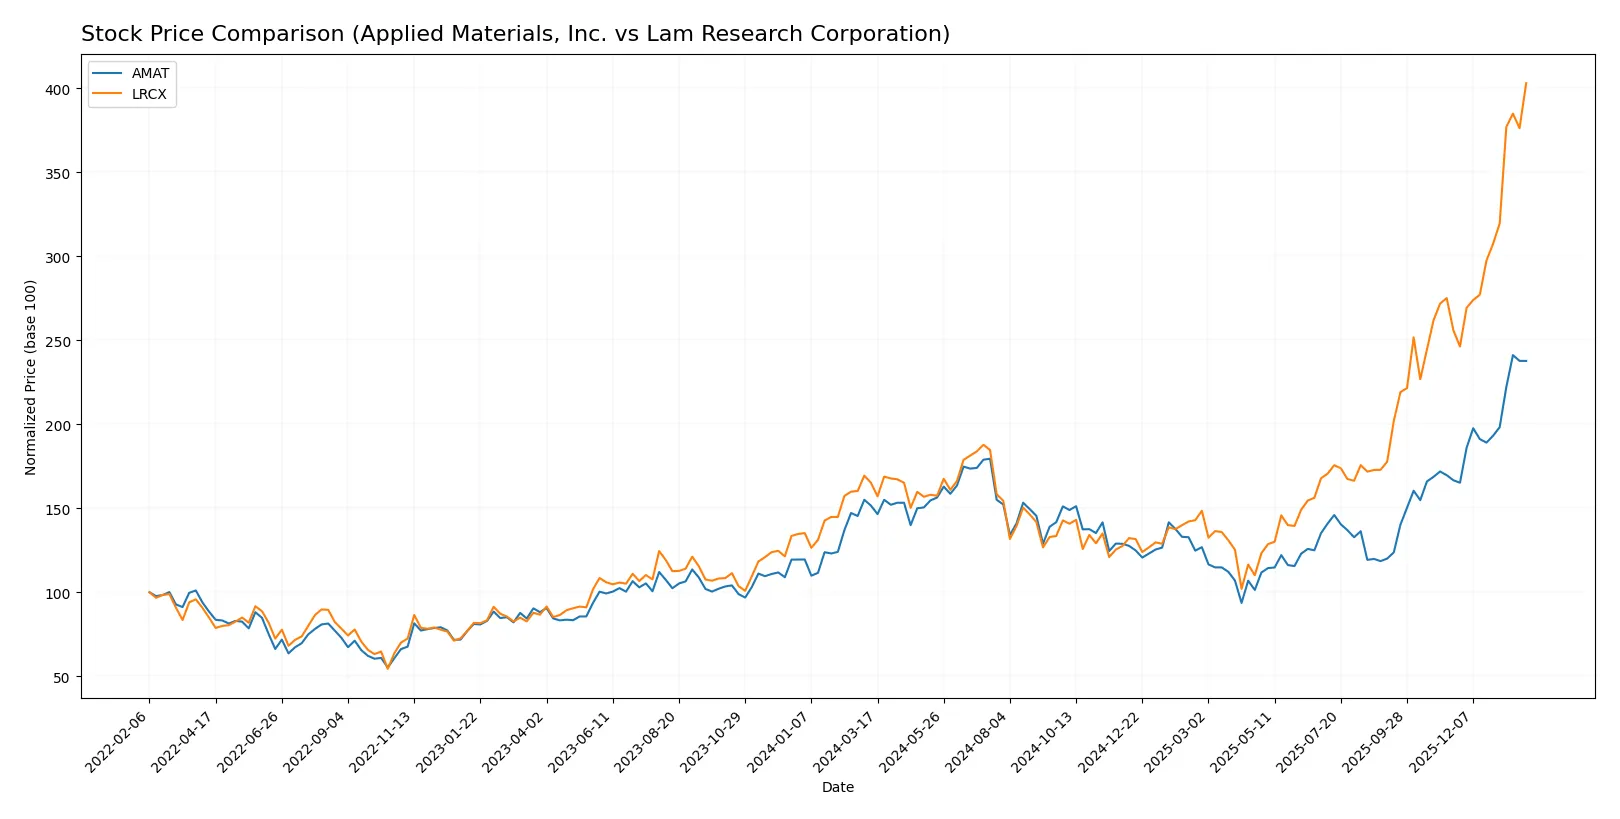
Trend Comparison
Applied Materials (AMAT) stock rose 56.8% over the last 12 months, showing a bullish trend with accelerating gains. The price ranged from $126.95 to $327.01, with volatility at 38.96.
Lam Research (LRCX) surged 144.03% in the same period, reflecting a robust bullish trend with acceleration. Its price moved between $59.09 and $233.46, with a volatility measure of 36.82.
Lam Research outperformed Applied Materials, delivering the highest market returns and stronger recent buyer dominance through 2026.
Target Prices
Analysts present a bullish consensus for Applied Materials and Lam Research, reflecting confidence in their semiconductor market positions.
| Company | Target Low | Target High | Consensus |
|---|---|---|---|
| Applied Materials, Inc. | 273 | 400 | 347.38 |
| Lam Research Corporation | 127 | 325 | 266.76 |
Applied Materials’ consensus target of 347.38 exceeds its current price of 322.32, signaling upside potential. Lam Research’s consensus target of 266.76 also suggests room for appreciation from the current 233.46.

Don’t Let Luck Decide Your Entry Point
Optimize your entry points with our advanced ProRealTime indicators. You’ll get efficient buy signals with precise price targets for maximum performance. Start outperforming now!
How do institutions grade them?
The following grades summarize institutional views on Applied Materials, Inc. and Lam Research Corporation:
Applied Materials, Inc. Grades
This table shows recent grade changes and actions from notable grading companies for Applied Materials:
| Grading Company | Action | New Grade | Date |
|---|---|---|---|
| Mizuho | Upgrade | Outperform | 2026-01-28 |
| Deutsche Bank | Upgrade | Buy | 2026-01-23 |
| Needham | Maintain | Buy | 2026-01-20 |
| Keybanc | Maintain | Overweight | 2026-01-16 |
| Barclays | Upgrade | Overweight | 2026-01-15 |
| Wells Fargo | Maintain | Overweight | 2026-01-15 |
| Stifel | Maintain | Buy | 2026-01-14 |
| B of A Securities | Maintain | Buy | 2026-01-13 |
| Susquehanna | Upgrade | Positive | 2026-01-12 |
| Cantor Fitzgerald | Maintain | Overweight | 2026-01-08 |
Lam Research Corporation Grades
This table presents recent ratings and actions from leading grading firms for Lam Research:
| Grading Company | Action | New Grade | Date |
|---|---|---|---|
| Susquehanna | Maintain | Positive | 2026-01-29 |
| Citigroup | Maintain | Buy | 2026-01-29 |
| RBC Capital | Maintain | Outperform | 2026-01-29 |
| Needham | Maintain | Buy | 2026-01-29 |
| UBS | Maintain | Buy | 2026-01-29 |
| Cantor Fitzgerald | Maintain | Overweight | 2026-01-29 |
| Goldman Sachs | Maintain | Buy | 2026-01-29 |
| Morgan Stanley | Maintain | Equal Weight | 2026-01-29 |
| Wells Fargo | Maintain | Overweight | 2026-01-29 |
| Stifel | Maintain | Buy | 2026-01-29 |
Which company has the best grades?
Applied Materials shows multiple recent upgrades to Outperform and Buy, signaling increasing institutional confidence. Lam Research maintains steady Buy and Outperform ratings but lacks recent upgrades. Investors may perceive Applied Materials as gaining momentum relative to Lam Research.
Risks specific to each company
The following categories identify the critical pressure points and systemic threats facing both Applied Materials, Inc. and Lam Research Corporation in the 2026 market environment:
1. Market & Competition
Applied Materials, Inc.
- Faces intense competition in semiconductor equipment with a broad product portfolio but high valuation multiples may pressure growth.
Lam Research Corporation
- Operates in a highly competitive sector with specialized products and slightly lower P/E, offering some pricing flexibility.
2. Capital Structure & Debt
Applied Materials, Inc.
- Maintains conservative leverage with D/E at 0.35 and strong interest coverage of 35.46, reducing financial risk.
Lam Research Corporation
- Slightly higher leverage with D/E of 0.48 but still manageable interest coverage at 33.43, indicating solid debt service capacity.
3. Stock Volatility
Applied Materials, Inc.
- Beta of 1.671 shows above-market volatility, magnifying risk in cyclical downturns.
Lam Research Corporation
- Higher beta at 1.779 signals greater stock price swings and sensitivity to macroeconomic shifts.
4. Regulatory & Legal
Applied Materials, Inc.
- Exposure to global trade policies and semiconductor export restrictions could disrupt operations.
Lam Research Corporation
- Similar regulatory risks due to global footprint, with potential impact from evolving technology export controls.
5. Supply Chain & Operations
Applied Materials, Inc.
- Extensive global operations expose it to supply chain bottlenecks, especially in Asia-Pacific regions.
Lam Research Corporation
- Also vulnerable to semiconductor supply chain disruptions, though smaller employee base may allow more agile responses.
6. ESG & Climate Transition
Applied Materials, Inc.
- Increasing pressure to improve sustainability in manufacturing processes amid rising ESG investor scrutiny.
Lam Research Corporation
- Faces similar ESG challenges, with a need to meet stricter climate transition targets in capital-intensive production.
7. Geopolitical Exposure
Applied Materials, Inc.
- Significant revenue from China and Asia makes it sensitive to US-China tensions and trade restrictions.
Lam Research Corporation
- Comparable geographic risk profile, with heavy reliance on Asian markets vulnerable to geopolitical instability.
Which company shows a better risk-adjusted profile?
Applied Materials’ strongest risk is its exposure to global supply chain vulnerabilities, while Lam Research faces pronounced stock volatility amid competitive pressures. Lam’s slightly higher leverage and beta increase its risk profile. Applied Materials, with more conservative debt and lower volatility, shows a better risk-adjusted stance. Notably, Lam’s very strong Piotroski score (8 vs. 7) reflects operational strength, but its elevated beta (1.779) signals greater market sensitivity.
Final Verdict: Which stock to choose?
Applied Materials leverages unmatched capital efficiency, consistently generating strong returns on invested capital. Its profitability is slightly eroding, signaling a need for vigilance on sustaining growth momentum. This stock suits investors aiming for aggressive growth with an appetite for moderate risk.
Lam Research commands a durable moat, demonstrated by growing ROIC and superior profitability metrics. Its robust cash flow and stable balance sheet offer a relatively safer profile compared to Applied Materials. This makes it an appealing option for growth-at-a-reasonable-price (GARP) portfolios.
If you prioritize dynamic capital efficiency and high return on equity, Applied Materials is compelling due to its strong value creation despite trending profitability challenges. However, if you seek durable competitive advantage and better stability, Lam Research outshines with expanding profitability and safer financial footing. Both stocks merit consideration within distinct investor profiles.
Disclaimer: Investment carries a risk of loss of initial capital. The past performance is not a reliable indicator of future results. Be sure to understand risks before making an investment decision.
Go Further
I encourage you to read the complete analyses of Applied Materials, Inc. and Lam Research Corporation to enhance your investment decisions: