Home > Comparison > Technology > AMAT vs KLAC
The strategic rivalry between Applied Materials, Inc. and KLA Corporation shapes the semiconductor industry’s technological frontier. Applied Materials operates as a capital-intensive equipment manufacturer with broad exposure to semiconductor fabrication and display markets. In contrast, KLA specializes in high-margin process control and yield management solutions. This head-to-head pits scale and diversification against precision and innovation. This analysis aims to identify which corporate model delivers superior risk-adjusted returns for a balanced portfolio.
Table of contents
Companies Overview
Applied Materials and KLA Corporation stand as pivotal players in the semiconductor equipment market.
Applied Materials, Inc.: Semiconductor Manufacturing Equipment Leader
Applied Materials dominates as a global supplier of manufacturing equipment and software to semiconductor and display industries. Its core revenue stems from advanced fabrication tools like deposition, etching, and metrology systems. In 2026, the company focuses strategically on enhancing integrated solutions across semiconductor systems and global services to boost fab productivity.
KLA Corporation: Process Control and Yield Management Specialist
KLA leads in process control and yield management solutions for semiconductor manufacturing. It generates revenue through wafer inspection, metrology, and defect analysis tools critical to IC fabrication. In 2026, KLA prioritizes expanding its inspection and process-enabling technologies, aiming to optimize yield in advanced semiconductor and PCB markets.
Strategic Collision: Similarities & Divergences
Both firms target semiconductor manufacturing but differ in approach: Applied Materials emphasizes equipment innovation, while KLA focuses on precision process control. The primary battleground lies in wafer fabrication efficiency and defect management. Their investment profiles contrast—Applied Materials as a broad-cap equipment provider, KLA as a specialized yield enhancement leader.
Income Statement Comparison
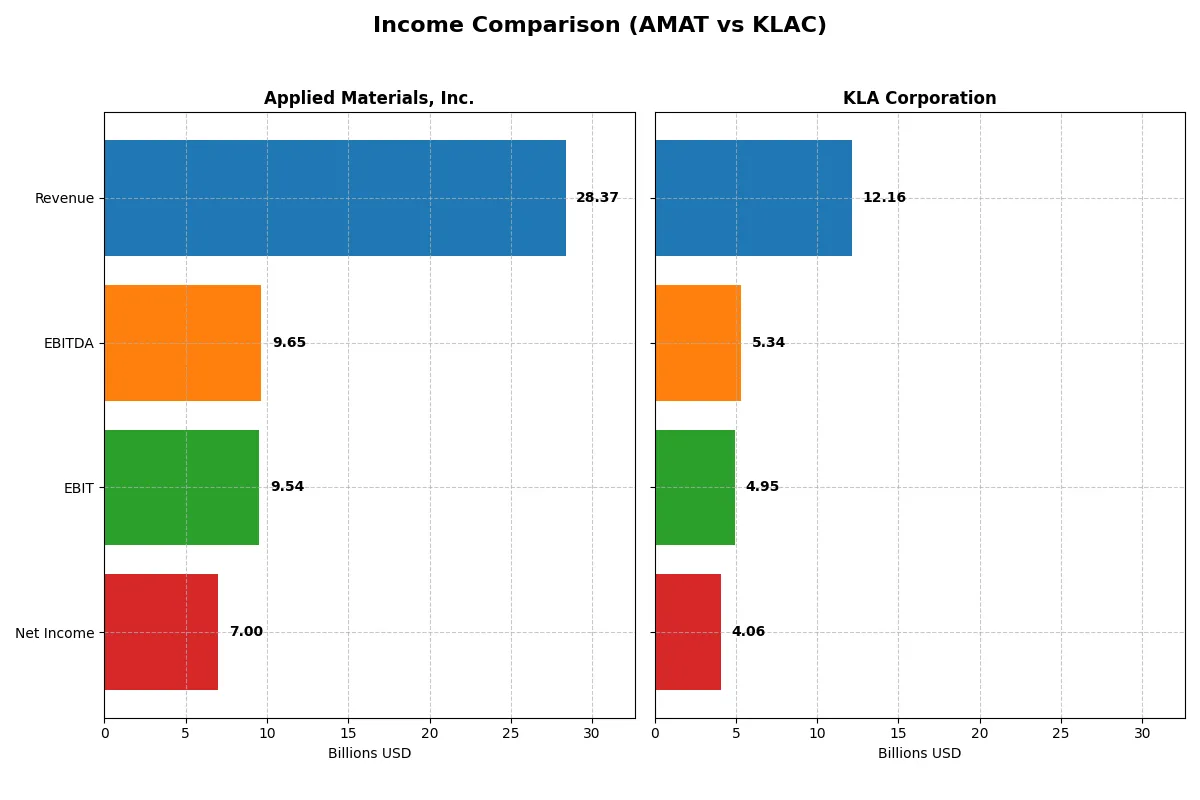
This data dissects the core profitability and scalability of both corporate engines to reveal who dominates the bottom line:
| Metric | Applied Materials, Inc. (AMAT) | KLA Corporation (KLAC) |
|---|---|---|
| Revenue | 28.4B | 12.2B |
| Cost of Revenue | 14.6B | 4.58B |
| Operating Expenses | 5.52B | 2.33B |
| Gross Profit | 13.8B | 7.58B |
| EBITDA | 9.65B | 5.34B |
| EBIT | 9.54B | 4.95B |
| Interest Expense | 269M | 302M |
| Net Income | 7.00B | 4.06B |
| EPS | 8.71 | 30.53 |
| Fiscal Year | 2025 | 2025 |
Income Statement Analysis: The Bottom-Line Duel
This income statement comparison reveals which company runs a more efficient and profitable corporate engine through their revenue and net income trends.
Applied Materials, Inc. Analysis
Applied Materials shows steady revenue growth from $23B in 2021 to $28.4B in 2025, with net income rising from $5.9B to $7B over the same period. Its gross margin hovers around 49%, and net margin remains healthy near 25%. Despite a 4.4% revenue increase in 2025, net margin slightly declined, signaling margin pressure amid rising operating expenses.
KLA Corporation Analysis
KLA’s revenue surged 76% from $6.9B in 2021 to $12.2B in 2025. Net income almost doubled, climbing from $2.1B to $4.1B. The company boasts a robust gross margin above 62% and a net margin exceeding 33%. Its 2025 performance exhibits strong momentum with double-digit growth across revenue, profit, and margins, reflecting efficient cost management and expanding profitability.
Margin Power vs. Revenue Scale
KLA dominates in margin expansion and top-line growth, reporting superior profitability and accelerated earnings growth. Applied Materials delivers solid revenue scale and stable margins but faces slight margin contraction recently. For investors, KLA’s profile offers stronger momentum and margin leverage, while Applied Materials presents consistent scale with modest margin challenges.
Financial Ratios Comparison
These vital ratios act as a diagnostic tool to expose the underlying fiscal health, valuation premiums, and capital efficiency of the companies compared below:
| Ratios | Applied Materials, Inc. (AMAT) | KLA Corporation (KLAC) |
|---|---|---|
| ROE | 34.3% | 86.6% |
| ROIC | 21.9% | 38.0% |
| P/E | 26.6 | 29.3 |
| P/B | 9.11 | 25.39 |
| Current Ratio | 2.61 | 2.62 |
| Quick Ratio | 1.87 | 1.83 |
| D/E (Debt-to-Equity) | 0.35 | 1.30 |
| Debt-to-Assets | 19.4% | 37.9% |
| Interest Coverage | 30.8 | 17.3 |
| Asset Turnover | 0.78 | 0.76 |
| Fixed Asset Turnover | 5.54 | 9.70 |
| Payout Ratio | 19.8% | 22.3% |
| Dividend Yield | 0.74% | 0.76% |
| Fiscal Year | 2025 | 2025 |
Efficiency & Valuation Duel: The Vital Signs
Ratios act as a company’s DNA, revealing hidden risks and operational excellence beneath headline figures and market noise.
Applied Materials, Inc.
Applied Materials delivers solid profitability with a 34.28% ROE and a 24.67% net margin, showcasing operational strength. Its valuation is stretched, with a P/E of 26.58 and a P/B of 9.11, above sector averages. Dividend yield is low at 0.74%, indicating modest shareholder returns amid ongoing R&D investment for growth.
KLA Corporation
KLA stands out with an impressive 86.56% ROE and a 33.41% net margin, reflecting exceptional efficiency. However, valuation appears expensive, with a P/E of 29.34 and a P/B soaring at 25.39. The 0.76% dividend yield is similarly low, while the firm focuses on reinvesting cash flow into innovation and capital expenditure.
Premium Valuation vs. Operational Safety
KLA’s striking profitability comes paired with a premium valuation and higher debt, elevating risk. Applied Materials offers a more balanced risk-reward profile with strong returns and prudent leverage. Investors seeking operational safety may prefer Applied Materials, while those favoring growth potential might consider KLA’s aggressive profile.
Which one offers the Superior Shareholder Reward?
I see Applied Materials (AMAT) offers a modest 0.78% dividend yield with a conservative 16.6% payout ratio, supporting sustainability through strong free cash flow coverage (~86%). Its buybacks appear steady but less aggressive. KLA Corporation (KLAC) yields slightly lower at 0.76%, yet pays out a higher 22.3% of earnings, balancing dividends with robust buybacks driving total returns. KLAC’s higher leverage and valuation multiples raise risk, but its aggressive capital return strategy may reward investors more over time. I conclude KLAC offers a superior total shareholder reward in 2026, driven by a more intense buyback program and balanced dividend policy.
Comparative Score Analysis: The Strategic Profile
The radar chart reveals the fundamental DNA and trade-offs of Applied Materials, Inc. and KLA Corporation, highlighting their financial strengths and valuation challenges:
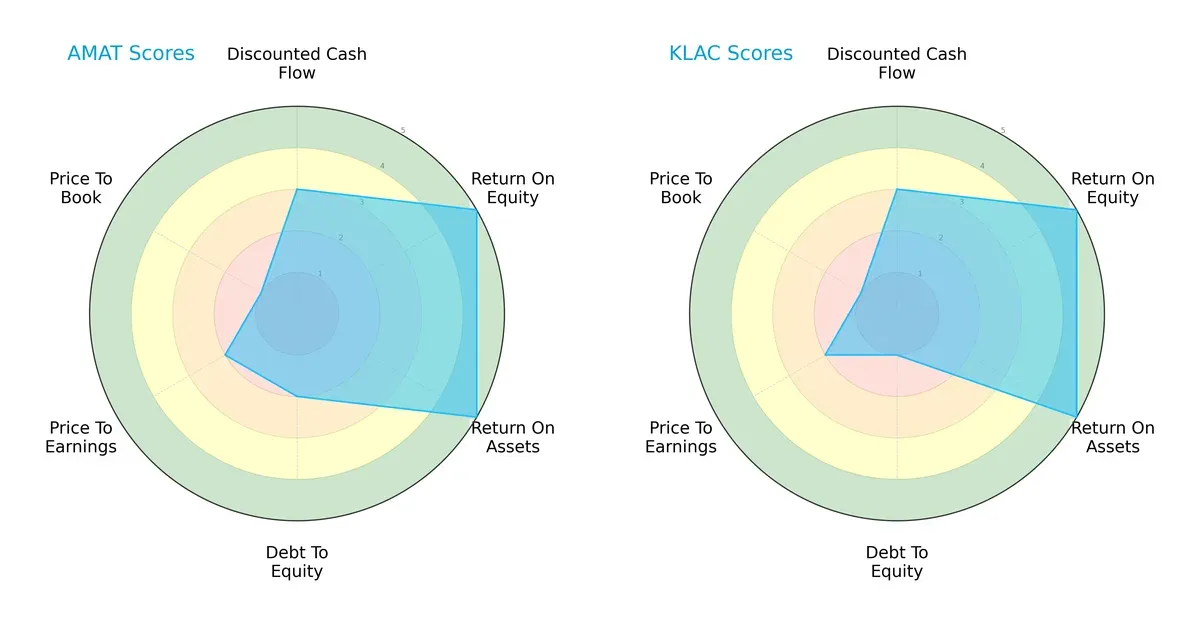
Both firms score equally on overall, DCF, ROE, and ROA metrics, demonstrating solid profitability and cash flow potential. Applied Materials shows moderate leverage risk with a debt-to-equity score of 2, while KLA’s higher debt risk at score 1 signals a weaker balance sheet. Valuation metrics (P/E and P/B) are equally unfavorable for both, pointing to potential overvaluation or market skepticism. Applied Materials presents a more balanced financial profile; KLA relies heavily on operational efficiency despite its leverage concerns.
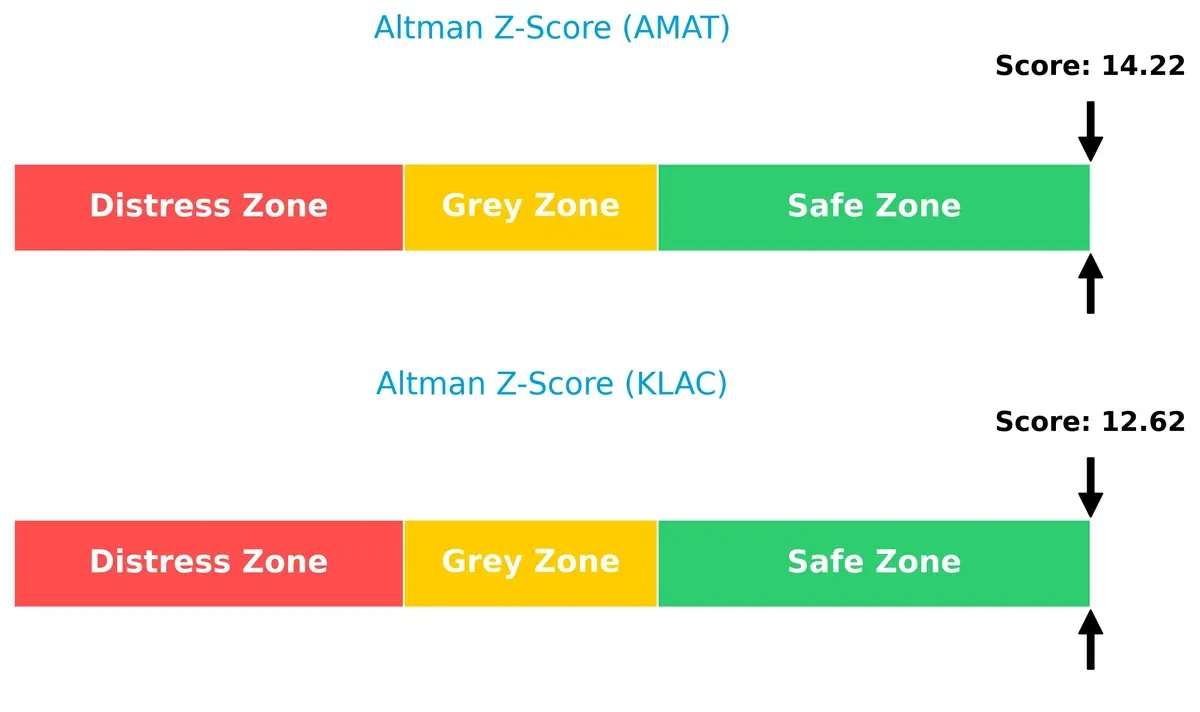
Bankruptcy Risk: Solvency Showdown
Applied Materials holds a stronger Altman Z-Score of 14.2 versus KLA’s 12.6, both safely above distress thresholds, indicating robust long-term survival odds in this cycle:
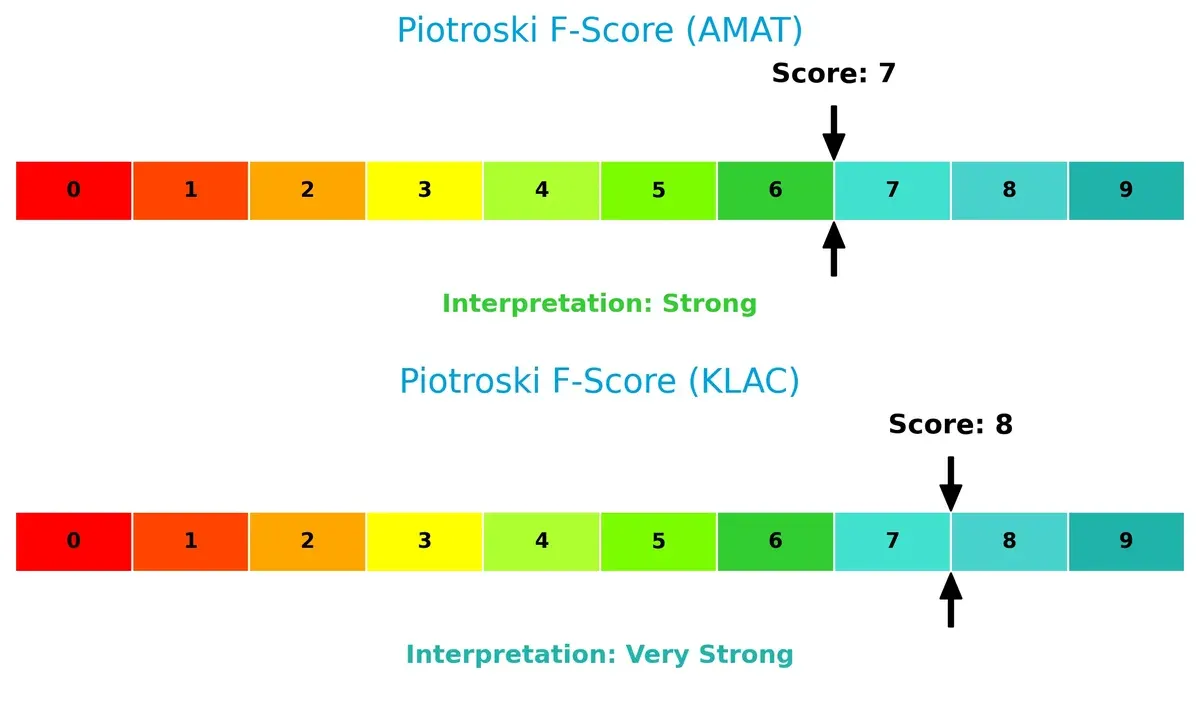
Financial Health: Quality of Operations
KLA edges out Applied Materials with a Piotroski F-Score of 8 versus 7, signaling slightly superior internal financial health. Both firms show strength, but Applied Materials’ score suggests minor red flags in operational metrics compared to KLA’s very strong standing:
How are the two companies positioned?
This section dissects AMAT and KLAC’s operational DNA by comparing their revenue distribution and internal strengths and weaknesses. The goal is to confront their economic moats to identify which business model offers the most resilient competitive advantage today.
Revenue Segmentation: The Strategic Mix
This visual comparison dissects how Applied Materials, Inc. and KLA Corporation diversify their income streams and reveals where their primary sector bets lie:
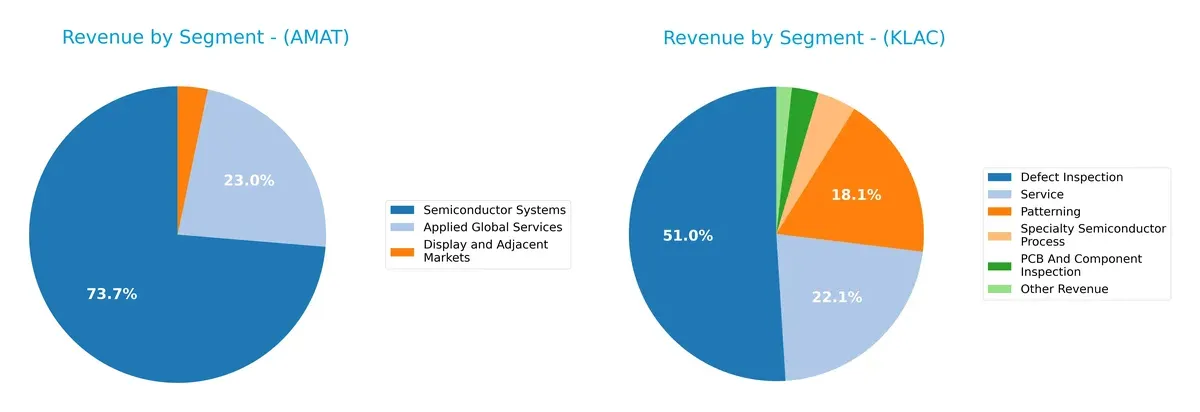
Applied Materials anchors its revenue in Semiconductor Systems at $19.9B, while Applied Global Services contributes $6.2B, showing a strong but somewhat diversified portfolio. In contrast, KLA pivots around Defect Inspection at $6.2B, with Service and Patterning adding $2.7B and $2.2B respectively, reflecting a more balanced mix. AMAT’s concentration in semiconductor equipment signals infrastructure dominance, while KLAC’s spread reduces concentration risk.
Strengths and Weaknesses Comparison
This table compares the strengths and weaknesses of Applied Materials, Inc. and KLA Corporation:
AMAT Strengths
- Diversified revenue streams across Semiconductor Systems and Global Services
- Strong profitability with 24.67% net margin and 34.28% ROE
- Solid liquidity ratios with current ratio of 2.61
- Favorable fixed asset turnover at 5.54
- Significant global presence, especially in China and Taiwan
- Stable market share in semiconductor equipment
KLAC Strengths
- Exceptional profitability with 33.41% net margin and 86.56% ROE
- High ROIC of 37.97%, indicating efficient capital allocation
- Good liquidity with current ratio at 2.62
- Strong fixed asset turnover at 9.7
- Balanced geographic exposure including North America and Asia
- Leading position in defect inspection and patterning segments
AMAT Weaknesses
- Elevated valuation multiples (PE 26.58, PB 9.11) may limit upside
- WACC higher than ROIC, suggesting some capital cost inefficiency
- Moderate asset turnover at 0.78
- Lower dividend yield at 0.74%
- Limited diversification outside semiconductor systems
- Market share pressure in display and adjacent markets
KLAC Weaknesses
- High debt-to-equity ratio at 1.3 increases financial risk
- High valuation multiples (PE 29.34, PB 25.39) raise valuation concerns
- WACC slightly unfavorable compared to ROIC
- Lower interest coverage than AMAT at 16.37
- Modest asset turnover at 0.76
- Dividend yield also low at 0.76%
Both companies demonstrate strong profitability and global reach. AMAT shows a more diversified revenue base and stronger liquidity, while KLAC excels in return metrics but carries higher financial leverage and valuation risks. These factors reflect different strategic focuses and risk profiles.
The Moat Duel: Analyzing Competitive Defensibility
A structural moat is the only true shield against profit erosion from competitors over the long term. Let’s dissect two semiconductor titans:
Applied Materials, Inc. (AMAT): Broad Technological Expertise with Margin Stability
AMAT’s moat lies in its diversified manufacturing equipment portfolio and integrated services. This manifests in solid 33.6% EBIT margins and consistent value creation despite a declining ROIC trend. New display tech and fab automation could deepen its moat but rising competition pressures persist.
KLA Corporation (KLAC): Precision Process Control with Expanding Profitability
KLAC’s moat stems from its specialized process control and yield management solutions, boasting a 40.7% EBIT margin and a strong 27.5% ROIC premium over WACC. Unlike AMAT, KLAC’s ROIC grows steadily, signaling durable competitive advantage. Expanding into PCB and advanced packaging markets fuels future growth.
Technological Breadth vs. Precision Niche: The Moat Showdown
KLAC commands a deeper, more durable moat with accelerating profitability and focused market control. AMAT’s broad tech scope creates value but faces margin pressure. KLAC is better positioned to defend and expand its market share in 2026.
Which stock offers better returns?
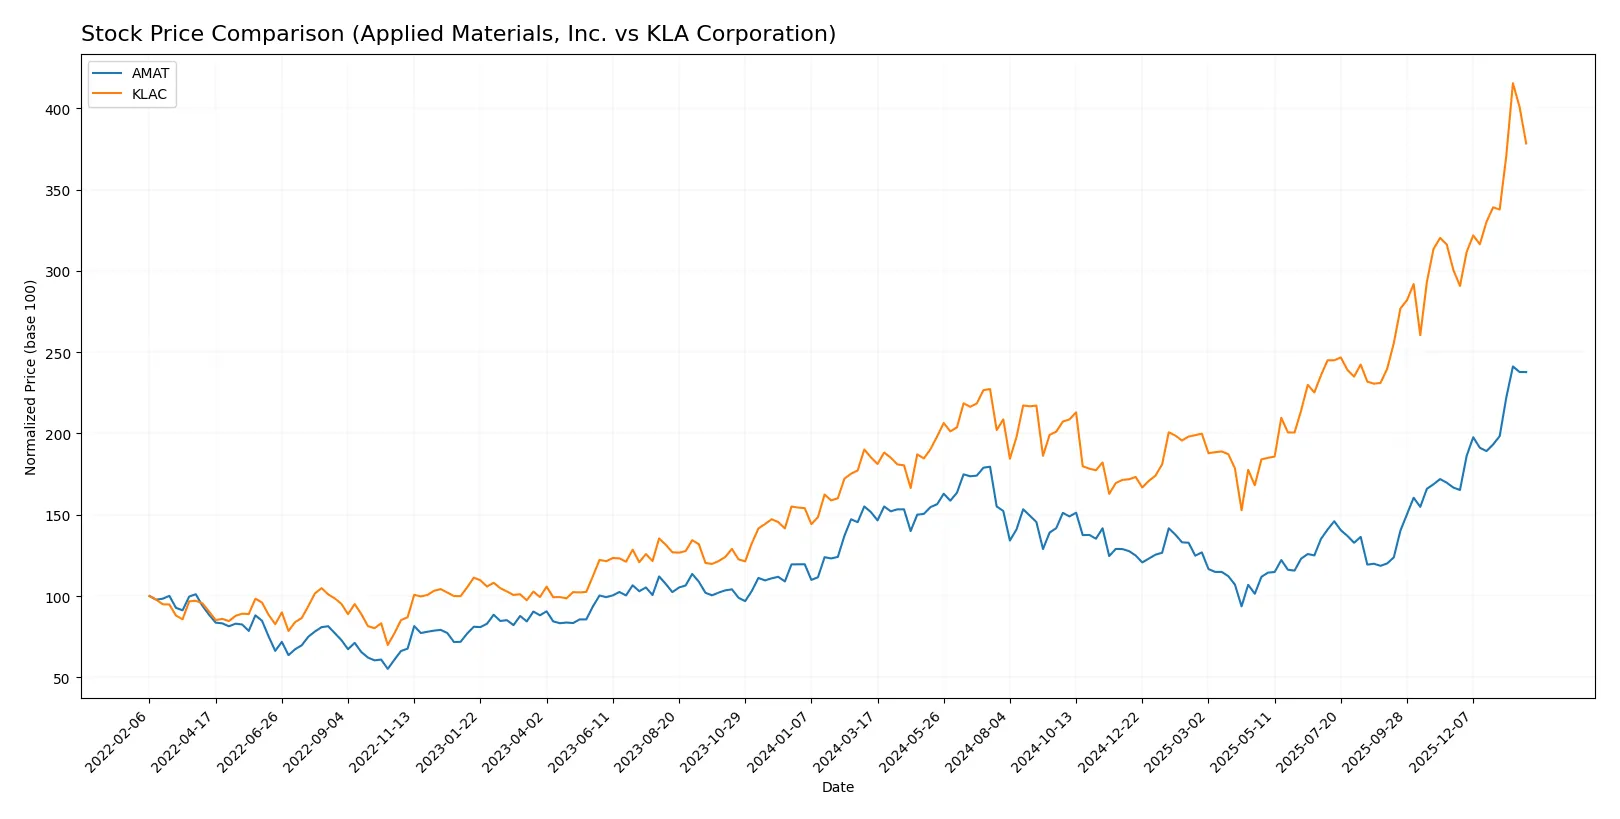
Over the past 12 months, Applied Materials and KLA Corporation both exhibit strong upward price movements with accelerating trends, reflecting robust trading dynamics and substantial gains.
Trend Comparison
Applied Materials posts a bullish trend with a 56.8% price increase over 12 months, showing acceleration and a high of 327.01. Volatility is moderate with a 38.96 standard deviation.
KLA Corporation leads with a 104.22% price rise, also accelerating, hitting a peak of 1567.82. It shows higher volatility, reflected in a 213.25 standard deviation level.
KLA’s performance surpasses Applied Materials, delivering stronger market returns despite higher volatility over the past year.
Target Prices
Analysts project solid upside for both Applied Materials and KLA Corporation based on current target consensus.
| Company | Target Low | Target High | Consensus |
|---|---|---|---|
| Applied Materials, Inc. | 273 | 400 | 347.38 |
| KLA Corporation | 1400 | 1900 | 1672.25 |
The target consensus for Applied Materials suggests a moderate 8% upside from the current 322 price. KLA’s targets imply a significant 17% potential gain from its 1428 price. Both stocks reflect bullish analyst expectations.

Don’t Let Luck Decide Your Entry Point
Optimize your entry points with our advanced ProRealTime indicators. You’ll get efficient buy signals with precise price targets for maximum performance. Start outperforming now!
How do institutions grade them?
The following tables summarize recent institutional grades for Applied Materials, Inc. and KLA Corporation:
Applied Materials, Inc. Grades
This table shows the latest grades and rating actions from key financial institutions for Applied Materials, Inc.
| Grading Company | Action | New Grade | Date |
|---|---|---|---|
| Mizuho | Upgrade | Outperform | 2026-01-28 |
| Deutsche Bank | Upgrade | Buy | 2026-01-23 |
| Needham | Maintain | Buy | 2026-01-20 |
| Keybanc | Maintain | Overweight | 2026-01-16 |
| Barclays | Upgrade | Overweight | 2026-01-15 |
| Wells Fargo | Maintain | Overweight | 2026-01-15 |
| Stifel | Maintain | Buy | 2026-01-14 |
| B of A Securities | Maintain | Buy | 2026-01-13 |
| Susquehanna | Upgrade | Positive | 2026-01-12 |
| Cantor Fitzgerald | Maintain | Overweight | 2026-01-08 |
KLA Corporation Grades
This table presents recent institutional ratings and actions for KLA Corporation.
| Grading Company | Action | New Grade | Date |
|---|---|---|---|
| RBC Capital | Maintain | Sector Perform | 2026-01-30 |
| Needham | Maintain | Buy | 2026-01-30 |
| Cantor Fitzgerald | Maintain | Overweight | 2026-01-30 |
| Wells Fargo | Maintain | Overweight | 2026-01-30 |
| Jefferies | Maintain | Buy | 2026-01-30 |
| Barclays | Maintain | Overweight | 2026-01-30 |
| Stifel | Maintain | Buy | 2026-01-30 |
| Oppenheimer | Maintain | Outperform | 2026-01-30 |
| Deutsche Bank | Maintain | Hold | 2026-01-21 |
| UBS | Maintain | Neutral | 2026-01-20 |
Which company has the best grades?
Applied Materials shows several upgrades and a consistent pattern of Buy and Overweight ratings from major firms. KLA maintains stable Buy and Overweight ratings but lacks recent upgrades. Investors may view Applied Materials as having stronger momentum in analyst confidence.
Risks specific to each company
The following categories outline the critical pressure points and systemic threats facing Applied Materials, Inc. and KLA Corporation in the 2026 market environment:
1. Market & Competition
Applied Materials, Inc.
- Faces intense competition in semiconductor equipment with a broad product range but moderate asset turnover.
KLA Corporation
- Dominates niche process control and inspection markets with higher fixed asset turnover, yet faces aggressive innovation cycles.
2. Capital Structure & Debt
Applied Materials, Inc.
- Maintains a conservative debt-to-equity ratio of 0.35, signaling financial prudence and strong interest coverage.
KLA Corporation
- Exhibits higher leverage with debt-to-equity at 1.3, increasing financial risk despite adequate interest coverage.
3. Stock Volatility
Applied Materials, Inc.
- Beta of 1.67 indicates above-market volatility, reflecting cyclicality in semiconductor capital spending.
KLA Corporation
- Lower beta at 1.44 suggests slightly less sensitivity to market swings, though still volatile in tech sector.
4. Regulatory & Legal
Applied Materials, Inc.
- Operates globally with exposure to trade policies, especially US-China tensions impacting supply chains.
KLA Corporation
- Similar global footprint with regulatory risks in semiconductor manufacturing and export controls.
5. Supply Chain & Operations
Applied Materials, Inc.
- Supply chain complexity due to diverse product lines and reliance on Asia-Pacific manufacturing hubs.
KLA Corporation
- Faces operational risk from specialized component sourcing and precision manufacturing demands.
6. ESG & Climate Transition
Applied Materials, Inc.
- Progresses in ESG initiatives but must address energy-intensive manufacturing processes.
KLA Corporation
- Strong ESG focus with innovations reducing environmental impact, yet also energy-dependent operations.
7. Geopolitical Exposure
Applied Materials, Inc.
- Significant exposure to East Asian markets, vulnerable to geopolitical tensions and tariffs.
KLA Corporation
- Also heavily exposed to geopolitical risks in semiconductor hubs, affecting supply and sales.
Which company shows a better risk-adjusted profile?
Applied Materials’ conservative capital structure and broader diversification provide a steadier risk profile. KLA’s higher leverage and niche focus heighten its risk, despite superior profitability metrics. The critical risk for Applied Materials lies in market competition and geopolitical exposure. For KLA, leverage and stock volatility pose the largest threats. Recent ratio data confirm KLA’s debt-to-equity ratio at 1.3, underscoring elevated financial risk. Overall, Applied Materials presents a more balanced risk-adjusted investment proposition in 2026.
Final Verdict: Which stock to choose?
Applied Materials, Inc. (AMAT) wields unmatched operational efficiency, consistently converting invested capital into strong returns despite a slight erosion in profitability trends. Its disciplined balance sheet and robust cash flow generation make it a solid candidate for portfolios seeking steady growth with moderate risk. A point of vigilance remains its valuation premium, which could temper near-term upside. AMAT suits investors with an appetite for measured, long-term expansion.
KLA Corporation (KLAC) commands a durable competitive moat, marked by a soaring and growing ROIC that signals a widening economic advantage. Its rapid revenue and earnings growth underpin a growth-at-a-reasonable-price (GARP) profile, though elevated leverage demands careful risk consideration. KLAC offers stronger expansion potential and suits investors focused on dynamic growth with tolerance for balance sheet risk.
If you prioritize consistent capital efficiency and a more conservative risk profile, AMAT is the compelling choice due to its operational discipline and stable cash flows. However, if you seek accelerated growth backed by an expanding moat and can accommodate higher financial leverage, KLAC offers superior growth momentum and profitability expansion. Both stocks show promise, but aligning choice with your risk tolerance and investment horizon is key.
Disclaimer: Investment carries a risk of loss of initial capital. The past performance is not a reliable indicator of future results. Be sure to understand risks before making an investment decision.
Go Further
I encourage you to read the complete analyses of Applied Materials, Inc. and KLA Corporation to enhance your investment decisions: