Applied Materials, Inc. (AMAT) and IPG Photonics Corporation (IPGP) are two prominent players in the semiconductor industry, each driving innovation in manufacturing equipment and laser technologies. While AMAT focuses on semiconductor fabrication tools and display technologies, IPGP specializes in high-performance fiber lasers for materials processing. This comparison highlights their market positions and growth strategies to help you decide which company offers the most compelling investment opportunity. Let’s explore which stock deserves a place in your portfolio.
Table of contents
Companies Overview
I will begin the comparison between Applied Materials, Inc. and IPG Photonics Corporation by providing an overview of these two companies and their main differences.
Applied Materials, Inc. Overview
Applied Materials, Inc. provides manufacturing equipment, services, and software primarily to the semiconductor, display, and related industries. It operates through three segments: Semiconductor Systems, Applied Global Services, and Display and Adjacent Markets. The company focuses on developing and supplying advanced technologies and equipment for semiconductor fabrication and display manufacturing. Founded in 1967, it is headquartered in Santa Clara, California, and has a market cap of approximately 259B USD.
IPG Photonics Corporation Overview
IPG Photonics Corporation specializes in developing, manufacturing, and selling high-performance fiber lasers, amplifiers, and diode lasers for materials processing and communications applications. Its products include fiber lasers, amplifiers, integrated laser systems, and optical transceivers, serving a global customer base of OEMs, system integrators, and end users. Founded in 1990 and headquartered in Marlborough, Massachusetts, IPG operates with a market cap near 3.3B USD.
Key similarities and differences
Both companies operate within the semiconductor and technology sector but focus on different niches. Applied Materials concentrates on manufacturing equipment and solutions for semiconductor chip fabrication and display technology, while IPG Photonics specializes in fiber laser technology for materials processing and communications. Applied Materials has a significantly larger market capitalization and employee base, reflecting its broader product portfolio and global reach compared to IPG Photonics’ more specialized laser offerings.
Income Statement Comparison
The table below compares key income statement metrics for Applied Materials, Inc. and IPG Photonics Corporation, highlighting their financial performance for the most recent fiscal year.
| Metric | Applied Materials, Inc. (AMAT) | IPG Photonics Corporation (IPGP) |
|---|---|---|
| Market Cap | 259.2B | 3.34B |
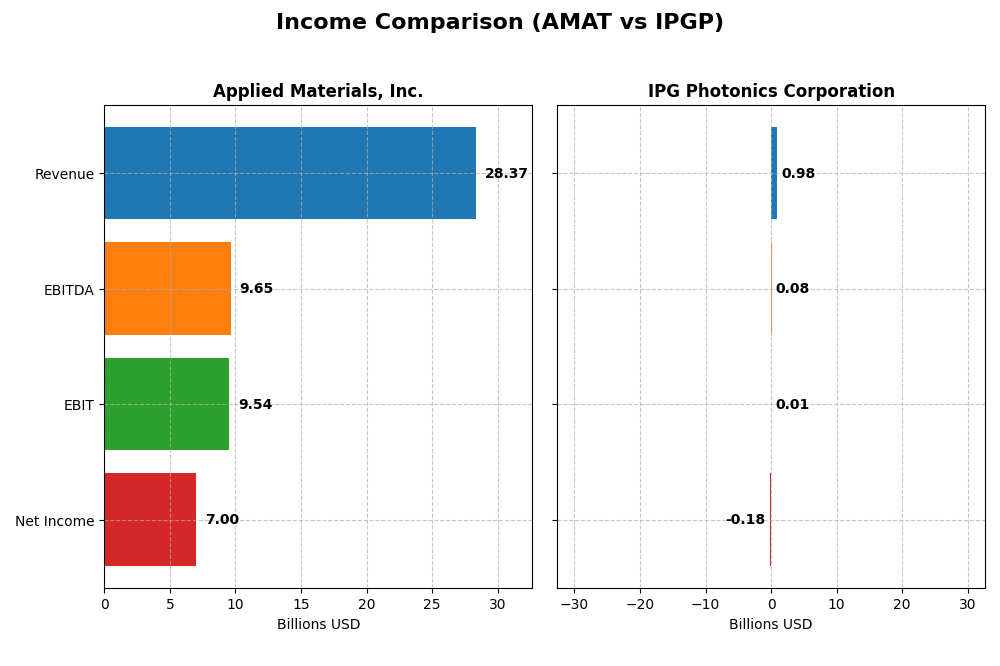
| Revenue | 28.37B | 977.1M |
| EBITDA | 9.65B | 75.9M |
| EBIT | 9.54B | 14.5M |
| Net Income | 7.00B | -181.5M |
| EPS | 8.71 | -4.09 |
| Fiscal Year | 2025 | 2024 |
Income Statement Interpretations
Applied Materials, Inc.
Applied Materials displayed steady revenue growth from 23B in 2021 to 28.4B in 2025, with net income rising from 5.9B to 7B over the same period. Margins remained robust, notably a gross margin near 49% and an EBIT margin above 33%. In 2025, revenue growth slowed to 4.4%, but gross profit and EBIT margins improved, supporting solid profitability despite a slight net margin decline.
IPG Photonics Corporation
IPG Photonics experienced declining revenue from 1.46B in 2021 to 977M in 2024, with net income turning negative to -182M in 2024 from 278M in 2021. Gross margin stayed favorable at 34.6%, but net margin suffered significantly, reflecting operating losses and margin compression. The latest year showed sharp decreases in revenue, profits, and EPS, highlighting operational and profitability challenges.
Which one has the stronger fundamentals?
Applied Materials demonstrates stronger fundamentals with consistent revenue and net income growth, high gross and EBIT margins, and overall favorable income statement trends. In contrast, IPG Photonics faces unfavorable revenue and earnings declines, negative net margins, and deteriorating profitability metrics, indicating weaker financial health over the analyzed period.
Financial Ratios Comparison
The table below presents the most recent key financial ratios for Applied Materials, Inc. (AMAT) and IPG Photonics Corporation (IPGP) based on their fiscal year 2025 and 2024 data respectively, providing a snapshot of their financial health and performance.
| Ratios | Applied Materials, Inc. (2025) | IPG Photonics Corporation (2024) |
|---|---|---|
| ROE | 34.3% | -8.97% |
| ROIC | 21.96% | -9.97% |
| P/E | 26.58 | -17.76 |
| P/B | 9.11 | 1.59 |
| Current Ratio | 2.61 | 6.98 |
| Quick Ratio | 1.87 | 5.59 |
| D/E (Debt to Equity) | 0.35 | 0.009 |
| Debt-to-Assets | 19.4% | 0.78% |
| Interest Coverage | 30.81 | 0 |
| Asset Turnover | 0.78 | 0.43 |
| Fixed Asset Turnover | 5.54 | 1.66 |
| Payout ratio | 19.8% | 0% |
| Dividend yield | 0.74% | 0% |
Interpretation of the Ratios
Applied Materials, Inc.
Applied Materials displays a strong profile with 64.29% of its ratios favorable, including a robust return on equity of 34.28% and a solid current ratio of 2.61, indicating good liquidity. Concerns arise from a high price-to-book ratio of 9.11 and a relatively low dividend yield of 0.74%, which is considered unfavorable. The company pays dividends with a low yield and moderate payout, supported by ample free cash flow, suggesting cautious distribution and buyback policies.
IPG Photonics Corporation
IPG Photonics has a mixed ratio profile with 35.71% favorable and 42.86% unfavorable ratios. The company shows negative net margin and returns, reflecting recent profitability challenges. Liquidity is strong, evidenced by a high quick ratio of 5.59 and minimal debt levels. IPG does not pay dividends, likely due to negative net income and a focus on reinvestment and R&D, consistent with its growth and strategic priorities.
Which one has the best ratios?
Applied Materials clearly holds the advantage with predominantly favorable ratios, strong profitability, and prudent financial management. In contrast, IPG Photonics faces profitability headwinds and a less favorable overall ratio profile, despite maintaining strong liquidity and low leverage. The comparative analysis highlights Applied Materials as the company with the more robust financial metrics.
Strategic Positioning
This section compares the strategic positioning of Applied Materials, Inc. and IPG Photonics Corporation in terms of market position, key segments, and exposure to technological disruption:
Applied Materials, Inc.
- Leading semiconductor equipment provider facing strong competition in global markets.
- Diversified segments: Semiconductor Systems, Global Services, and Display technologies driving revenues.
- Operates in mature and evolving technologies with varied manufacturing equipment and software.
IPG Photonics Corporation
- Niche player in high-performance fiber lasers within the semiconductor industry.
- Revenue mainly from laser products for materials processing and communications.
- Focused on fiber laser technology and integrated laser systems with specialized applications.
Applied Materials, Inc. vs IPG Photonics Corporation Positioning
Applied Materials has a diversified business model across multiple semiconductor and display segments providing varied revenue streams. IPG Photonics concentrates on fiber laser technologies, offering specialized products primarily for materials processing and communications, reflecting a more focused strategic approach.
Which has the best competitive advantage?
Applied Materials shows a slightly favorable moat with value creation despite declining profitability, while IPG Photonics has a very unfavorable moat, shedding value with decreasing returns, indicating Applied Materials currently holds a stronger competitive advantage.
Stock Comparison
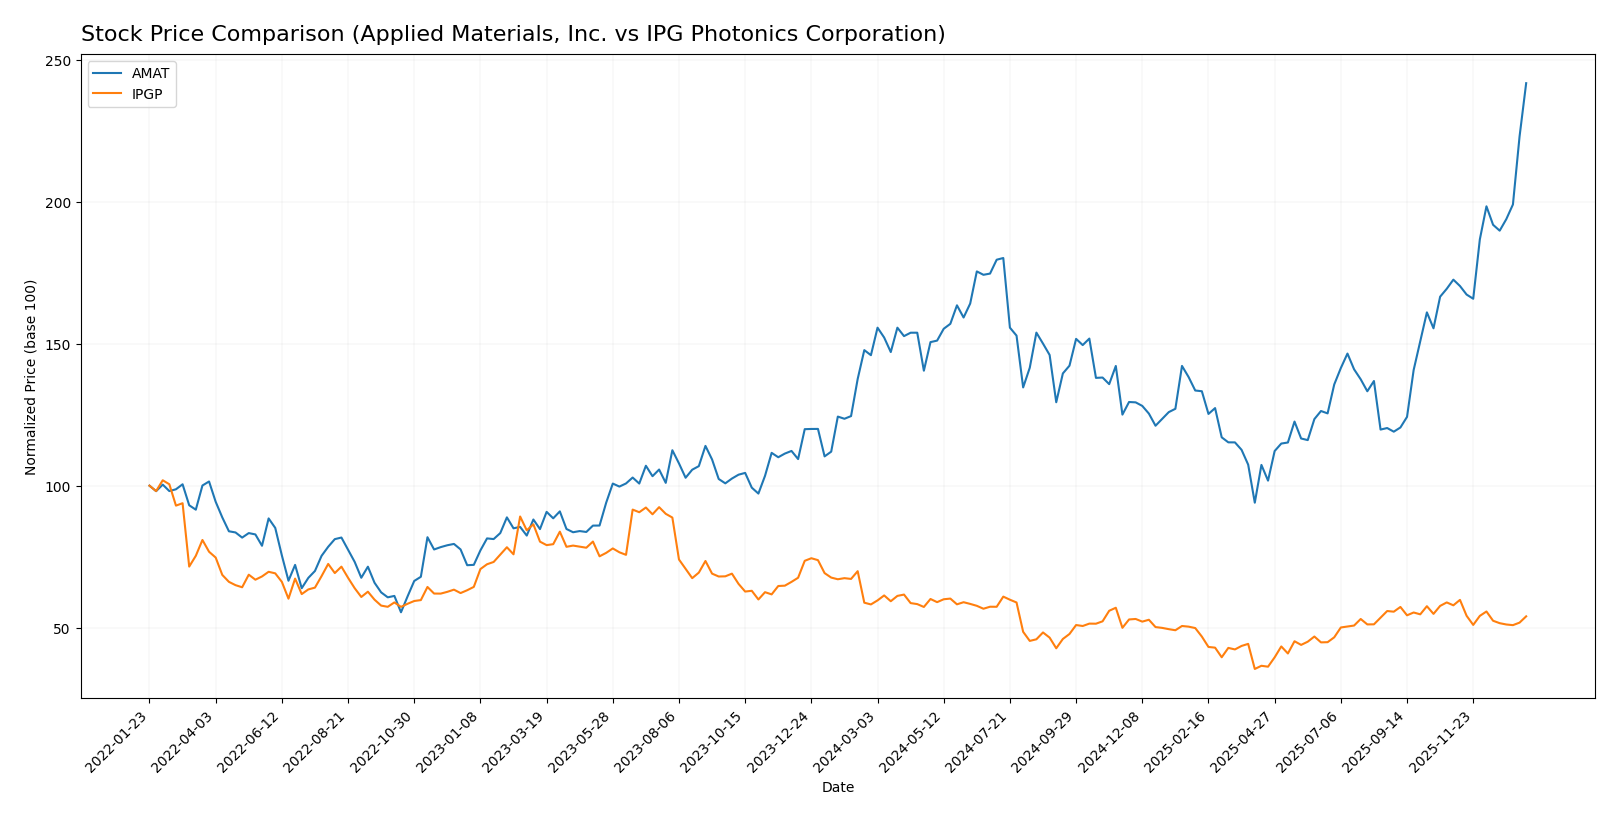
The stock price movements over the past year reveal significant divergence, with Applied Materials, Inc. showing strong upward momentum contrasted by a declining trend for IPG Photonics Corporation.
Trend Analysis
Applied Materials, Inc. exhibited a bullish trend over the past 12 months, with a 65.65% price increase and accelerating momentum. The stock reached a high of 326.6 and showed substantial volatility with a standard deviation of 34.7.
IPG Photonics Corporation experienced a bearish trend over the same period, declining by 7.22% with deceleration in its downward movement. Its price fluctuated less, with a standard deviation of 9.27 and a high of 90.69.
Comparing both companies, Applied Materials outperformed IPG Photonics clearly, delivering the highest market return with strong price appreciation and increased trading volumes.
Target Prices
Analysts present a clear consensus on target prices for Applied Materials, Inc. and IPG Photonics Corporation.
| Company | Target High | Target Low | Consensus |
|---|---|---|---|
| Applied Materials, Inc. | 400 | 273 | 323.43 |
| IPG Photonics Corporation | 96 | 92 | 94 |
The target consensus for Applied Materials suggests moderate upside potential compared to the current price of 325.37 USD, while IPG Photonics shows a target range slightly above its current price of 79.23 USD, indicating cautious optimism among analysts.
Analyst Opinions Comparison
This section compares analysts’ ratings and grades for Applied Materials, Inc. (AMAT) and IPG Photonics Corporation (IPGP):
Rating Comparison
AMAT Rating
- Rating: B+, considered Very Favorable by analysts.
- Discounted Cash Flow Score: 3, indicating a Moderate valuation based on cash flow.
- ROE Score: 5, a Very Favorable measure of profit generation efficiency.
- ROA Score: 5, Very Favorable for asset utilization effectiveness.
- Debt To Equity Score: 2, Moderate financial risk with some debt reliance.
- Overall Score: 3, a Moderate summary of financial standing.
IPGP Rating
- Rating: B+, also rated Very Favorable by analysts.
- Discounted Cash Flow Score: 4, showing a Favorable valuation on cash flow.
- ROE Score: 2, a Moderate indicator of profit generation from equity.
- ROA Score: 3, Moderate effectiveness in asset utilization.
- Debt To Equity Score: 4, Favorable financial stability with lower debt risk.
- Overall Score: 3, also a Moderate overall financial assessment.
Which one is the best rated?
Both AMAT and IPGP share the same overall rating of B+ and an identical overall score of 3. AMAT excels in return on equity and assets, while IPGP scores better on discounted cash flow and debt-to-equity, reflecting different strengths within a similar rating level.
Scores Comparison
The following table presents a comparison of the Altman Z-Score and Piotroski Score for Applied Materials, Inc. and IPG Photonics Corporation:
AMAT Scores
- Altman Z-Score: 13.45, indicating a safe zone with low risk.
- Piotroski Score: 7, reflecting strong financial health.
IPGP Scores
- Altman Z-Score: 9.65, indicating a safe zone with low risk.
- Piotroski Score: 7, reflecting strong financial health.
Which company has the best scores?
Both AMAT and IPGP show strong financial health with identical Piotroski Scores of 7. AMAT has a higher Altman Z-Score of 13.45 compared to IPGP’s 9.65, suggesting a relatively lower bankruptcy risk for AMAT based on the provided data.
Grades Comparison
Here is a comparison of the recent grades assigned to the two companies by reputable grading firms:
Applied Materials, Inc. Grades
This table summarizes recent grades from recognized financial institutions for Applied Materials, Inc.
| Grading Company | Action | New Grade | Date |
|---|---|---|---|
| B of A Securities | Maintain | Buy | 2026-01-13 |
| Susquehanna | Upgrade | Positive | 2026-01-12 |
| Cantor Fitzgerald | Maintain | Overweight | 2026-01-08 |
| B. Riley Securities | Maintain | Buy | 2025-12-18 |
| Mizuho | Maintain | Neutral | 2025-12-17 |
| Wells Fargo | Maintain | Overweight | 2025-12-15 |
| Jefferies | Maintain | Buy | 2025-12-15 |
| Keybanc | Maintain | Overweight | 2025-12-02 |
| UBS | Upgrade | Buy | 2025-11-25 |
| B. Riley Securities | Maintain | Buy | 2025-11-14 |
Applied Materials shows a consistent pattern of Buy and Overweight ratings, with recent upgrades indicating positive analyst sentiment.
IPG Photonics Corporation Grades
This table summarizes recent grades from recognized financial institutions for IPG Photonics Corporation.
| Grading Company | Action | New Grade | Date |
|---|---|---|---|
| Citigroup | Upgrade | Buy | 2025-11-05 |
| Bernstein | Upgrade | Outperform | 2025-08-07 |
| Raymond James | Maintain | Strong Buy | 2025-05-07 |
| CL King | Upgrade | Buy | 2025-03-18 |
| Citigroup | Maintain | Sell | 2025-02-18 |
| Stifel | Maintain | Buy | 2025-02-12 |
| Needham | Maintain | Hold | 2025-02-12 |
| Seaport Global | Downgrade | Neutral | 2024-08-01 |
| Stifel | Maintain | Buy | 2024-07-31 |
| Raymond James | Maintain | Strong Buy | 2024-07-31 |
IPG Photonics exhibits a more mixed set of ratings, ranging from Sell to Strong Buy, reflecting varied analyst views and some recent upgrades.
Which company has the best grades?
Applied Materials has received more consistent Buy and Overweight grades, whereas IPG Photonics shows a wider range including negative ratings. This consistency may influence investor confidence differently between the two firms.
Strengths and Weaknesses
Below is a comparison table highlighting the key strengths and weaknesses of Applied Materials, Inc. (AMAT) and IPG Photonics Corporation (IPGP) based on their latest financial and operational data.
| Criterion | Applied Materials, Inc. (AMAT) | IPG Photonics Corporation (IPGP) |
|---|---|---|
| Diversification | Highly diversified with revenue from Semiconductor Systems (19.9B), Applied Global Services (6.2B), and Display & Adjacent Markets (885M) | More concentrated in laser systems with main segments like High Power CW Lasers (333M) and Amplifiers & Laser Systems (247M) |
| Profitability | Strong profitability: Net margin 24.7%, ROIC 21.96%, ROE 34.28% | Negative profitability: Net margin -18.6%, ROIC -9.97%, ROE -8.97% |
| Innovation | Maintains favorable innovation with solid R&D in semiconductor tech | Innovation challenged by sharply declining ROIC and shrinking profitability |
| Global presence | Large global footprint serving semiconductor and display markets worldwide | More niche market focus, primarily in specialized laser applications |
| Market Share | Leading market share in semiconductor equipment sector | Smaller market share, facing value erosion and competitive pressure |
In summary, AMAT presents a more favorable investment profile with diversified revenue streams, strong profitability, and a solid market position, albeit with some declining profitability trends. Conversely, IPGP struggles with negative profitability and value destruction, warranting cautious risk management.
Risk Analysis
Below is a comparison of key risk factors for Applied Materials, Inc. (AMAT) and IPG Photonics Corporation (IPGP) as of the most recent fiscal years:
| Metric | Applied Materials, Inc. (AMAT) | IPG Photonics Corporation (IPGP) |
|---|---|---|
| Market Risk | High beta (1.67) indicating higher volatility | Moderate beta (1.02), lower volatility |
| Debt Level | Moderate leverage (D/E ratio 0.35), manageable debt | Very low leverage (D/E ratio 0.01), minimal debt risk |
| Regulatory Risk | Exposure to global semiconductor regulations, especially US-China trade tensions | Moderate regulatory exposure in laser and communications markets |
| Operational Risk | Complexity of global supply chains and advanced tech manufacturing | Dependence on specialized fiber laser tech and supply chain constraints |
| Environmental Risk | Moderate, with semiconductor manufacturing environmental impacts | Lower, but some risks from manufacturing and laser materials |
| Geopolitical Risk | Significant, given operations in Asia-Pacific and related trade issues | Moderate, mainly US-based but with global customers |
The most impactful and likely risks for AMAT stem from geopolitical tensions affecting supply chains and regulatory changes in semiconductor markets. For IPGP, operational risks from niche technology reliance and supply constraints are critical, while financial risks remain low due to minimal debt. Both companies maintain a safe financial zone, but AMAT’s higher market volatility and geopolitical exposure require close monitoring.
Which Stock to Choose?
Applied Materials, Inc. (AMAT) shows a favorable income evolution with 23% revenue growth over five years and strong profitability metrics, including a 34.3% ROE and 24.7% net margin. Its debt levels are low and manageable, supported by a solid rating of B+ and a slightly favorable moat status.
IPG Photonics Corporation (IPGP) faces an unfavorable income evolution marked by declining revenues and negative net margins. Financial ratios reflect challenges with negative returns on equity and invested capital, despite low debt ratios. The company holds a B+ rating but exhibits a very unfavorable moat status, signaling value destruction.
Investors prioritizing quality and value creation might find AMAT’s strong profitability and favorable financial ratios more appealing, while those tolerant to higher risk and seeking potential turnaround opportunities could consider IPGP, given its lower valuation metrics despite weak income performance.
Disclaimer: Investment carries a risk of loss of initial capital. The past performance is not a reliable indicator of future results. Be sure to understand risks before making an investment decision.
Go Further
I encourage you to read the complete analyses of Applied Materials, Inc. and IPG Photonics Corporation to enhance your investment decisions: