Home > Comparison > Technology > AMAT vs INTC
The strategic rivalry between Applied Materials, Inc. and Intel Corporation shapes the semiconductor industry’s future. Applied Materials excels as a capital-intensive equipment manufacturer, delivering critical fabrication tools and services. Intel operates as an integrated chip designer and producer, focusing on platform products and adjacent technologies. This analysis pits manufacturing scale against technological integration, aiming to identify which trajectory offers superior risk-adjusted returns for a diversified portfolio amid evolving market dynamics.
Table of contents
Companies Overview
Applied Materials and Intel are pivotal players shaping the semiconductor industry’s evolution and innovation.
Applied Materials, Inc.: Semiconductor Equipment Innovator
Applied Materials leads as a provider of manufacturing equipment and services crucial for semiconductor fabrication. Its core revenue derives from advanced tools like epitaxy, ion implantation, and chemical vapor deposition, supporting chip production globally. In 2026, the company focuses strategically on enhancing fab productivity through integrated services and expanding into display technologies like OLEDs.
Intel Corporation: Chip Design and Manufacturing Giant
Intel dominates as a designer and manufacturer of CPUs, chipsets, and system-on-chip solutions serving cloud, enterprise, and embedded markets. Its revenue engine spans platform products and adjacent technologies including AI-driven compute platforms and autonomous driving solutions. The 2026 strategy centers on workload-optimized platforms and AI partnerships to reinforce its leadership across diversified tech verticals.
Strategic Collision: Similarities & Divergences
Both companies thrive within semiconductors but diverge sharply in approach: Applied Materials operates a capital equipment-focused model enhancing production infrastructure, while Intel pursues an integrated chip design and manufacturing ecosystem. Their battleground lies in semiconductor innovation and fab efficiency. Investors face distinct profiles—Applied Materials with steady equipment-driven growth, Intel with broader tech exposure and higher operational complexity.
Income Statement Comparison
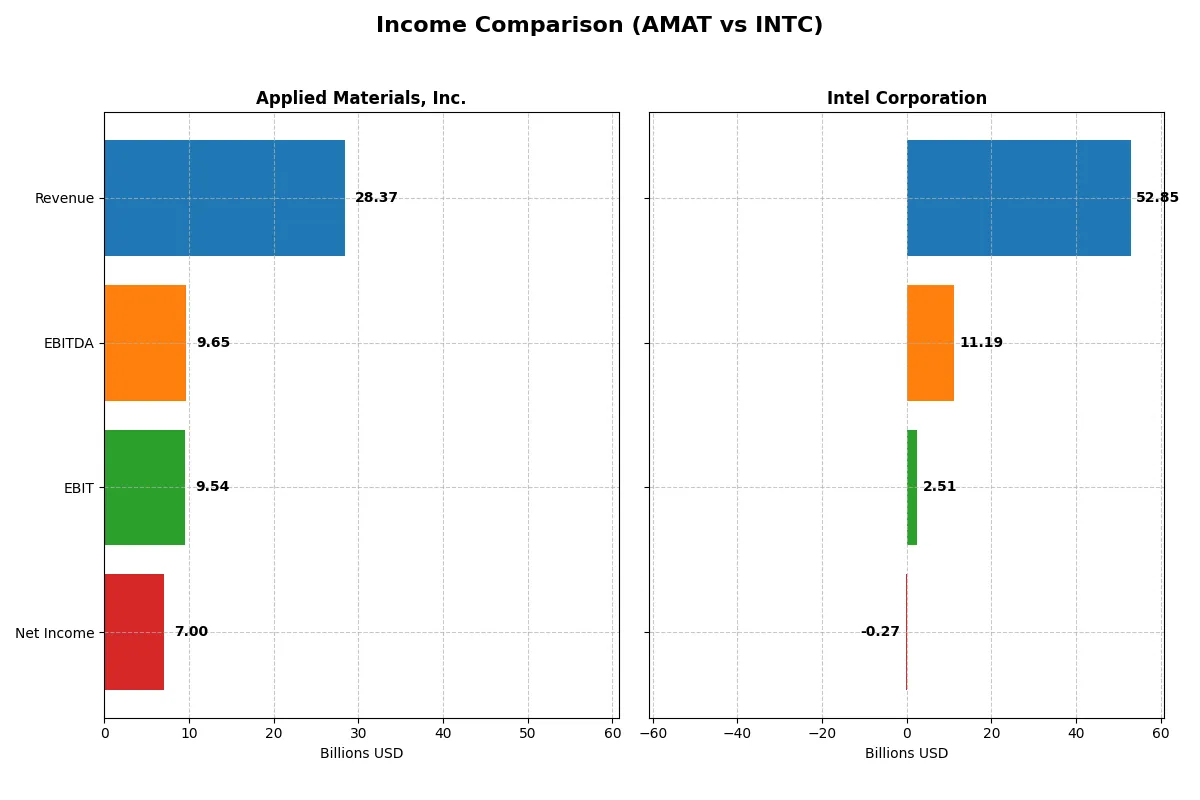
The following data dissects the core profitability and scalability of both corporate engines to reveal who dominates the bottom line:
| Metric | Applied Materials, Inc. (AMAT) | Intel Corporation (INTC) |
|---|---|---|
| Revenue | 28.4B | 52.9B |
| Cost of Revenue | 14.6B | 34.4B |
| Operating Expenses | 5.52B | 20.6B |
| Gross Profit | 13.8B | 18.5B |
| EBITDA | 9.65B | 11.2B |
| EBIT | 9.54B | 2.51B |
| Interest Expense | 269M | 953M |
| Net Income | 7.00B | -267M |
| EPS | 8.71 | -0.082 |
| Fiscal Year | 2025 | 2025 |
Income Statement Analysis: The Bottom-Line Duel
This income statement comparison reveals which company operates with superior efficiency and profit generation in a challenging market landscape.
Applied Materials, Inc. Analysis
Applied Materials steadily grows revenue from 23B in 2021 to 28.4B in 2025, with net income rising from 5.9B to 7.0B. Its gross margin remains robust near 49%, while net margin holds a favorable 24.7%. In 2025, AMAT sustains strong operating leverage, improving EBIT by 13.6%, signaling excellent cost control and momentum.
Intel Corporation Analysis
Intel’s revenue declines from 79B in 2021 to 52.9B in 2025, with net income swinging from a 19.9B profit to a 267M loss. Gross margin compresses to 35%, and net margin turns negative at -0.5%. The 2025 rebound in EBIT and net margin growth indicates operational recovery, yet losses highlight persistent structural challenges.
Margin Strength vs. Scale Erosion
Applied Materials exhibits consistent margin expansion and profit growth, reflecting disciplined capital allocation and operational efficiency. Intel’s scale advantage erodes amid declining revenues and negative net income, despite some recent margin improvements. For investors, AMAT’s stable profitability profile offers a clearer path to sustainable returns compared to Intel’s volatile recovery.
Financial Ratios Comparison
These vital ratios act as a diagnostic tool to expose the underlying fiscal health, valuation premiums, and capital efficiency of the companies analyzed:
| Ratios | Applied Materials, Inc. (AMAT) | Intel Corporation (INTC) |
|---|---|---|
| ROE | 34.3% | -0.2% |
| ROIC | 21.9% | -0.02% |
| P/E | 26.6 | -658.4 |
| P/B | 9.11 | 1.54 |
| Current Ratio | 2.61 | 2.02 |
| Quick Ratio | 1.87 | 1.65 |
| D/E | 0.35 | 0.41 |
| Debt-to-Assets | 19.4% | 22.0% |
| Interest Coverage | 30.8 | -2.2 |
| Asset Turnover | 0.78 | 0.25 |
| Fixed Asset Turnover | 5.54 | 0.50 |
| Payout Ratio | 19.8% | 0% |
| Dividend Yield | 0.74% | 0% |
| Fiscal Year | 2025 | 2025 |
Efficiency & Valuation Duel: The Vital Signs
Ratios act as the company’s DNA, unveiling hidden risks and operational excellence essential for understanding intrinsic value and stability.
Applied Materials, Inc.
Applied Materials boasts a strong ROE of 34.3% and a robust net margin of 24.7%, confirming excellent profitability. However, its P/E of 26.6 and P/B of 9.1 suggest a stretched valuation. The company maintains shareholder value through a modest 0.74% dividend yield while reinvesting heavily in R&D, fueling growth and sustaining its competitive edge.
Intel Corporation
Intel shows negative profitability with a ROE of -0.23% and a net margin of -0.51%, reflecting operational challenges. The P/E is negative, complicating traditional valuation, while the P/B at 1.54 remains neutral. Intel pays no dividends, instead directing resources toward aggressive R&D, indicated by a high 26.1% R&D-to-revenue ratio, aiming for a turnaround amid significant leverage and operational inefficiencies.
Premium Valuation vs. Operational Struggles
Applied Materials offers a favorable profitability profile but at a premium valuation, reflecting market confidence in its operational strength. Intel’s metrics reveal risks and negative returns, despite a lower valuation multiple. Investors seeking stability and growth may prefer Applied Materials, while those with a higher risk tolerance might consider Intel’s turnaround potential.
Which one offers the Superior Shareholder Reward?
I observe that Applied Materials (AMAT) pays a modest dividend yield around 0.7% with a conservative payout ratio near 20%. Its robust free cash flow coverage and regular buybacks amplify total returns sustainably. Intel (INTC) suspends dividends recently, reflecting its negative free cash flow and operating struggles, while ramping capex and restructuring. AMAT’s balanced dividend and buyback strategy offers more durable shareholder reward in 2026.
Comparative Score Analysis: The Strategic Profile
The radar chart reveals the fundamental DNA and trade-offs of Applied Materials, Inc. and Intel Corporation across key financial metrics:
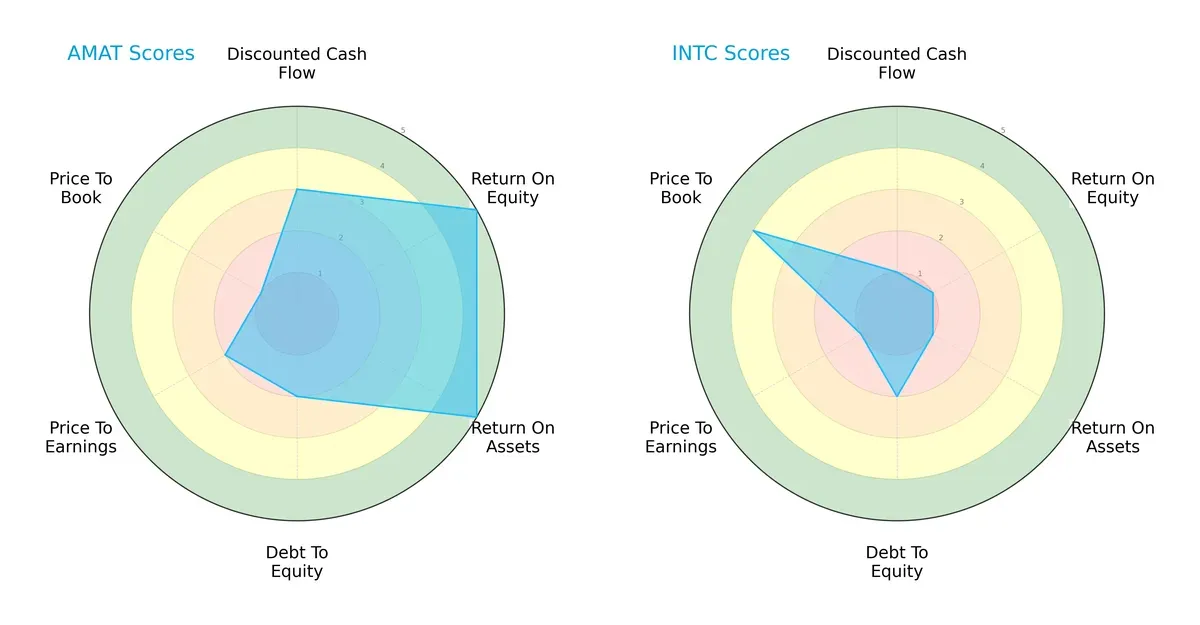
Applied Materials displays strength in profitability with very favorable ROE and ROA scores (5 each), while maintaining moderate DCF and debt-to-equity scores. Intel leans heavily on a favorable price-to-book score (4) but suffers very unfavorable scores in DCF, ROE, ROA, and P/E, indicating weaker operational efficiency and valuation concerns. Applied Materials shows a more balanced profile, leveraging operational excellence, whereas Intel relies mainly on valuation attractiveness.
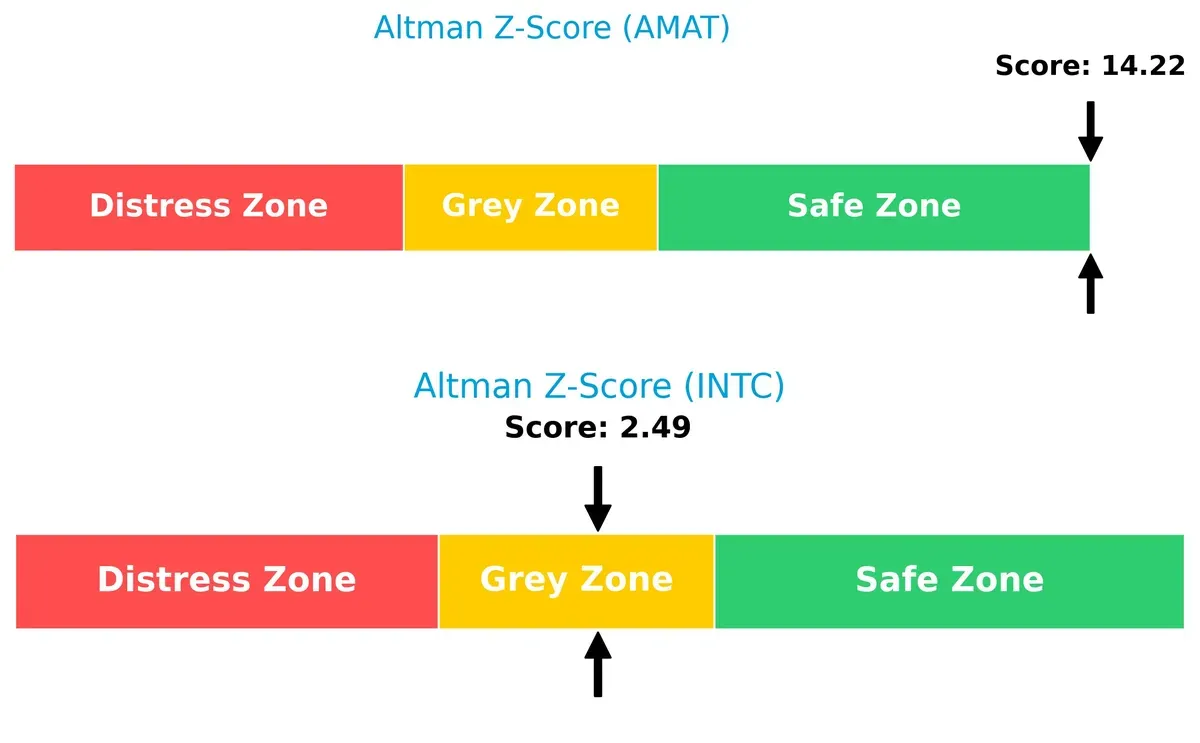
Bankruptcy Risk: Solvency Showdown
Applied Materials’ Altman Z-Score of 14.2 places it securely in the safe zone, signaling robust long-term solvency. Intel’s 2.49 score positions it in the grey zone, indicating moderate financial risk in the current economic cycle:
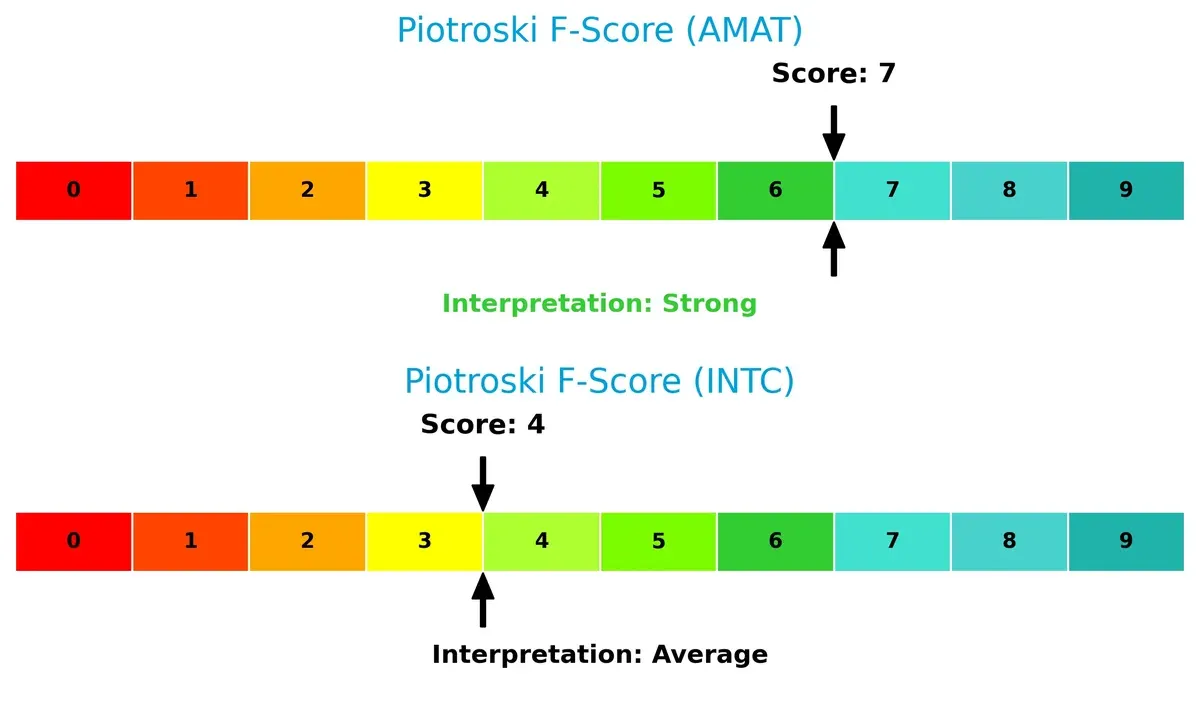
Financial Health: Quality of Operations
Applied Materials scores a strong 7 on the Piotroski F-Score, reflecting solid profitability, liquidity, and operational efficiency. Intel’s average score of 4 reveals red flags in internal financial metrics and weaker health compared to its peer:
How are the two companies positioned?
This section dissects AMAT and INTC’s operational DNA by comparing their revenue distribution and internal dynamics. The goal is to confront their economic moats to reveal which model delivers a more resilient, sustainable advantage today.
Revenue Segmentation: The Strategic Mix
This visual comparison dissects how Applied Materials, Inc. and Intel Corporation diversify their income streams and where their primary sector bets lie:
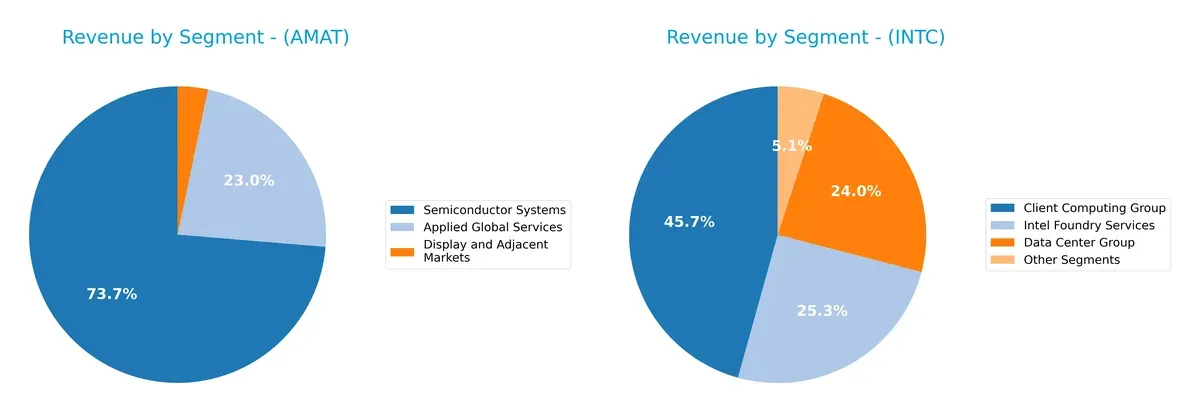
Applied Materials anchors revenue in Semiconductor Systems with $19.9B, complemented by $6.2B in Applied Global Services and $885M in Display markets. Intel shows greater diversification: $32.2B from Client Computing, $17.8B from Foundry Services, and $16.9B in Data Center Group. Intel’s broader portfolio reduces concentration risk, while Applied Materials’ focus reflects deep infrastructure dominance in semiconductor equipment.
Strengths and Weaknesses Comparison
This table compares the Strengths and Weaknesses of Applied Materials, Inc. and Intel Corporation:
Applied Materials Strengths
- Strong profitability with 24.67% net margin
- High ROE at 34.28%
- Robust ROIC at 21.96%
- Solid liquidity with current ratio 2.61
- Diversified semiconductor and services segments
- Significant global presence in China and Korea
Intel Strengths
- Favorable P/E valuation despite losses
- Good liquidity with current ratio 2.02
- Diverse product segments including computing and foundry
- Large scale in client computing and data center
- Strong geographic revenue from US and Asia-Pacific
- Moderate leverage with debt-to-assets 22.03%
Applied Materials Weaknesses
- Unfavorable WACC at 11.37% exceeding ROIC
- High P/B of 9.11 suggests overvaluation
- Low dividend yield at 0.74%
- Moderate asset turnover at 0.78
- Exposure to China risks due to revenue concentration
Intel Weaknesses
- Negative profitability with -0.51% net margin
- Negative ROE and ROIC indicating operational challenges
- Poor asset turnover at 0.25 and fixed asset turnover 0.5
- Low interest coverage ratio at 2.63
- Zero dividend yield limits income appeal
Applied Materials demonstrates strong profitability and liquidity with diversified product lines and global reach. Intel faces profitability and efficiency challenges despite scale and geographic diversification. These factors imply differing strategic priorities around operational improvement versus growth and valuation management.
The Moat Duel: Analyzing Competitive Defensibility
A structural moat protects long-term profits from relentless competition erosion. Without it, gains vanish quickly. Let’s analyze Applied Materials and Intel’s moats:
Applied Materials, Inc.: Technological and Scale Moat
I see Applied Materials’ moat in its advanced manufacturing equipment and integrated solutions, driving high ROIC (~10.6% above WACC). Margin stability and strong global reach reinforce this. New semiconductor tech adoption in 2026 could deepen its advantage.
Intel Corporation: Legacy Brand with Capital Intensity Challenges
Intel relies on its scale and brand but faces a shrinking moat, reflected in ROIC well below WACC and steep margin declines. Unlike Applied Materials, Intel struggles to convert capital into economic profits. Its 2026 turnaround efforts face tough execution risks.
Verdict: Capital Efficiency vs. Legacy Scale
Applied Materials commands a wider moat through superior capital allocation and innovation. Intel’s value destruction warns of structural challenges. I believe Applied Materials is better positioned to defend and grow market share in 2026.
Which stock offers better returns?
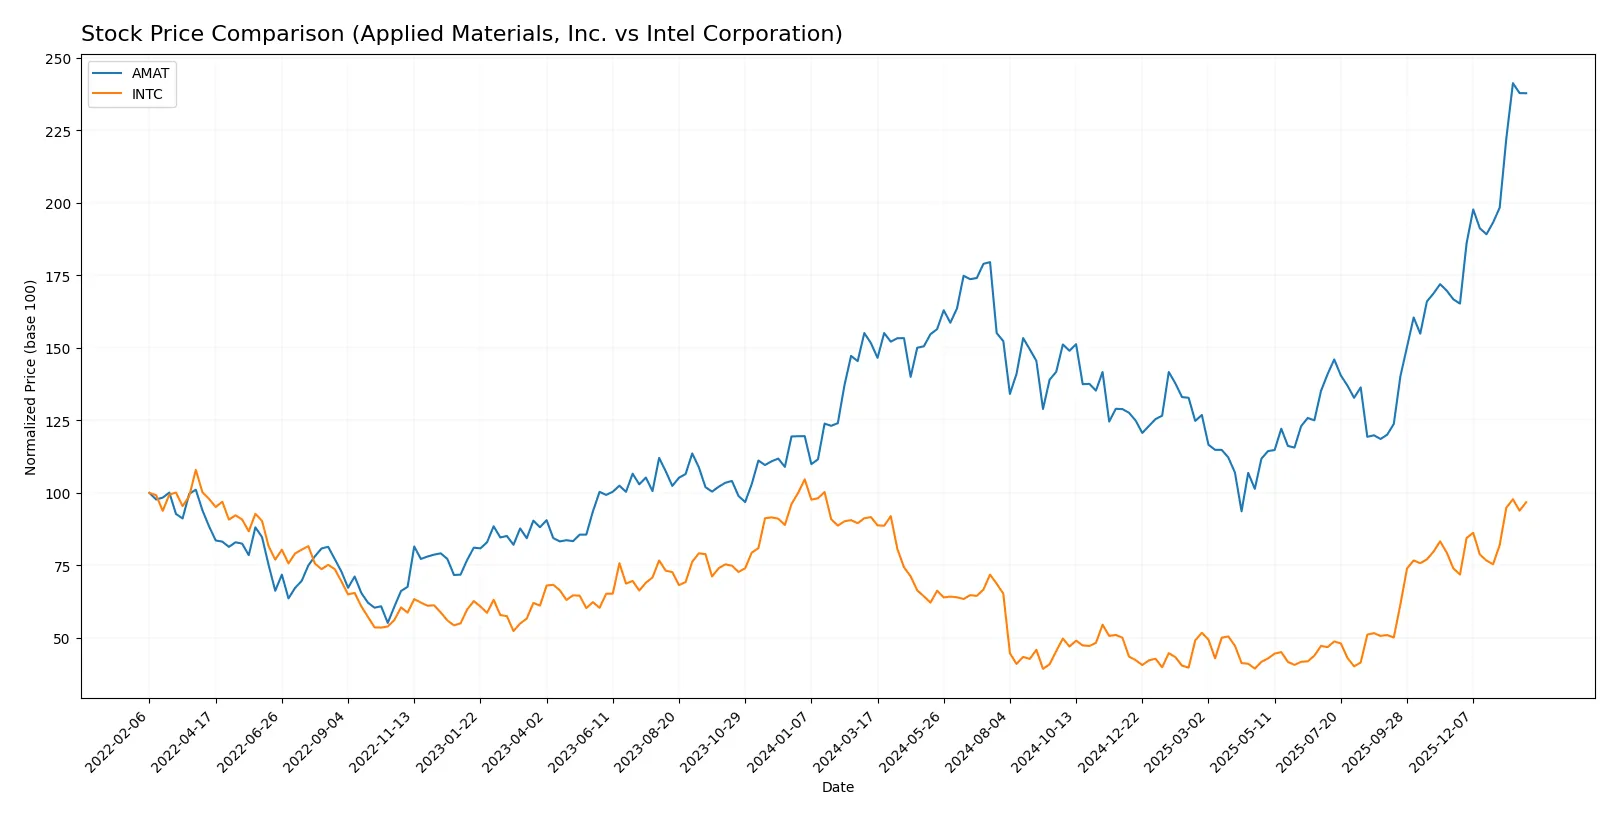
The past year saw Applied Materials, Inc. sharply outperform Intel Corporation, with both stocks showing bullish acceleration but diverging in magnitude and price volatility.
Trend Comparison
Applied Materials, Inc. achieved a strong 56.8% price increase over 12 months, exhibiting accelerating bullish momentum and high volatility with a standard deviation of 38.96. The stock hit a low of 126.95 and peaked at 327.01.
Intel Corporation recorded a modest 5.61% gain over the same period, maintaining bullish acceleration with lower volatility at a standard deviation of 8.11. Its price ranged between 18.89 and 46.96.
Applied Materials outperformed Intel significantly in market returns, delivering a higher price increase and more pronounced upward momentum over the analyzed year.
Target Prices
Analysts present a mixed but generally optimistic consensus for Applied Materials and Intel.
| Company | Target Low | Target High | Consensus |
|---|---|---|---|
| Applied Materials, Inc. | 273 | 400 | 347.38 |
| Intel Corporation | 20 | 66 | 46.95 |
Applied Materials’ consensus target of 347.38 exceeds its current price of 322.32, indicating moderate upside potential. Intel’s consensus target at 46.95 aligns closely with its current price near 46.47, suggesting a relatively balanced market expectation.

Don’t Let Luck Decide Your Entry Point
Optimize your entry points with our advanced ProRealTime indicators. You’ll get efficient buy signals with precise price targets for maximum performance. Start outperforming now!
How do institutions grade them?
Applied Materials, Inc. Grades
The following table presents recent grades from reputable institutions for Applied Materials, Inc.:
| Grading Company | Action | New Grade | Date |
|---|---|---|---|
| Mizuho | Upgrade | Outperform | 2026-01-28 |
| Deutsche Bank | Upgrade | Buy | 2026-01-23 |
| Needham | Maintain | Buy | 2026-01-20 |
| Keybanc | Maintain | Overweight | 2026-01-16 |
| Barclays | Upgrade | Overweight | 2026-01-15 |
| Wells Fargo | Maintain | Overweight | 2026-01-15 |
| Stifel | Maintain | Buy | 2026-01-14 |
| B of A Securities | Maintain | Buy | 2026-01-13 |
| Susquehanna | Upgrade | Positive | 2026-01-12 |
| Cantor Fitzgerald | Maintain | Overweight | 2026-01-08 |
Intel Corporation Grades
The following table presents recent grades from reputable institutions for Intel Corporation:
| Grading Company | Action | New Grade | Date |
|---|---|---|---|
| RBC Capital | Maintain | Sector Perform | 2026-01-23 |
| Wedbush | Maintain | Neutral | 2026-01-23 |
| Stifel | Maintain | Hold | 2026-01-23 |
| UBS | Maintain | Neutral | 2026-01-23 |
| Keybanc | Maintain | Overweight | 2026-01-23 |
| Roth Capital | Maintain | Neutral | 2026-01-23 |
| Needham | Maintain | Hold | 2026-01-23 |
| Morgan Stanley | Maintain | Equal Weight | 2026-01-23 |
| Benchmark | Maintain | Buy | 2026-01-23 |
| Evercore ISI Group | Maintain | In Line | 2026-01-23 |
Which company has the best grades?
Applied Materials displays stronger and more frequent upgrades, including multiple Buy and Outperform ratings. Intel’s grades remain largely stable with neutral or Hold ratings. This suggests greater institutional confidence in Applied Materials, potentially influencing investor sentiment toward growth prospects.
Risks specific to each company
The following categories identify the critical pressure points and systemic threats facing both firms in the 2026 market environment:
1. Market & Competition
Applied Materials, Inc.
- Operates in a highly competitive semiconductor equipment sector with strong technological innovation demands.
Intel Corporation
- Faces intense competition in chip manufacturing with slowing margins and legacy issues in process technology.
2. Capital Structure & Debt
Applied Materials, Inc.
- Low debt-to-equity ratio at 0.35, with strong interest coverage of 35.46, indicating financial flexibility.
Intel Corporation
- Slightly higher leverage (debt-to-equity 0.41) and weaker interest coverage at 2.63, signaling tighter debt servicing capacity.
3. Stock Volatility
Applied Materials, Inc.
- Beta of 1.671 suggests higher volatility relative to the market, reflecting cyclical industry exposure.
Intel Corporation
- Lower beta at 1.354 implies somewhat less price volatility but still sensitive to semiconductor sector swings.
4. Regulatory & Legal
Applied Materials, Inc.
- Exposed to international trade regulations, especially with operations in Asia; no major legal flags reported.
Intel Corporation
- Faces regulatory scrutiny on antitrust fronts and export controls, with increased geopolitical tensions affecting supply chains.
5. Supply Chain & Operations
Applied Materials, Inc.
- Benefits from diversified global supply chain but vulnerable to component shortages and rising input costs.
Intel Corporation
- Struggles with supply chain disruptions impacting manufacturing ramp-up and capacity utilization.
6. ESG & Climate Transition
Applied Materials, Inc.
- ESG initiatives advancing, though energy-intensive manufacturing challenges remain amid climate transition pressures.
Intel Corporation
- Significant focus on sustainability but under pressure to improve energy efficiency and waste management practices.
7. Geopolitical Exposure
Applied Materials, Inc.
- Significant exposure to Asia-Pacific geopolitical tensions given sales and operations in China, Taiwan, Korea, and Japan.
Intel Corporation
- Similar geopolitical risks compounded by reliance on foreign manufacturing sites and export regulations.
Which company shows a better risk-adjusted profile?
Applied Materials faces intense market competition and geopolitical risks but boasts strong financial stability and liquidity. Intel grapples with profitability challenges and operational disruptions that heighten risk. AMAT’s Altman Z-Score of 14.2 and Piotroski score of 7 contrast sharply with INTC’s weaker scores, signaling a safer financial position. Applied Materials’ robust interest coverage ratio (35.46 vs. Intel’s 2.63) justifies my concern over Intel’s ability to swiftly manage debt amid industry cyclicality. Overall, Applied Materials presents a superior risk-adjusted profile given its stronger capital structure and operational resilience.
Final Verdict: Which stock to choose?
Applied Materials, Inc. (AMAT) shines as a cash-generating powerhouse with a durable competitive edge in semiconductor equipment. Its efficiency in capital allocation drives strong returns, although a declining ROIC trend calls for vigilance. AMAT suits investors targeting aggressive growth with a tolerance for cyclical volatility.
Intel Corporation (INTC) leverages a strategic moat in semiconductor design and manufacturing scale, offering relative stability compared to AMAT. Despite recent profitability challenges, its solid balance sheet and ongoing R&D investment could appeal to those favoring a GARP profile. Intel fits portfolios seeking turnaround potential with moderate risk.
If you prioritize consistent value creation and robust capital returns, AMAT outshines with superior profitability and growth momentum. However, if you seek a more conservative play anchored in market scale and potential recovery, INTC offers better stability despite current headwinds. Both present distinctive scenarios aligned with different investor appetites.
Disclaimer: Investment carries a risk of loss of initial capital. The past performance is not a reliable indicator of future results. Be sure to understand risks before making an investment decision.
Go Further
I encourage you to read the complete analyses of Applied Materials, Inc. and Intel Corporation to enhance your investment decisions: