In the dynamic semiconductor industry, Applied Materials, Inc. (AMAT) and indie Semiconductor, Inc. (INDI) stand out for their distinct approaches to innovation and market focus. AMAT leads with advanced manufacturing equipment and services for chip production, while INDI specializes in automotive semiconductor solutions for connected and electric vehicles. This comparison will help investors understand which company offers a more compelling opportunity in this evolving sector. Let’s explore which one fits best in your portfolio.
Table of contents
Companies Overview
I will begin the comparison between Applied Materials, Inc. and indie Semiconductor, Inc. by providing an overview of these two companies and their main differences.
Applied Materials, Inc. Overview
Applied Materials, Inc. specializes in manufacturing equipment, services, and software for the semiconductor, display, and related industries. The company operates through segments focused on semiconductor systems, global services, and display technologies. With a market cap of 258B USD and 36,000 employees, Applied Materials maintains a strong global presence serving clients in the US, Asia, and Europe.
indie Semiconductor, Inc. Overview
indie Semiconductor, Inc. provides automotive semiconductors and software solutions for advanced driver assistance, connected car, and electrification applications. The company targets automotive features such as parking assistance, wireless charging, infotainment, and telematics. With a market cap of 880M USD and 920 employees, indie Semiconductor is a smaller player headquartered in Aliso Viejo, California.
Key similarities and differences
Both companies operate in the semiconductor industry with a technology sector focus, but they differ significantly in scale and market specialization. Applied Materials serves a broad range of semiconductor and display markets with manufacturing equipment and services, while indie Semiconductor concentrates on automotive semiconductor solutions and software. Applied Materials is far larger in market capitalization and workforce, reflecting its established global footprint compared to indie’s niche automotive focus.
Income Statement Comparison
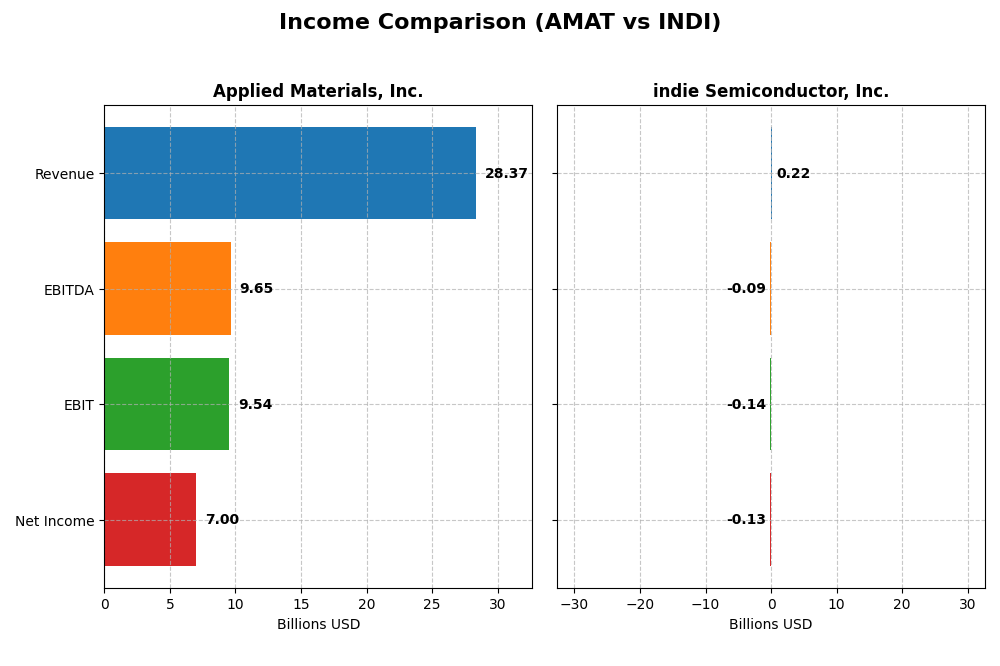
The table below presents a side-by-side comparison of the most recent full fiscal year income statements for Applied Materials, Inc. and indie Semiconductor, Inc., highlighting key financial metrics.
| Metric | Applied Materials, Inc. (AMAT) | indie Semiconductor, Inc. (INDI) |
|---|---|---|
| Market Cap | 258.4B | 879.3M |
| Revenue | 28.37B | 217M |
| EBITDA | 9.65B | -94M |
| EBIT | 9.54B | -137M |
| Net Income | 7.00B | -133M |
| EPS | 8.71 | -0.76 |
| Fiscal Year | 2025 | 2024 |
Income Statement Interpretations
Applied Materials, Inc.
Applied Materials exhibited steady revenue growth from 23B in 2021 to 28.4B in 2025, with net income rising from 5.9B to 7B over the same period. Margins remained strong and favorable, with gross margin near 49% and net margin around 25%. In 2025, revenue growth slowed to 4.4%, while gross profit and EBIT margins improved, despite a slight net margin decline.
indie Semiconductor, Inc.
Indie Semiconductor’s revenue expanded significantly from 22.6M in 2020 to 217M in 2024, though net income remained negative, reaching -133M in 2024. Gross margin was favorable at 41.7%, but EBIT and net margins were deeply negative, signaling ongoing losses. The latest year showed a slight 2.9% revenue decline and worsening EBIT and net margins, offset by a favorable rise in EPS.
Which one has the stronger fundamentals?
Applied Materials demonstrates stronger fundamentals with consistent revenue and net income growth, robust margins, and a favorable overall income statement evaluation. Indie Semiconductor’s rapid revenue growth is overshadowed by persistent losses and negative margins, reflected in a neutral income statement opinion. Thus, Applied Materials presents a more stable and profitable financial profile.
Financial Ratios Comparison
The table below presents a side-by-side comparison of key financial ratios for Applied Materials, Inc. (AMAT) and indie Semiconductor, Inc. (INDI) based on their most recent fiscal year data.
| Ratios | Applied Materials, Inc. (AMAT) | indie Semiconductor, Inc. (INDI) |
|---|---|---|
| ROE | 34.3% | -31.7% |
| ROIC | 21.96% | -19.25% |
| P/E | 26.58 | -5.35 |
| P/B | 9.11 | 1.70 |
| Current Ratio | 2.61 | 4.82 |
| Quick Ratio | 1.87 | 4.23 |
| D/E | 0.35 | 0.95 |
| Debt-to-Assets | 19.4% | 42.3% |
| Interest Coverage | 30.8 | -18.4 |
| Asset Turnover | 0.78 | 0.23 |
| Fixed Asset Turnover | 5.54 | 4.30 |
| Payout Ratio | 19.8% | 0% |
| Dividend Yield | 0.74% | 0% |
Interpretation of the Ratios
Applied Materials, Inc.
Applied Materials displays strong profitability with a net margin of 24.67%, ROE of 34.28%, and ROIC of 21.96%, indicating efficient capital use and earnings generation. The balance sheet is solid, supported by a current ratio of 2.61 and low debt levels. Dividend yield stands at 0.74%, reflecting a modest payout with potential concerns on valuation multiples like a high P/E of 26.58 and P/B of 9.11.
indie Semiconductor, Inc.
indie Semiconductor shows weak financial health, with negative net margin (-61.2%), ROE (-31.73%), and ROIC (-19.25%), highlighting ongoing losses and inefficient capital use. Liquidity appears strong due to a high current ratio of 4.82, but interest coverage is negative at -14.8, raising solvency concerns. The company does not pay dividends, consistent with its investment in R&D and growth phase status.
Which one has the best ratios?
Applied Materials holds the advantage with a majority of favorable ratios (64.29%), demonstrating profitability, liquidity, and manageable leverage, despite some valuation concerns. indie Semiconductor faces significant challenges, with 57.14% unfavorable ratios and negative profitability metrics, reflecting its early-stage and high-risk profile. Hence, Applied Materials has the stronger overall ratio profile.
Strategic Positioning
This section compares the strategic positioning of Applied Materials, Inc. (AMAT) and indie Semiconductor, Inc. (INDI) across Market position, Key segments, and Exposure to technological disruption:
Applied Materials, Inc. (AMAT)
- Leading semiconductor equipment provider with significant market cap and NASDAQ Global Select listing.
- Diversified segments: Semiconductor Systems, Applied Global Services, and Display and Adjacent Markets.
- Operates across multiple semiconductor manufacturing technologies, supporting broad industry innovation.
indie Semiconductor, Inc. (INDI)
- Small market cap automotive semiconductor supplier listed on NASDAQ Capital Market.
- Focused on automotive semiconductors and software for advanced driver assistance and connectivity.
- Provides photonic components and automotive solutions, exposed to evolving automotive tech.
AMAT vs INDI Positioning
AMAT pursues a diversified business model spanning multiple semiconductor segments, providing scale and broad technological exposure. INDI concentrates on automotive semiconductor niches, offering specialization but higher market and technological focus risk.
Which has the best competitive advantage?
AMAT shows a slightly favorable moat with value creation despite declining profitability, whereas INDI exhibits a very unfavorable moat with declining returns, indicating AMAT currently holds a stronger competitive advantage.
Stock Comparison
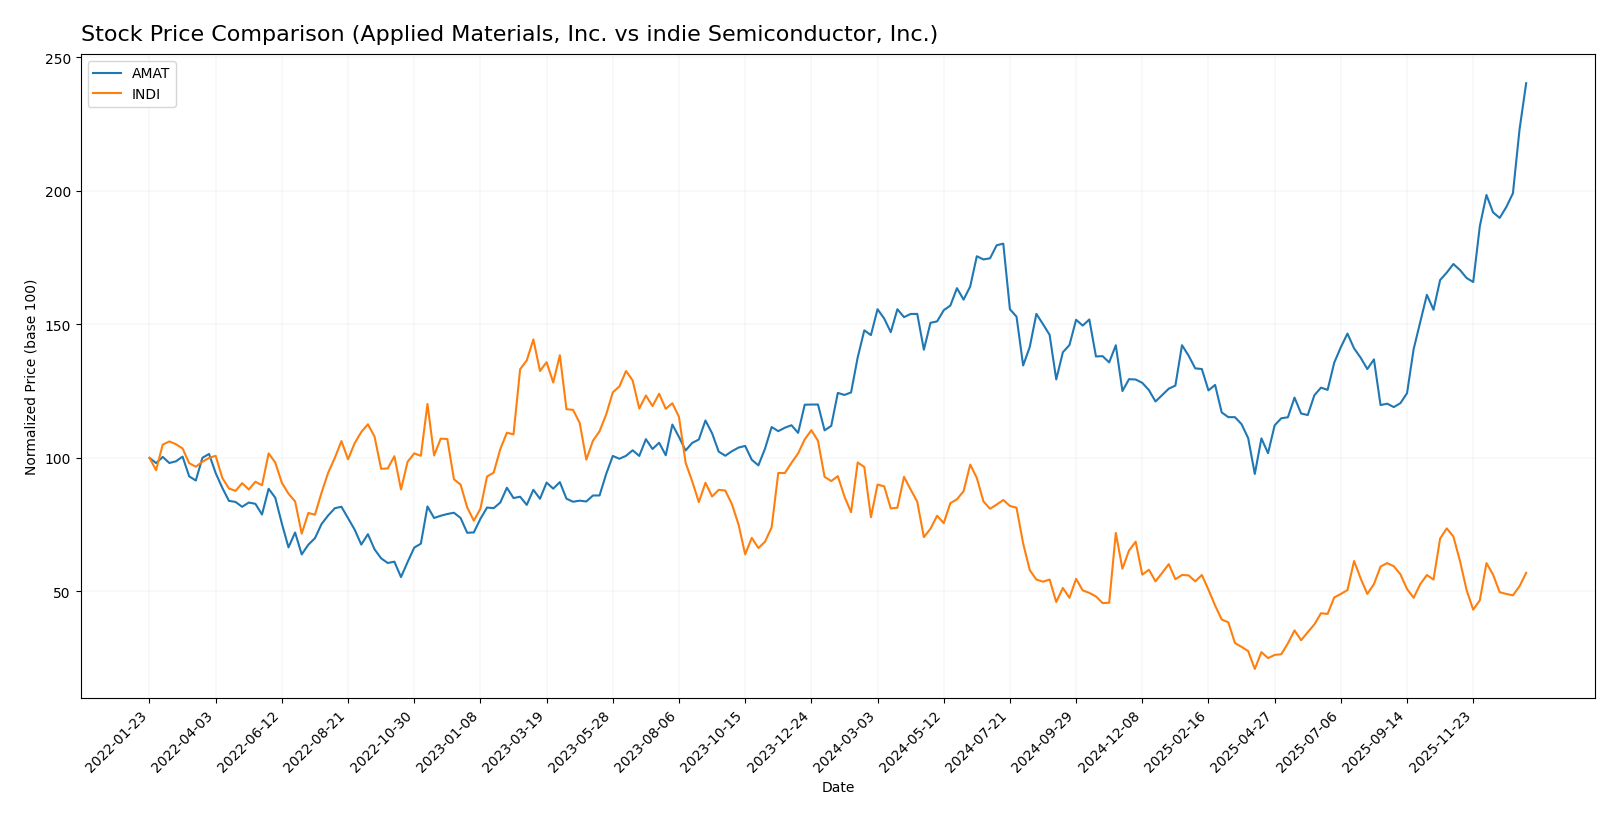
The stock price chart highlights notable divergences in price momentum and trading dynamics between Applied Materials, Inc. and indie Semiconductor, Inc. over the past year, reflecting distinct market sentiment and volatility profiles.
Trend Analysis
Applied Materials, Inc. experienced a bullish trend over the past 12 months with a 64.6% price increase, showing acceleration and significant volatility, reaching a high of 324.53 and a low of 126.95.
Indie Semiconductor, Inc. exhibited a bearish trend with a 26.79% price decline over the same period, alongside deceleration and low volatility, with prices ranging from 1.6 to 7.43.
Comparing the two, Applied Materials delivered the highest market performance with strong upward momentum, while indie Semiconductor showed a marked downward trajectory.
Target Prices
The target price consensus for Applied Materials, Inc. and indie Semiconductor, Inc. reflects varied analyst expectations based on their market positions and growth potential.
| Company | Target High | Target Low | Consensus |
|---|---|---|---|
| Applied Materials, Inc. | 400 | 273 | 327.71 |
| indie Semiconductor, Inc. | 8 | 8 | 8 |
Applied Materials’ consensus target price of 327.71 USD is slightly above its current price of 324.41 USD, indicating moderate upside potential. indie Semiconductor’s fixed target of 8 USD suggests analysts expect significant growth from its current price of 4.34 USD.
Analyst Opinions Comparison
This section compares analysts’ ratings and grades for Applied Materials, Inc. and indie Semiconductor, Inc.:
Rating Comparison
AMAT Rating
- Rating: B+ indicating a very favorable outlook.
- Discounted Cash Flow Score: 3, moderate valuation.
- ROE Score: 5, very favorable efficiency in profit generation.
- ROA Score: 5, very favorable asset utilization.
- Debt To Equity Score: 2, moderate financial risk.
- Overall Score: 3, moderate overall financial standing.
INDI Rating
- Rating: C- reflecting a very unfavorable stance.
- Discounted Cash Flow Score: 1, very unfavorable valuation.
- ROE Score: 1, very unfavorable profit efficiency.
- ROA Score: 1, very unfavorable asset utilization.
- Debt To Equity Score: 1, very unfavorable financial risk.
- Overall Score: 1, very unfavorable overall standing.
Which one is the best rated?
Applied Materials, Inc. is clearly better rated than indie Semiconductor, Inc. across every available metric, showing stronger profitability, asset use, and lower financial risk according to the provided data.
Scores Comparison
Here is the comparison of the Altman Z-Score and Piotroski Score for Applied Materials, Inc. and indie Semiconductor, Inc.:
AMAT Scores
- Altman Z-Score: 13.45, indicating a safe financial zone.
- Piotroski Score: 7, reflecting strong financial strength.
INDI Scores
- Altman Z-Score: 0.12, indicating a distress financial zone.
- Piotroski Score: 2, reflecting very weak financial strength.
Which company has the best scores?
Based strictly on the data, AMAT shows significantly better scores with a safe Altman Z-Score and strong Piotroski Score. INDI’s scores indicate financial distress and very weak financial health.
Grades Comparison
Here is a detailed comparison of the recent grades for Applied Materials, Inc. and indie Semiconductor, Inc.:
Applied Materials, Inc. Grades
The following table shows the latest grades assigned by recognized grading companies for Applied Materials, Inc.:
| Grading Company | Action | New Grade | Date |
|---|---|---|---|
| B of A Securities | Maintain | Buy | 2026-01-13 |
| Susquehanna | Upgrade | Positive | 2026-01-12 |
| Cantor Fitzgerald | Maintain | Overweight | 2026-01-08 |
| B. Riley Securities | Maintain | Buy | 2025-12-18 |
| Mizuho | Maintain | Neutral | 2025-12-17 |
| Wells Fargo | Maintain | Overweight | 2025-12-15 |
| Jefferies | Maintain | Buy | 2025-12-15 |
| Keybanc | Maintain | Overweight | 2025-12-02 |
| UBS | Upgrade | Buy | 2025-11-25 |
| B. Riley Securities | Maintain | Buy | 2025-11-14 |
Overall, Applied Materials’ grades predominantly indicate a positive outlook, with multiple “Buy” and “Overweight” ratings and occasional upgrades, reflecting generally optimistic sentiment from analysts.
indie Semiconductor, Inc. Grades
The following table shows the latest grades assigned by recognized grading companies for indie Semiconductor, Inc.:
| Grading Company | Action | New Grade | Date |
|---|---|---|---|
| UBS | Maintain | Neutral | 2025-11-10 |
| Benchmark | Maintain | Buy | 2025-06-25 |
| Benchmark | Maintain | Buy | 2025-06-11 |
| Benchmark | Maintain | Buy | 2025-05-21 |
| Benchmark | Maintain | Buy | 2025-05-13 |
| Craig-Hallum | Maintain | Buy | 2025-05-13 |
| Keybanc | Maintain | Overweight | 2025-05-13 |
| Benchmark | Maintain | Buy | 2025-04-09 |
| Benchmark | Maintain | Buy | 2025-02-21 |
| Keybanc | Maintain | Overweight | 2025-02-21 |
indie Semiconductor’s grades show steady support with predominantly “Buy” and “Overweight” ratings, and no downgrades, signaling consistent analyst confidence.
Which company has the best grades?
Both companies carry a consensus “Buy” rating; however, Applied Materials, Inc. has a larger number of recent grades from diverse firms and some upgrades, indicating slightly stronger and broader analyst support compared to indie Semiconductor, Inc. This difference may affect investor perception of stability and growth potential.
Strengths and Weaknesses
Below is a comparative table highlighting the key strengths and weaknesses of Applied Materials, Inc. (AMAT) and indie Semiconductor, Inc. (INDI) based on recent financial and operational data.
| Criterion | Applied Materials, Inc. (AMAT) | indie Semiconductor, Inc. (INDI) |
|---|---|---|
| Diversification | Highly diversified: strong revenue across Semiconductor Systems (19.9B), Applied Global Services (6.2B), and Display markets (0.9B) | Limited diversification: mainly products (203M) and smaller service segment (14M) |
| Profitability | Strong profitability: net margin 24.67%, ROIC 21.96%, ROE 34.28% | Negative profitability: net margin -61.2%, ROIC -19.25%, ROE -31.73% |
| Innovation | Steady innovation with solid investment in semiconductor tech, reflected in favorable fixed asset turnover (5.54) | Struggling innovation impact, indicated by declining profitability and asset turnover (0.23) |
| Global presence | Established global player with broad market reach and strong services arm | Smaller scale, less global footprint; focused niche in semiconductor products |
| Market Share | Significant market share in semiconductor equipment segment | Small market share, facing strong competitive pressures |
Key takeaways: AMAT demonstrates strong diversification, profitability, and global presence, making it a more stable investment with a slightly favorable moat despite declining ROIC trend. INDI faces serious challenges with negative profitability and shrinking returns, signaling high risk and very unfavorable moat status. Investors should weigh AMAT’s strengths against INDI’s financial difficulties carefully.
Risk Analysis
Below is a comparative table of key risks for Applied Materials, Inc. (AMAT) and indie Semiconductor, Inc. (INDI) based on the most recent data:
| Metric | Applied Materials, Inc. (AMAT) | indie Semiconductor, Inc. (INDI) |
|---|---|---|
| Market Risk | Moderate (Beta 1.67) | High (Beta 2.54) |
| Debt level | Low (Debt-to-Equity 0.35) | Moderate (Debt-to-Equity 0.95) |
| Regulatory Risk | Moderate (Global operations) | Moderate (Automotive sector) |
| Operational Risk | Low (Established, 36K employees) | High (Small size, 920 employees) |
| Environmental Risk | Moderate (Semiconductor manufacturing) | Moderate (Automotive tech) |
| Geopolitical Risk | Moderate (Exposure to Asia) | Moderate (Exposure to global markets) |
The most impactful and likely risks differ significantly: AMAT benefits from strong financial health and a safer operational scale but faces moderate market and geopolitical risks due to global exposure. INDI carries elevated market and operational risks, reflected in its high beta and weak financial scores, alongside bankruptcy risk indicated by its distress Altman Z-Score. Investors should prioritize risk management accordingly.
Which Stock to Choose?
Applied Materials, Inc. (AMAT) shows steady income growth with a 23% revenue increase over five years and favorable profitability ratios, including a 24.7% net margin and 34.3% ROE. Its debt levels are moderate, supported by a strong current ratio of 2.61, and it holds a very favorable overall rating of B+.
indie Semiconductor, Inc. (INDI) exhibits volatile income with a 2.9% revenue decline last year and persistent negative profitability metrics, including a -61.2% net margin and -31.7% ROE. The company carries higher debt relative to assets, a mixed liquidity profile, and a very unfavorable overall rating of C-.
For investors prioritizing financial strength and consistent profitability, AMAT might appear more favorable given its strong rating, value-creating moat, and positive income statement trends. Conversely, investors with a tolerance for higher risk and focus on potential turnaround or growth might find INDI’s profile worth monitoring despite its challenges.
Disclaimer: Investment carries a risk of loss of initial capital. The past performance is not a reliable indicator of future results. Be sure to understand risks before making an investment decision.
Go Further
I encourage you to read the complete analyses of Applied Materials, Inc. and indie Semiconductor, Inc. to enhance your investment decisions: