In the dynamic semiconductor industry, Applied Materials, Inc. (AMAT) and GLOBALFOUNDRIES Inc. (GFS) stand out as key players shaping technological progress. Both companies serve critical roles—AMAT as a leading supplier of manufacturing equipment and software, and GFS as a prominent semiconductor foundry. Their overlapping markets and innovation-driven strategies make them compelling candidates for comparison. This article will help you decide which company deserves a place in your investment portfolio.
Table of contents
Companies Overview
I will begin the comparison between Applied Materials and GLOBALFOUNDRIES by providing an overview of these two companies and their main differences.
Applied Materials Overview
Applied Materials, Inc. provides manufacturing equipment, services, and software to the semiconductor, display, and related industries. Operating since 1967 and headquartered in Santa Clara, California, it serves global markets including the US, China, Korea, and Europe. The company focuses on semiconductor systems, applied global services, and display technologies, positioning itself as a leading technology supplier with a market cap of $258B.
GLOBALFOUNDRIES Overview
GLOBALFOUNDRIES Inc. is a semiconductor foundry founded in 2009 and based in Malta, New York. It manufactures integrated circuits that power various electronic devices worldwide. With a market cap of $23.5B, GFS delivers wafer fabrication services and produces a range of semiconductor devices such as microprocessors and power management units, emphasizing mainstream semiconductor manufacturing technologies.
Key similarities and differences
Both companies operate in the semiconductor industry and are listed on NASDAQ, focusing on enabling electronic devices through advanced technologies. Applied Materials specializes in semiconductor equipment, software, and services, while GLOBALFOUNDRIES is primarily a semiconductor foundry offering wafer fabrication and integrated circuit manufacturing. Their business models differ as Applied Materials supports production processes, whereas GLOBALFOUNDRIES directly manufactures semiconductor chips.
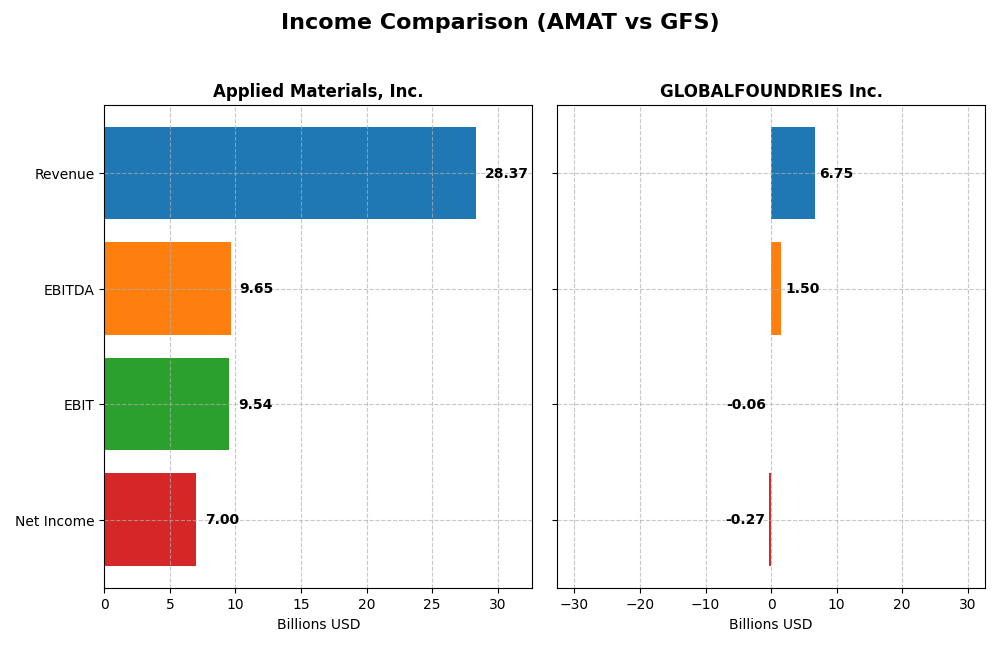
Income Statement Comparison
The table below presents a side-by-side comparison of key income statement metrics for Applied Materials, Inc. and GLOBALFOUNDRIES Inc. based on their most recent fiscal year data.
| Metric | Applied Materials, Inc. (AMAT) | GLOBALFOUNDRIES Inc. (GFS) |
|---|---|---|
| Market Cap | 258B | 23.5B |
| Revenue | 28.4B | 6.75B |
| EBITDA | 9.65B | 1.50B |
| EBIT | 9.54B | -64M |
| Net Income | 7.00B | -265M |
| EPS | 8.71 | -0.48 |
| Fiscal Year | 2025 | 2024 |
Income Statement Interpretations
Applied Materials, Inc.
Applied Materials showed consistent revenue growth from 23B in 2021 to 28.4B in 2025, with net income rising from 5.9B to 7.0B over the same period. Margins remained strong, with a gross margin near 49% and net margin around 25%. In 2025, revenue growth slowed to 4.4%, while EBIT margin improved, though net margin declined slightly.
GLOBALFOUNDRIES Inc.
GLOBALFOUNDRIES’ revenue increased overall from 4.9B in 2020 to 6.8B in 2024, but net income was volatile, swinging from -1.35B loss in 2020 to a 1.02B profit in 2023, then back to a 265M loss in 2024. Gross margin was stable at 24.5%, but EBIT and net margins were negative in the latest year, reflecting operational challenges and lower profitability.
Which one has the stronger fundamentals?
Applied Materials demonstrates stronger fundamentals, with favorable gross, EBIT, and net margins, plus steady revenue and income growth over five years. GLOBALFOUNDRIES shows mixed results, with positive long-term growth but recent losses and unfavorable margins. Applied Materials’ consistent profitability and margin stability outweigh GLOBALFOUNDRIES’ volatility and negative recent earnings.
Financial Ratios Comparison
The table below compares key financial ratios for Applied Materials, Inc. (AMAT) and GLOBALFOUNDRIES Inc. (GFS) based on their most recent fiscal year data.
| Ratios | Applied Materials, Inc. (AMAT) FY 2025 | GLOBALFOUNDRIES Inc. (GFS) FY 2024 |
|---|---|---|
| ROE | 34.3% | -2.5% |
| ROIC | 21.96% | -1.5% |
| P/E | 26.58 | -89.54 |
| P/B | 9.11 | 2.20 |
| Current Ratio | 2.61 | 2.11 |
| Quick Ratio | 1.87 | 1.57 |
| D/E (Debt-to-Equity) | 0.35 | 0.22 |
| Debt-to-Assets | 19.4% | 13.8% |
| Interest Coverage | 30.8 | -1.48 |
| Asset Turnover | 0.78 | 0.40 |
| Fixed Asset Turnover | 5.54 | 0.82 |
| Payout ratio | 19.8% | 0% |
| Dividend yield | 0.74% | 0% |
Interpretation of the Ratios
Applied Materials, Inc.
Applied Materials shows predominantly strong financial ratios, with favorable net margin at 24.67%, ROE of 34.28%, and ROIC of 21.96%, reflecting solid profitability and efficient capital use. Its liquidity and leverage ratios are also favorable, though valuation metrics like P/E and P/B appear stretched. The company pays dividends, but the yield is low at 0.74%, suggesting cautious distribution amid strong cash flow coverage and prudent buybacks.
GLOBALFOUNDRIES Inc.
GLOBALFOUNDRIES displays weaker ratios, including negative net margin (-3.93%), ROE (-2.46%), and ROIC (-1.47%), indicating operational challenges and unprofitable returns. Liquidity and leverage look acceptable, but interest coverage is negative, signaling financial stress. The firm does not pay dividends, likely due to its losses and focus on reinvestment or growth, reflecting a priority on R&D and capacity expansion instead of shareholder returns.
Which one has the best ratios?
Considering the evaluations, Applied Materials presents a more favorable ratio profile with strong profitability, solid liquidity, and manageable debt, despite some valuation concerns. GLOBALFOUNDRIES shows mostly unfavorable profitability and coverage metrics, with financial stress signs. Thus, Applied Materials currently holds the superior overall financial ratio standing.
Strategic Positioning
This section compares the strategic positioning of Applied Materials, Inc. and GLOBALFOUNDRIES Inc., including market position, key segments, and exposure to technological disruption:
Applied Materials, Inc.
- Leading market position with significant competitive pressure in semiconductor equipment manufacturing.
- Diverse segments: Semiconductor Systems, Applied Global Services, Display and Adjacent Markets drive revenues.
- Exposure through advanced semiconductor manufacturing technologies and services across multiple regions.
GLOBALFOUNDRIES Inc.
- Smaller market cap with competitive pressure in wafer fabrication services globally.
- Focused on wafer fabrication and engineering/pre-fabrication services as main business drivers.
- Exposed to disruption through wafer fabrication technologies in a concentrated semiconductor foundry model.
Applied Materials, Inc. vs GLOBALFOUNDRIES Inc. Positioning
Applied Materials shows a diversified business model across equipment, services, and display technologies, offering broad industry exposure. GLOBALFOUNDRIES concentrates on wafer fabrication services, representing a more focused but narrower strategic scope.
Which has the best competitive advantage?
Applied Materials exhibits a slightly favorable moat by creating value despite declining profitability, while GLOBALFOUNDRIES is shedding value but improving profitability, indicating Applied Materials currently holds a stronger competitive advantage.
Stock Comparison
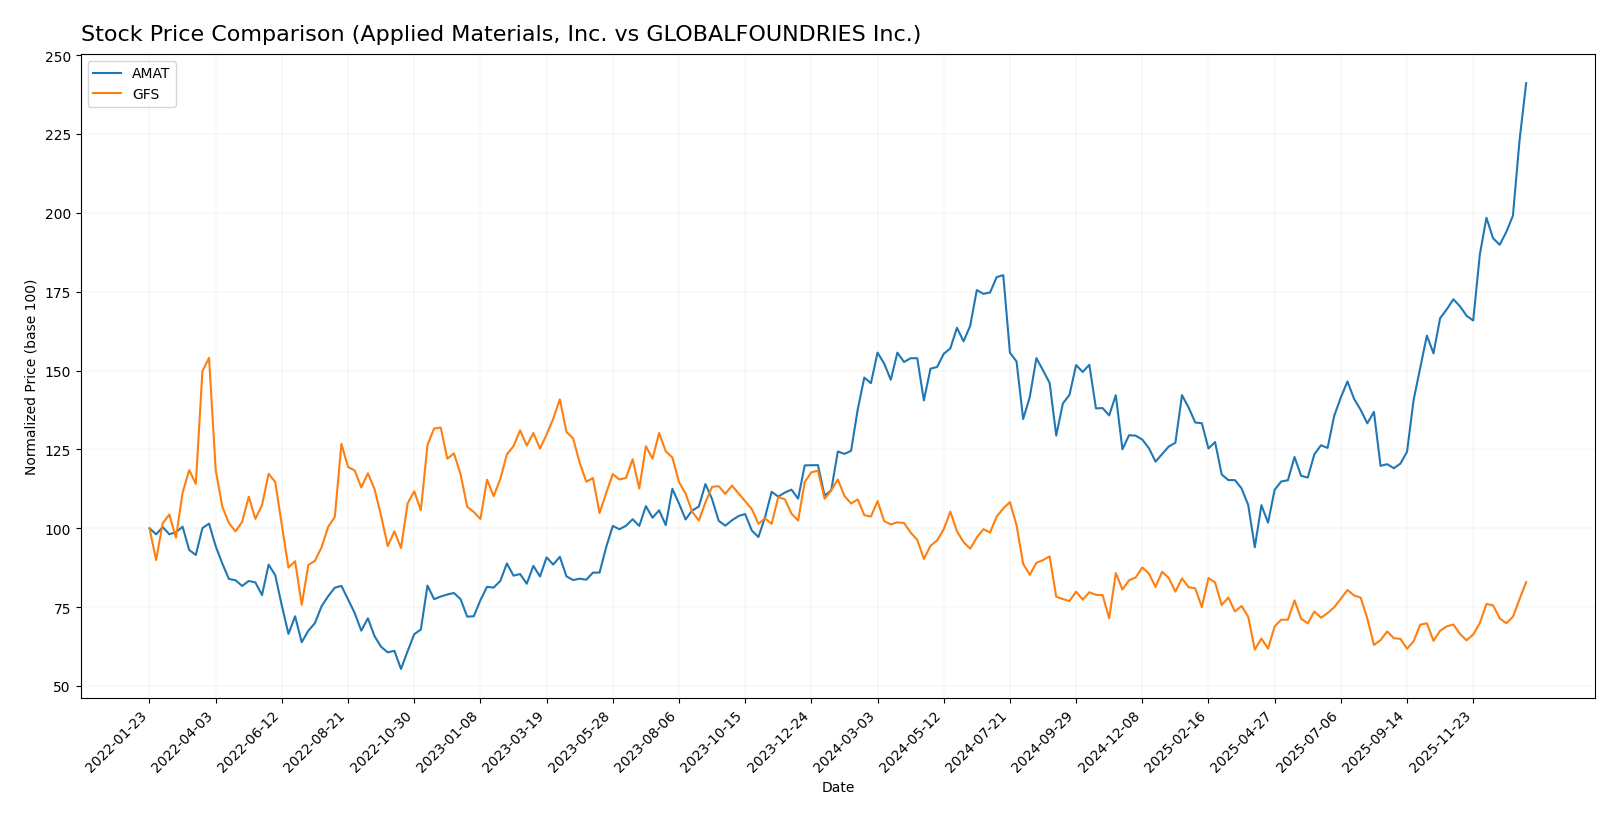
The stock prices of Applied Materials, Inc. (AMAT) and GLOBALFOUNDRIES Inc. (GFS) have shown contrasting dynamics over the past 12 months, with AMAT experiencing significant gains and GFS declining notably before recent modest recovery efforts.
Trend Analysis
Applied Materials, Inc. (AMAT) recorded a bullish trend over the past 12 months with a 65.15% price increase and accelerating momentum, reaching a high of 325.6 and a low of 126.95, despite elevated volatility (std. dev. 34.66).
GLOBALFOUNDRIES Inc. (GFS) showed a bearish trend with a 20.03% price decline over the same period, though recent weeks indicate a 19.39% rebound. Its trend also accelerated, but volatility remained lower (std. dev. 6.45).
Comparing both, AMAT delivered the highest market performance with a strong overall price appreciation, while GFS lagged with a significant net decline despite recent recovery.
Target Prices
Here is the consensus target price outlook for Applied Materials, Inc. and GLOBALFOUNDRIES Inc., reflecting analyst expectations.
| Company | Target High | Target Low | Consensus |
|---|---|---|---|
| Applied Materials, Inc. | 400 | 273 | 323.43 |
| GLOBALFOUNDRIES Inc. | 40 | 37 | 38.5 |
Applied Materials’ target consensus aligns closely with its current price near 323.35, suggesting limited upside. GLOBALFOUNDRIES’ consensus target is below its current price of 42.35, indicating potential overvaluation risk.
Analyst Opinions Comparison
This section compares analysts’ ratings and grades for Applied Materials, Inc. (AMAT) and GLOBALFOUNDRIES Inc. (GFS):
Rating Comparison
AMAT Rating
- Rating: B+, categorized as Very Favorable by analysts.
- Discounted Cash Flow Score: 3, indicating a moderate valuation.
- ROE Score: 5, showing very favorable profit generation from equity.
- ROA Score: 5, demonstrating very favorable asset utilization.
- Debt To Equity Score: 2, suggesting moderate financial risk.
- Overall Score: 3, assessed as moderate overall performance.
GFS Rating
- Rating: C+, rated Very Favorable by analysts.
- Discounted Cash Flow Score: 3, also indicating moderate valuation.
- ROE Score: 1, reflecting very unfavorable profit generation efficiency.
- ROA Score: 1, indicating very unfavorable asset utilization.
- Debt To Equity Score: 3, indicating a moderate financial risk.
- Overall Score: 2, reflecting moderate but lower overall performance.
Which one is the best rated?
Based on the provided data, AMAT holds a stronger rating (B+) with higher ROE and ROA scores, indicating better profitability and asset use. GFS’s lower overall score and unfavorable ROE and ROA suggest it is less favorably rated compared to AMAT.
Scores Comparison
Here is a comparison of the Altman Z-Score and Piotroski Score for Applied Materials, Inc. (AMAT) and GLOBALFOUNDRIES Inc. (GFS):
AMAT Scores
- Altman Z-Score: 13.45, indicating a safe financial zone
- Piotroski Score: 7, reflecting strong financial health
GFS Scores
- Altman Z-Score: 2.61, placing it in the grey zone
- Piotroski Score: 6, indicating average financial strength
Which company has the best scores?
Based strictly on the provided data, AMAT shows a higher Altman Z-Score in the safe zone and a stronger Piotroski Score compared to GFS, which is in the grey zone with average Piotroski results.
Grades Comparison
Here is a detailed comparison of the latest grades assigned to Applied Materials, Inc. and GLOBALFOUNDRIES Inc.:
Applied Materials, Inc. Grades
The following table presents recent grades from reputable grading companies for Applied Materials, Inc.:
| Grading Company | Action | New Grade | Date |
|---|---|---|---|
| B of A Securities | Maintain | Buy | 2026-01-13 |
| Susquehanna | Upgrade | Positive | 2026-01-12 |
| Cantor Fitzgerald | Maintain | Overweight | 2026-01-08 |
| B. Riley Securities | Maintain | Buy | 2025-12-18 |
| Mizuho | Maintain | Neutral | 2025-12-17 |
| Wells Fargo | Maintain | Overweight | 2025-12-15 |
| Jefferies | Maintain | Buy | 2025-12-15 |
| Keybanc | Maintain | Overweight | 2025-12-02 |
| UBS | Upgrade | Buy | 2025-11-25 |
| B. Riley Securities | Maintain | Buy | 2025-11-14 |
Applied Materials displays predominantly positive grades, with multiple buy and overweight ratings and few neutral positions, indicating a generally favorable analyst sentiment.
GLOBALFOUNDRIES Inc. Grades
The following table presents recent grades from reputable grading companies for GLOBALFOUNDRIES Inc.:
| Grading Company | Action | New Grade | Date |
|---|---|---|---|
| Wedbush | Downgrade | Neutral | 2025-12-31 |
| B of A Securities | Maintain | Underperform | 2025-12-04 |
| Evercore ISI Group | Maintain | Outperform | 2025-11-13 |
| JP Morgan | Maintain | Neutral | 2025-11-13 |
| Citigroup | Maintain | Neutral | 2025-11-13 |
| Wedbush | Maintain | Outperform | 2025-11-13 |
| B of A Securities | Downgrade | Underperform | 2025-10-13 |
| Deutsche Bank | Maintain | Buy | 2025-08-06 |
| Morgan Stanley | Maintain | Equal Weight | 2025-08-06 |
| Wedbush | Maintain | Outperform | 2025-08-06 |
GLOBALFOUNDRIES’ grades show a mix of neutral, outperform, and underperform ratings, with recent downgrades by Wedbush and B of A Securities signaling some caution.
Which company has the best grades?
Applied Materials holds stronger and more consistent buy and overweight ratings compared to GLOBALFOUNDRIES, which has a more mixed profile including underperform and neutral grades. This difference may impact investor perception of stability and growth potential.
Strengths and Weaknesses
Below is a comparative overview of key strengths and weaknesses for Applied Materials, Inc. (AMAT) and GLOBALFOUNDRIES Inc. (GFS) based on recent financial data and market performance.
| Criterion | Applied Materials, Inc. (AMAT) | GLOBALFOUNDRIES Inc. (GFS) |
|---|---|---|
| Diversification | Highly diversified across semiconductor systems, global services, and display markets | Less diversified, primarily focused on wafer fabrication and engineering services |
| Profitability | Strong profitability with net margin of 24.67% and ROIC of 21.96% | Negative profitability, net margin -3.93% and ROIC -1.47%, currently shedding value |
| Innovation | Consistent investment in technology and innovation sustaining market leadership | Improving innovation with growing ROIC, but still below profitability thresholds |
| Global presence | Extensive global footprint in semiconductor and adjacent markets | Global operations but narrower scope, focused on fabrication services |
| Market Share | Large market share in semiconductor equipment and services | Smaller market share; competing in a niche fabrication segment |
Key takeaways: AMAT stands out with strong profitability, diversification, and a solid global presence, though its ROIC trend is declining. GFS shows improving operational efficiency and innovation but remains unprofitable and less diversified, posing higher investment risks.
Risk Analysis
Below is a comparative risk table for Applied Materials, Inc. (AMAT) and GLOBALFOUNDRIES Inc. (GFS) based on the most recent data from 2025 and 2024.
| Metric | Applied Materials, Inc. (AMAT) | GLOBALFOUNDRIES Inc. (GFS) |
|---|---|---|
| Market Risk | Beta 1.67, high volatility | Beta 1.49, moderate volatility |
| Debt level | Low debt-to-equity 0.35 (favorable) | Low debt-to-equity 0.22 (favorable) |
| Regulatory Risk | Moderate, operates globally including China | Moderate, US-based with global operations |
| Operational Risk | Diversified manufacturing segments | Single segment foundry risk |
| Environmental Risk | Exposure due to semiconductor manufacturing processes | Similar exposure, but smaller scale |
| Geopolitical Risk | Significant, global supply chains including Asia | Moderate, US headquarters but global footprint |
Synthesis: Applied Materials shows stronger financial health and lower bankruptcy risk, but higher market volatility (beta 1.67). GLOBALFOUNDRIES faces operational risks with a negative net margin and weaker profitability, plus geopolitical pressures. Market and operational risks are most impactful, especially for GFS given its weaker financials and “grey zone” Altman Z-Score. Caution is advised with GFS; AMAT appears more stable for risk-averse investors.
Which Stock to Choose?
Applied Materials, Inc. (AMAT) shows a favorable income evolution with strong profitability and solid financial ratios, including a 34.28% ROE and low debt levels. Its overall rating is very favorable, supported by a slightly favorable MOAT despite a declining ROIC trend.
GLOBALFOUNDRIES Inc. (GFS) presents an unfavorable income statement with negative margins and weak profitability ratios, though its debt remains moderate. The company has a slightly unfavorable MOAT, reflecting value destruction, and a moderate overall rating despite some recent improvement in ROIC.
Investors with a risk-tolerant or growth-oriented profile may find AMAT’s strong profitability and favorable rating appealing, while those who might consider speculative or turnaround opportunities could view GFS’s improving ROIC and moderate rating as a potential signal, though with higher risk implied.
Disclaimer: Investment carries a risk of loss of initial capital. The past performance is not a reliable indicator of future results. Be sure to understand risks before making an investment decision.
Go Further
I encourage you to read the complete analyses of Applied Materials, Inc. and GLOBALFOUNDRIES Inc. to enhance your investment decisions: