In the fast-evolving semiconductor industry, Applied Materials, Inc. and CEVA, Inc. stand out for their unique innovation strategies and market roles. Applied Materials leads with cutting-edge manufacturing equipment, while CEVA specializes in licensing advanced wireless and AI processing technologies. Both companies overlap in the technology sector but address different facets of semiconductor advancement. This article will help you decide which company offers the most compelling investment opportunity in 2026.
Table of contents
Companies Overview
I will begin the comparison between Applied Materials and CEVA by providing an overview of these two companies and their main differences.
Applied Materials Overview
Applied Materials, Inc. provides manufacturing equipment, services, and software to the semiconductor and display industries. The company operates through three segments: Semiconductor Systems, Applied Global Services, and Display and Adjacent Markets. It holds a strong position in the global semiconductor equipment market with a market cap of 259B USD and employs around 36,000 people worldwide.
CEVA Overview
CEVA, Inc. is a licensor of wireless connectivity and smart sensing technologies to semiconductor and OEM companies. It designs and licenses digital signal processors, AI processors, and wireless platforms for applications such as 5G, IoT, and AI. CEVA has a market cap of approximately 555M USD and a workforce of about 406 employees, focusing on IP licensing rather than manufacturing.
Key similarities and differences
Both companies operate in the semiconductor sector and provide technology solutions, but their business models differ significantly. Applied Materials focuses on manufacturing equipment and services, while CEVA specializes in licensing intellectual property for wireless and smart sensing technologies. Applied Materials has a much larger market cap and employee base, reflecting its broader industrial footprint compared to CEVA’s specialized licensing model.
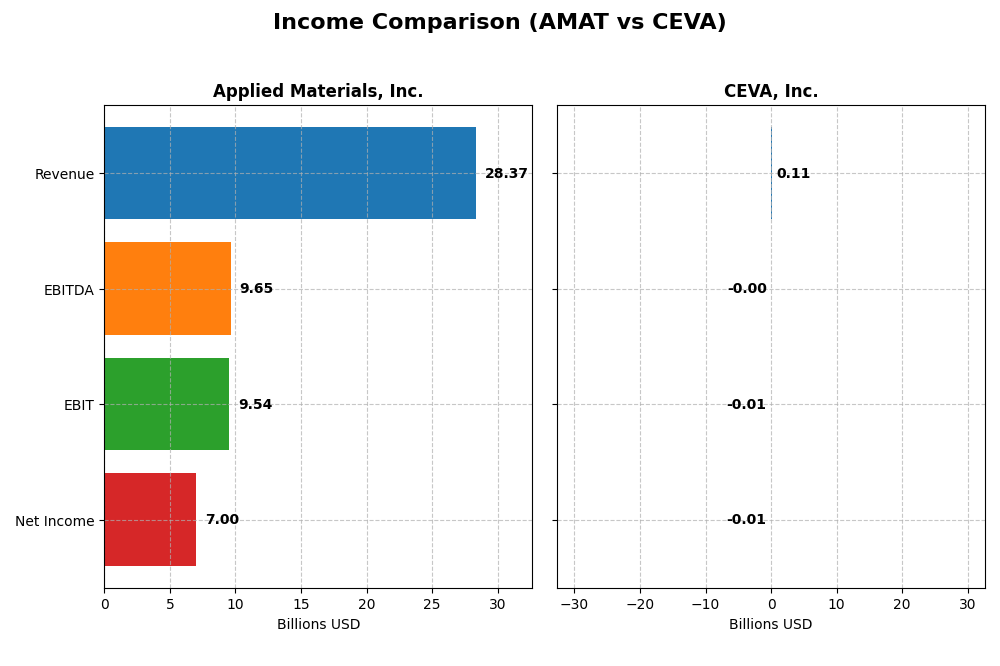
Income Statement Comparison
The table below presents a side-by-side comparison of key income statement metrics for Applied Materials, Inc. and CEVA, Inc. for their most recent fiscal years.
| Metric | Applied Materials, Inc. | CEVA, Inc. |
|---|---|---|
| Market Cap | 259.2B | 555.1M |
| Revenue | 28.37B | 107M |
| EBITDA | 9.65B | -3.41M |
| EBIT | 9.54B | -7.55M |
| Net Income | 7.00B | -8.79M |
| EPS | 8.71 | -0.37 |
| Fiscal Year | 2025 | 2024 |
Income Statement Interpretations
Applied Materials, Inc.
Applied Materials demonstrated a favorable growth trend from 2021 to 2025 with revenue rising by 23% and net income increasing by 18.85%. Gross and EBIT margins remained strong, around 48.7% and 33.6% respectively, although net margin showed a slight decline. In 2025, revenue growth slowed to 4.39%, while EBIT expanded by 13.58%, indicating operational efficiency gains despite a 6.59% dip in net margin.
CEVA, Inc.
CEVA’s revenue improved by 9.77% in 2024, continuing a moderate overall increase of 6.59% since 2020, but net income trends were unfavorable with a sharp decline of 269.31% over the period. The company reported a high gross margin of 88% but persistently negative EBIT and net margins. The recent year saw positive growth in EBIT by 43.97% and net margin by 32.62%, reflecting operational improvements despite ongoing losses.
Which one has the stronger fundamentals?
Applied Materials exhibits stronger fundamentals with consistent revenue and net income growth, favorable margins, and positive EPS development over five years. CEVA, while showing recent operational improvements, struggles with persistent net losses and negative margins, indicating weaker profitability and more volatility. Overall, Applied Materials presents a more stable and positive income statement profile.
Financial Ratios Comparison
The table below presents a side-by-side comparison of key financial ratios for Applied Materials, Inc. (AMAT) and CEVA, Inc. (CEVA) based on their most recent fiscal year data.
| Ratios | Applied Materials, Inc. (AMAT) | CEVA, Inc. (CEVA) |
|---|---|---|
| ROE | 34.3% | -3.3% |
| ROIC | 21.96% | -2.68% |
| P/E | 26.58 | -84.79 |
| P/B | 9.11 | 2.79 |
| Current Ratio | 2.61 | 7.09 |
| Quick Ratio | 1.87 | 7.09 |
| D/E (Debt-to-Equity) | 0.35 | 0.02 |
| Debt-to-Assets | 19.4% | 1.8% |
| Interest Coverage | 30.8 | 0 |
| Asset Turnover | 0.78 | 0.35 |
| Fixed Asset Turnover | 5.54 | 8.43 |
| Payout ratio | 19.8% | 0 |
| Dividend yield | 0.74% | 0 |
Interpretation of the Ratios
Applied Materials, Inc.
Applied Materials shows predominantly strong financial ratios in 2025, with favorable net margin (24.67%), ROE (34.28%), and ROIC (21.96%), indicating solid profitability and capital efficiency. Some valuation metrics like PE (26.58) and PB (9.11) appear high, which could concern investors. The company pays dividends with a modest yield of 0.74%, supported by consistent free cash flow, though the yield is considered low.
CEVA, Inc.
CEVA exhibits weak profitability ratios in 2024, including negative net margin (-8.22%) and ROE (-3.3%), reflecting operational challenges. Its liquidity appears mixed with a strong quick ratio (7.09) but an unfavorable current ratio. CEVA does not pay dividends, likely due to negative earnings and a focus on reinvestment and R&D, as indicated by high research and development expenses relative to revenue.
Which one has the best ratios?
Applied Materials presents a generally favorable ratio profile, especially in profitability and capital structure, despite some valuation concerns. In contrast, CEVA struggles with negative profitability and operational inefficiencies. Overall, Applied Materials holds the stronger and more stable financial ratios compared to CEVA’s unfavorable metrics in 2024.
Strategic Positioning
This section compares the strategic positioning of Applied Materials, Inc. and CEVA, Inc. including their market position, key segments, and exposure to technological disruption:
Applied Materials, Inc.
- Leading in semiconductor manufacturing equipment with high market cap and strong competitive presence.
- Diverse segments: Semiconductor Systems, Global Services, Display and Adjacent Markets driving revenue growth.
- Exposure to advanced semiconductor fabrication technology with risks from rapid innovation cycles.
CEVA, Inc.
- Smaller market cap, focused on licensing wireless connectivity and smart sensing IP technologies.
- Concentrated on licensing digital signal processors and AI platforms mainly for mobile and IoT markets.
- Exposure linked to evolving wireless and AI technologies, reliant on IP licensing agreements.
Applied Materials, Inc. vs CEVA, Inc. Positioning
Applied Materials pursues a diversified business model across manufacturing equipment and services, offering broad market coverage. CEVA concentrates on licensing smart sensing and connectivity IP, relying heavily on technology adoption and partner ecosystems, which may limit scale but focus innovation.
Which has the best competitive advantage?
Applied Materials holds a slightly favorable moat, creating value despite declining profitability. CEVA’s moat is very unfavorable, shedding value with sharply declining returns, reflecting challenges sustaining competitive advantage and profitability.
Stock Comparison
The past year reveals distinct price movements for Applied Materials, Inc. (AMAT) and CEVA, Inc. (CEVA), with AMAT showing significant gains and accelerating growth, while CEVA exhibits marginal overall growth but recent weakness.
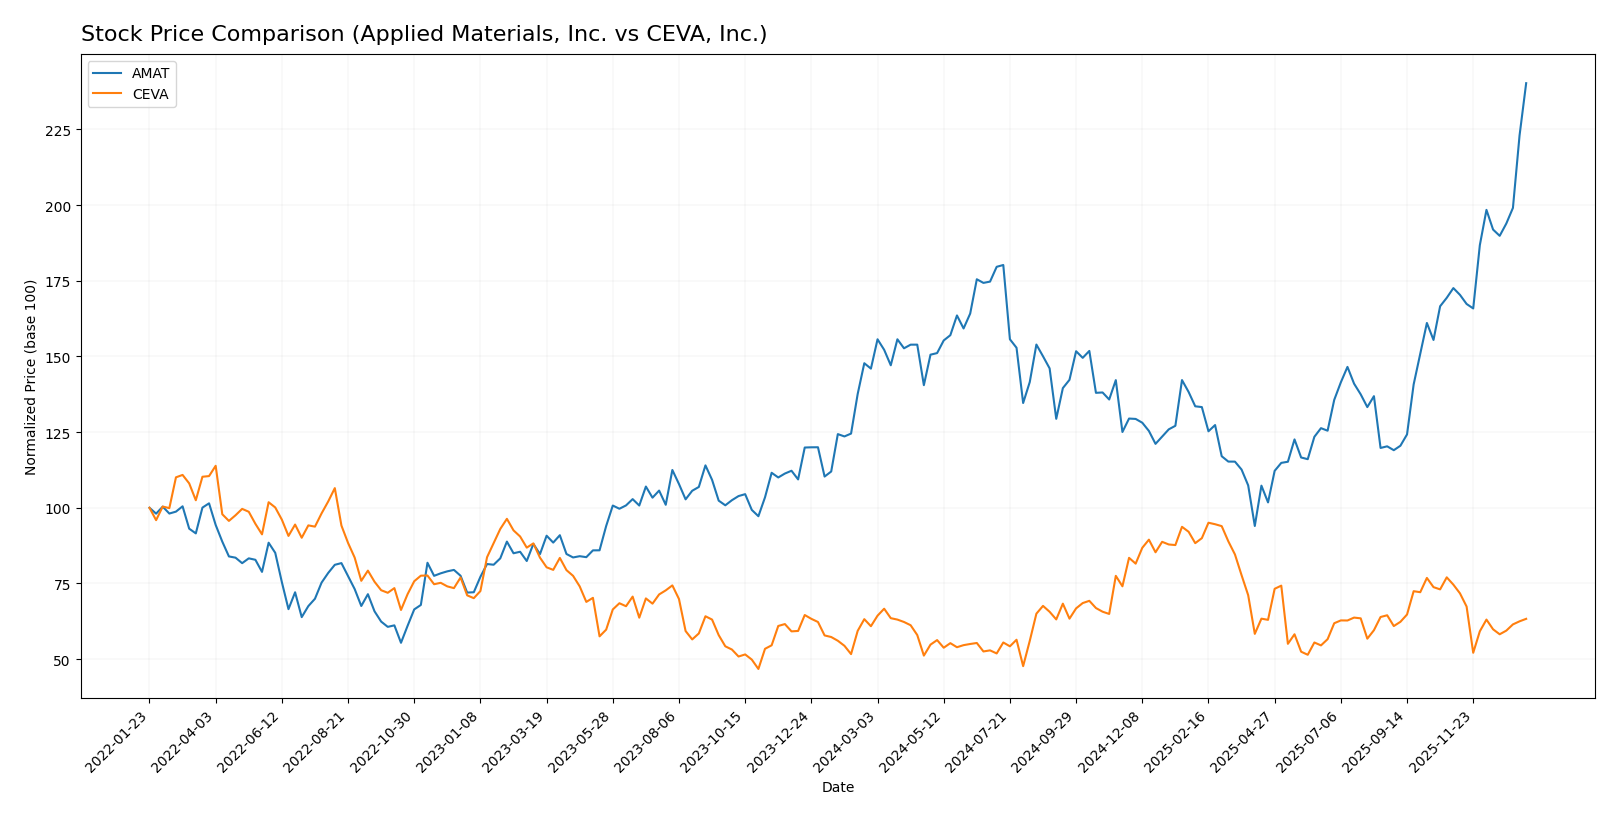
Trend Analysis
Applied Materials, Inc. (AMAT) experienced a strong bullish trend with a 64.6% price increase over the past 12 months, showing acceleration and notable volatility with a standard deviation of 34.62. The stock reached a high of 324.53 and a low of 126.95.
CEVA, Inc. (CEVA) recorded a modest overall bullish trend of 4.01% over the same period but with deceleration. Recent data show a 15.14% decline and lower volatility, indicating recent weakness despite an overall positive trend.
Comparing both, AMAT delivered the highest market performance with strong price appreciation and accelerating momentum, while CEVA’s stock showed limited gains and recent downward pressure.
Target Prices
The current analyst consensus presents a cautiously optimistic outlook for these semiconductor companies.
| Company | Target High | Target Low | Consensus |
|---|---|---|---|
| Applied Materials, Inc. | 400 | 273 | 327.71 |
| CEVA, Inc. | 28 | 28 | 28 |
Applied Materials’ target consensus of 327.71 is slightly above its current price of 325.40, indicating moderate upside potential. CEVA’s consensus target of 28 is notably higher than its current price of 23.11, suggesting a more bullish analyst expectation.
Analyst Opinions Comparison
This section compares analysts’ ratings and grades for Applied Materials, Inc. (AMAT) and CEVA, Inc. (CEVA):
Rating Comparison
AMAT Rating
- Rating: B+, considered Very Favorable overall.
- Discounted Cash Flow Score: 3, indicating a moderate valuation outlook.
- ROE Score: 5, showing very favorable profit generation from equity.
- ROA Score: 5, reflecting very favorable asset utilization.
- Debt To Equity Score: 2, moderate financial risk with some leverage.
- Overall Score: 3, a moderate overall financial standing.
CEVA Rating
- Rating: C+, considered Very Favorable overall.
- Discounted Cash Flow Score: 3, indicating a moderate valuation outlook.
- ROE Score: 1, reflecting very unfavorable profit generation from equity.
- ROA Score: 1, reflecting very unfavorable asset utilization.
- Debt To Equity Score: 4, favorable financial stability with lower leverage.
- Overall Score: 2, a moderate but lower overall financial standing than AMAT.
Which one is the best rated?
Based strictly on the provided data, AMAT holds a higher rating (B+) with very favorable ROE and ROA scores, while CEVA’s lower rating (C+) and weaker profitability metrics place it behind despite CEVA’s better debt-to-equity score.
Scores Comparison
Here is a comparison of the key financial scores for Applied Materials, Inc. and CEVA, Inc.:
Applied Materials, Inc. Scores
- Altman Z-Score: 13.45, indicating a safe zone status.
- Piotroski Score: 7, reflecting strong financial health.
CEVA, Inc. Scores
- Altman Z-Score: 9.99, indicating a safe zone status.
- Piotroski Score: 4, reflecting average financial health.
Which company has the best scores?
Applied Materials shows a higher Altman Z-Score and a stronger Piotroski Score compared to CEVA. Both are in the safe zone for bankruptcy risk, but Applied Materials demonstrates stronger financial health overall based strictly on these scores.
Grades Comparison
Here is a detailed comparison of the most recent grades assigned to Applied Materials, Inc. and CEVA, Inc.:
Applied Materials, Inc. Grades
The table below displays recent grades from established grading companies for Applied Materials, Inc.:
| Grading Company | Action | New Grade | Date |
|---|---|---|---|
| B of A Securities | Maintain | Buy | 2026-01-13 |
| Susquehanna | Upgrade | Positive | 2026-01-12 |
| Cantor Fitzgerald | Maintain | Overweight | 2026-01-08 |
| B. Riley Securities | Maintain | Buy | 2025-12-18 |
| Mizuho | Maintain | Neutral | 2025-12-17 |
| Wells Fargo | Maintain | Overweight | 2025-12-15 |
| Jefferies | Maintain | Buy | 2025-12-15 |
| Keybanc | Maintain | Overweight | 2025-12-02 |
| UBS | Upgrade | Buy | 2025-11-25 |
| B. Riley Securities | Maintain | Buy | 2025-11-14 |
Applied Materials shows a consistent positive outlook with multiple Buy and Overweight ratings, and recent upgrades indicating growing confidence.
CEVA, Inc. Grades
The table below displays recent grades from established grading companies for CEVA, Inc.:
| Grading Company | Action | New Grade | Date |
|---|---|---|---|
| Barclays | Maintain | Overweight | 2025-11-12 |
| Rosenblatt | Maintain | Buy | 2025-11-11 |
| Rosenblatt | Maintain | Buy | 2025-08-14 |
| Oppenheimer | Maintain | Outperform | 2025-05-09 |
| Rosenblatt | Maintain | Buy | 2025-05-08 |
| Barclays | Maintain | Overweight | 2025-05-08 |
| Rosenblatt | Maintain | Buy | 2025-04-23 |
| Barclays | Maintain | Overweight | 2025-02-14 |
| Rosenblatt | Maintain | Buy | 2025-02-14 |
| Rosenblatt | Maintain | Buy | 2025-02-11 |
CEVA has maintained stable Buy and Overweight ratings with an Outperform rating from Oppenheimer, indicating steady analyst support.
Which company has the best grades?
Applied Materials, Inc. has received more recent and frequent Buy and Overweight ratings, including upgrades, suggesting stronger analyst enthusiasm. CEVA, Inc.’s ratings are consistent but less recent and without upgrades. For investors, Applied Materials’ trend may reflect higher confidence and perceived growth potential.
Strengths and Weaknesses
Below is a comparative table highlighting the main strengths and weaknesses of Applied Materials, Inc. (AMAT) and CEVA, Inc. based on the most recent financial and operational data.
| Criterion | Applied Materials, Inc. (AMAT) | CEVA, Inc. |
|---|---|---|
| Diversification | Highly diversified with strong revenue from Semiconductor Systems (19.9B), Applied Global Services (6.2B), and Display markets (885M). | Narrower product base focused on licensing and royalties (~107M combined), less diversified. |
| Profitability | Strong profitability: Net margin 24.7%, ROIC 22%, ROE 34.3%. | Negative profitability: Net margin -8.2%, ROIC -2.7%, ROE -3.3%. |
| Innovation | Continuous investment in semiconductor tech; high fixed asset turnover (5.54) supports efficient asset use. | Innovation constrained by financial challenges; very unfavorable ROIC trend; limited scale. |
| Global presence | Significant global footprint in semiconductor equipment markets. | Smaller scale with limited global reach compared to AMAT. |
| Market Share | Leading market share in semiconductor equipment industry. | Smaller niche player, lower market share in semiconductor IP licensing. |
Key takeaways: AMAT demonstrates robust diversification, strong profitability, and a solid global presence though its ROIC has declined recently. CEVA struggles with profitability and value creation, reflecting higher risk for investors despite some operational strengths. Investors should weigh AMAT’s stability against CEVA’s challenges.
Risk Analysis
Below is a comparative overview of key risks for Applied Materials, Inc. (AMAT) and CEVA, Inc. as of the most recent fiscal years.
| Metric | Applied Materials, Inc. (AMAT) | CEVA, Inc. |
|---|---|---|
| Market Risk | High beta (1.67) indicating market sensitivity | Moderate beta (1.44), less volatile than AMAT |
| Debt Level | Moderate debt-to-equity (0.35), well-covered interest | Very low debt (0.02), minimal financial leverage |
| Regulatory Risk | Exposure to global semiconductor regulations, especially in China | Moderate, mainly IP licensing and export controls |
| Operational Risk | Large scale manufacturing equipment complexity | Dependency on licensing deals and IP protection |
| Environmental Risk | Manufacturing emissions and resource use risks | Lower direct environmental footprint |
| Geopolitical Risk | Significant exposure to Asia-Pacific tensions | Moderate, with reliance on global semiconductor supply chains |
The most impactful risk for AMAT is its market sensitivity combined with geopolitical tensions affecting its key Asian markets, which could disrupt supply chains and sales. CEVA faces operational and regulatory risks due to its licensing model and IP protection in a competitive tech environment. Both companies remain financially stable, but AMAT’s higher market beta suggests greater share price volatility.
Which Stock to Choose?
Applied Materials, Inc. (AMAT) shows a favorable income evolution with a 23% revenue growth over 2021–2025 and strong profitability metrics including a 24.67% net margin and 34.28% ROE. Its debt levels are well managed, supported by a 0.35 debt-to-equity ratio, and it holds a very favorable B+ rating.
CEVA, Inc. (CEVA) presents a mixed income profile with 9.77% revenue growth in the last year but overall negative net income growth over 2020–2024. Profitability ratios such as -8.22% net margin and -3.3% ROE remain unfavorable, despite low debt levels and a C+ rating that reflects moderate financial stability.
Investors prioritizing strong financial health and value creation may find AMAT’s favorable rating, consistent profitability, and value-creating moat more aligned with their profile. Conversely, those with a higher risk tolerance or focus on potential turnaround opportunities might interpret CEVA’s recent revenue growth and low leverage as signs to monitor cautiously.
Disclaimer: Investment carries a risk of loss of initial capital. The past performance is not a reliable indicator of future results. Be sure to understand risks before making an investment decision.
Go Further
I encourage you to read the complete analyses of Applied Materials, Inc. and CEVA, Inc. to enhance your investment decisions: