Broadcom Inc. and Applied Materials, Inc. are two powerhouse companies in the semiconductor industry, each driving innovation in different yet complementary segments. Broadcom focuses on semiconductor solutions and infrastructure software, while Applied Materials specializes in manufacturing equipment for chip production. Their market overlap and strategic approaches make this comparison crucial for investors seeking growth and stability in tech. Let’s explore which company offers the most compelling investment opportunity today.
Table of contents
Companies Overview
I will begin the comparison between Broadcom Inc. and Applied Materials, Inc. by providing an overview of these two companies and their main differences.
Broadcom Inc. Overview
Broadcom Inc. is a global technology company specializing in semiconductor and infrastructure software solutions. Headquartered in Palo Alto, California, it operates through four segments: Wired Infrastructure, Wireless Communications, Enterprise Storage, and Industrial & Other. Broadcom’s products serve diverse markets including data center networking, telecommunications, and factory automation, employing around 37,000 people worldwide.
Applied Materials, Inc. Overview
Applied Materials, Inc. delivers manufacturing equipment, services, and software to the semiconductor, display, and related industries. Based in Santa Clara, California, it operates three segments: Semiconductor Systems, Applied Global Services, and Display and Adjacent Markets. The company supports semiconductor chip fabrication and display technologies, with a workforce of approximately 36,000 employees and a global presence including the US, Asia, and Europe.
Key similarities and differences
Both Broadcom and Applied Materials operate in the semiconductor sector, focusing on enabling technology development. Broadcom emphasizes semiconductor devices and infrastructure software, while Applied Materials concentrates on manufacturing equipment and services for semiconductor and display production. Both companies maintain global operations and sizable workforces but differ in their core business models: product-driven solutions versus equipment and service offerings.
Income Statement Comparison
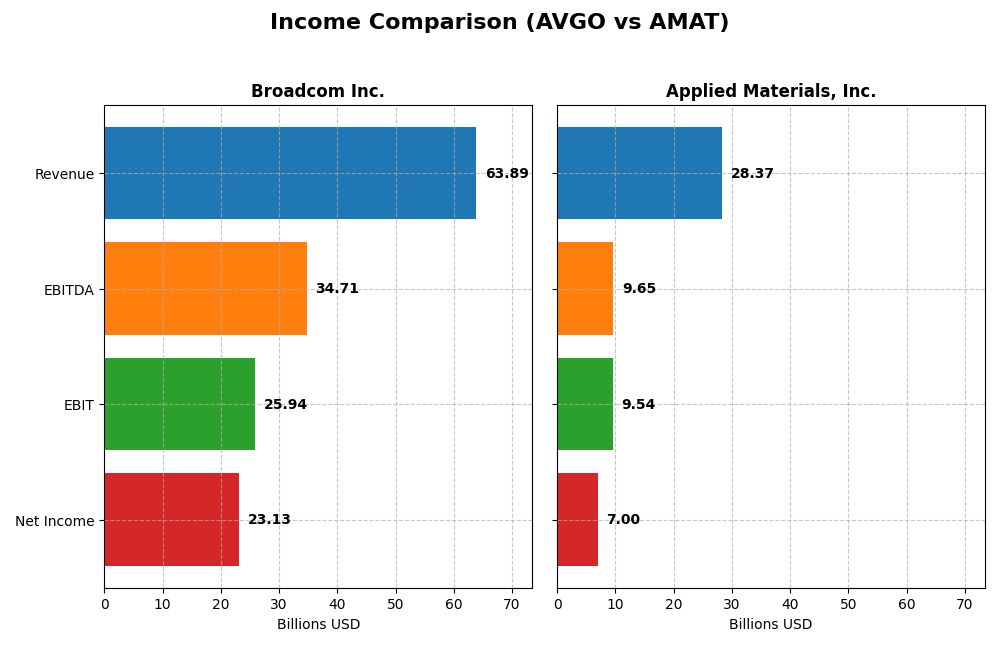
The table below compares the key income statement metrics of Broadcom Inc. and Applied Materials, Inc. for their most recent fiscal year, providing a snapshot of their financial performance.
| Metric | Broadcom Inc. (AVGO) | Applied Materials, Inc. (AMAT) |
|---|---|---|
| Market Cap | 1.60T | 240B |
| Revenue | 63.89B | 28.37B |
| EBITDA | 34.71B | 9.65B |
| EBIT | 25.94B | 9.54B |
| Net Income | 23.13B | 7.00B |
| EPS | 4.91 | 8.71 |
| Fiscal Year | 2025 | 2025 |
Income Statement Interpretations
Broadcom Inc.
Broadcom’s revenue and net income have shown robust growth from 2021 to 2025, with revenue rising from $27.5B to $63.9B and net income surging from $6.4B to $23.1B. Margins remained strong, with a gross margin of 67.8% and net margin of 36.2% in 2025. The latest year marked significant acceleration in earnings and margin expansion.
Applied Materials, Inc.
Applied Materials exhibited steady revenue growth from $23.1B in 2021 to $28.4B in 2025, with net income increasing moderately from $5.9B to $7.0B. Margins held favorably, though lower than Broadcom’s, with a 48.7% gross margin and 24.7% net margin in 2025. Recent growth slowed, and net margin declined slightly, reflecting mixed operational efficiency.
Which one has the stronger fundamentals?
Broadcom demonstrates stronger fundamentals, supported by higher margin levels and robust income growth across the period, including a sharp increase in net margin and EPS in 2025. Applied Materials shows favorable but more modest growth and margin compression, indicating comparatively less momentum in profitability and operational leverage.
Financial Ratios Comparison
The table below presents the most recent key financial ratios for Broadcom Inc. (AVGO) and Applied Materials, Inc. (AMAT) based on their fiscal year 2025 data, allowing a side-by-side overview of profitability, liquidity, leverage, and efficiency metrics.
| Ratios | Broadcom Inc. (AVGO) | Applied Materials, Inc. (AMAT) |
|---|---|---|
| ROE | 28.4% | 34.3% |
| ROIC | 16.4% | 22.0% |
| P/E | 73.9 | 26.6 |
| P/B | 21.0 | 9.1 |
| Current Ratio | 1.71 | 2.61 |
| Quick Ratio | 1.58 | 1.87 |
| D/E (Debt-to-Equity) | 0.80 | 0.35 |
| Debt-to-Assets | 38.1% | 19.4% |
| Interest Coverage | 7.94 | 30.8 |
| Asset Turnover | 0.37 | 0.78 |
| Fixed Asset Turnover | 25.3 | 5.54 |
| Payout Ratio | 48.2% | 19.8% |
| Dividend Yield | 0.65% | 0.74% |
Interpretation of the Ratios
Broadcom Inc.
Broadcom’s financial ratios show strength in profitability with a net margin of 36.2% and a return on equity of 28.45%, both favorable. Liquidity ratios like the current ratio at 1.71 are solid, yet valuation multiples such as P/E at 73.87 and P/B at 21.01 appear overstretched. The dividend yield is modest at 0.65%, indicating a cautious payout approach supported by free cash flow, though with some valuation risks.
Applied Materials, Inc.
Applied Materials exhibits generally favorable ratios, including a strong return on equity of 34.28% and a solid net margin of 24.67%. Its liquidity is robust, with a current ratio of 2.61 and a low debt-to-equity ratio of 0.35, reflecting prudent leverage. Despite a slightly elevated WACC of 11.37%, the company maintains a dividend yield of 0.74%, suggesting stable shareholder returns balanced against valuation concerns.
Which one has the best ratios?
Between the two, Applied Materials presents a more favorable overall ratio profile, with 64.29% of its key ratios rated favorable compared to Broadcom’s 50%. Applied Materials also benefits from stronger liquidity and leverage metrics, while Broadcom’s higher valuation multiples and lower dividend yield temper its appeal. The analysis favors Applied Materials based on these financial metrics alone.
Strategic Positioning
This section compares the strategic positioning of Broadcom Inc. and Applied Materials, Inc., including market position, key segments, and exposure to technological disruption:
Broadcom Inc.
- Market leader with $1.6T market cap facing moderate competition in semiconductors.
- Diverse segments: Infrastructure Software and Semiconductor Solutions drive revenue growth.
- Technological exposure includes complex semiconductor and infrastructure software solutions.
Applied Materials, Inc.
- Smaller $240B market cap with higher beta, exposed to competitive pressures.
- Focused on Semiconductor Systems, Applied Global Services, and Display markets.
- Exposure tied to semiconductor manufacturing equipment and display technologies.
Broadcom Inc. vs Applied Materials, Inc. Positioning
Broadcom has a diversified business model across software and semiconductors, offering broad market exposure. Applied Materials concentrates on semiconductor manufacturing equipment and display markets, providing specialized industry focus but less diversification.
Which has the best competitive advantage?
Broadcom shows a very favorable moat with growing ROIC above WACC, indicating durable competitive advantage. Applied Materials, while creating value, has a slightly favorable moat with declining ROIC, suggesting weaker profitability sustainability.
Stock Comparison
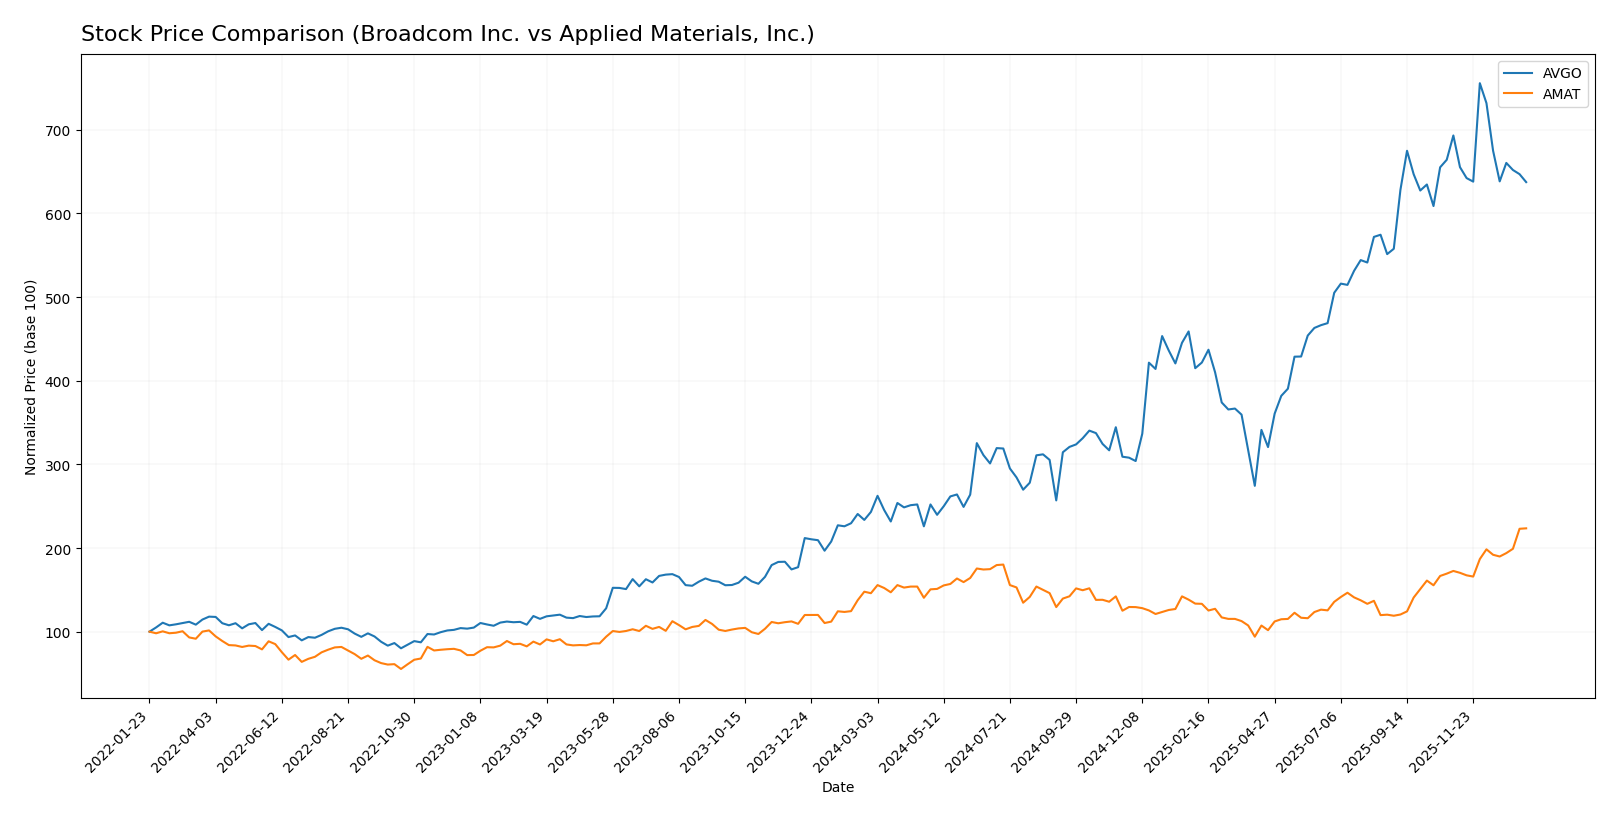
The stock price movements of Broadcom Inc. (AVGO) and Applied Materials, Inc. (AMAT) over the past 12 months reveal contrasting dynamics, with AVGO showing a strong overall rise but recent weakness, while AMAT exhibits steady acceleration in gains.
Trend Analysis
Broadcom Inc. (AVGO) experienced a bullish trend over the past year with a 162.18% price increase, though recent months show an 8.05% decline indicating deceleration and short-term bearishness. Volatility remains high with a 78.56 standard deviation.
Applied Materials, Inc. (AMAT) posted a 53.12% bullish gain over the same period, with accelerating momentum highlighted by a recent 29.51% increase. Volatility is moderate at a 33.84 standard deviation, supporting a sustained upward move.
Comparing both stocks, AVGO delivered higher overall market performance despite recent weakening, while AMAT’s trend shows consistent acceleration and recent positive momentum.
Target Prices
The current analyst consensus indicates a positive outlook for both Broadcom Inc. and Applied Materials, Inc.
| Company | Target High | Target Low | Consensus |
|---|---|---|---|
| Broadcom Inc. | 510 | 370 | 454.8 |
| Applied Materials, Inc. | 400 | 250 | 315.57 |
Analysts expect Broadcom’s stock to appreciate significantly from its current price of $339.89, while Applied Materials shows moderate upside potential compared to its current price of $301.89.
Analyst Opinions Comparison
This section compares analysts’ ratings and grades for Broadcom Inc. and Applied Materials, Inc.:
Rating Comparison
Broadcom Inc. Rating
- Rating: B, classified as Very Favorable by evaluators.
- Discounted Cash Flow Score: 3, indicating moderate valuation.
- ROE Score: 5, showing very favorable profitability level.
- ROA Score: 5, reflecting very efficient asset use.
- Debt To Equity Score: 1, marked as Very Unfavorable risk.
- Overall Score: 3, considered moderate overall rating.
Applied Materials, Inc. Rating
- Rating: B+, also classified as Very Favorable overall.
- Discounted Cash Flow Score: 3, similarly moderate value.
- ROE Score: 5, equally very favorable profitability.
- ROA Score: 5, also very efficient asset utilization.
- Debt To Equity Score: 2, a moderate level of financial risk.
- Overall Score: 3, also moderate overall rating.
Which one is the best rated?
Applied Materials holds a slightly better rating with a B+ versus Broadcom’s B. Both have identical overall, DCF, ROE, and ROA scores, but Applied Materials shows a moderately stronger debt-to-equity profile, indicating marginally lower financial risk.
Scores Comparison
The scores comparison between Broadcom Inc. (AVGO) and Applied Materials, Inc. (AMAT) includes the following financial health indicators:
AVGO Scores
- Altman Z-Score of 12.13, indicating a safe zone status.
- Piotroski Score of 8, classified as very strong financial health.
AMAT Scores
- Altman Z-Score of 13.45, indicating a safe zone status.
- Piotroski Score of 7, classified as strong financial health.
Which company has the best scores?
Both AVGO and AMAT fall within the safe zone for Altman Z-Score, with AMAT slightly higher. AVGO has a higher Piotroski Score, indicating very strong financial health compared to AMAT’s strong rating.
Grades Comparison
Here is a detailed comparison of the latest grades issued by recognized grading companies for Broadcom Inc. and Applied Materials, Inc.:
Broadcom Inc. Grades
The table below summarizes recent grades from reputable firms for Broadcom Inc.:
| Grading Company | Action | New Grade | Date |
|---|---|---|---|
| Mizuho | Maintain | Outperform | 2026-01-09 |
| Truist Securities | Maintain | Buy | 2025-12-19 |
| UBS | Maintain | Buy | 2025-12-15 |
| Benchmark | Maintain | Buy | 2025-12-12 |
| Rosenblatt | Maintain | Buy | 2025-12-12 |
| Piper Sandler | Maintain | Overweight | 2025-12-12 |
| TD Cowen | Maintain | Buy | 2025-12-12 |
| B of A Securities | Maintain | Buy | 2025-12-12 |
| JP Morgan | Maintain | Overweight | 2025-12-12 |
| Mizuho | Maintain | Outperform | 2025-12-12 |
Overall, Broadcom Inc. shows a strong consensus with multiple buy and outperform ratings consistently maintained by top-tier grading companies.
Applied Materials, Inc. Grades
Below is a summary table of recent grades for Applied Materials, Inc.:
| Grading Company | Action | New Grade | Date |
|---|---|---|---|
| B of A Securities | Maintain | Buy | 2026-01-13 |
| Susquehanna | Upgrade | Positive | 2026-01-12 |
| Cantor Fitzgerald | Maintain | Overweight | 2026-01-08 |
| B. Riley Securities | Maintain | Buy | 2025-12-18 |
| Mizuho | Maintain | Neutral | 2025-12-17 |
| Wells Fargo | Maintain | Overweight | 2025-12-15 |
| Jefferies | Maintain | Buy | 2025-12-15 |
| Keybanc | Maintain | Overweight | 2025-12-02 |
| UBS | Upgrade | Buy | 2025-11-25 |
| B. Riley Securities | Maintain | Buy | 2025-11-14 |
Applied Materials presents a mix of Buy, Overweight, and Neutral ratings, with some recent upgrades signaling a positive outlook but a slightly more varied consensus compared to Broadcom.
Which company has the best grades?
Both companies hold a consensus “Buy” rating, but Broadcom Inc. receives a more uniform set of strong Buy and Outperform ratings from multiple reputable firms. This consistency may reflect greater analyst confidence, potentially influencing investor perception of stability and growth prospects compared to the more mixed ratings seen for Applied Materials.
Strengths and Weaknesses
Below is a comparative table summarizing the strengths and weaknesses of Broadcom Inc. (AVGO) and Applied Materials, Inc. (AMAT) based on their diversification, profitability, innovation, global presence, and market share using the most recent data available.
| Criterion | Broadcom Inc. (AVGO) | Applied Materials, Inc. (AMAT) |
|---|---|---|
| Diversification | Strong diversification with two main segments: Infrastructure Software ($27B) and Semiconductor Solutions ($37B) in 2025. | Diversified across Applied Global Services ($6.2B), Semiconductor Systems ($19.9B), and Display markets ($0.9B) in 2024. |
| Profitability | High profitability: Net margin 36.2%, ROE 28.45%, ROIC 16.36%, with a very favorable economic moat and growing ROIC. | Solid profitability with net margin 24.7%, ROE 34.3%, ROIC 21.96%, but a declining ROIC trend and slightly favorable moat. |
| Innovation | Demonstrates durable competitive advantage with increasing profitability, reflecting strong innovation and efficient capital use. | Profitability is declining despite value creation, suggesting challenges in sustaining innovation momentum. |
| Global presence | Broadcom operates globally with strong market positions in semiconductor and software infrastructure sectors. | Well-established global footprint in semiconductor equipment and services with growing semiconductor systems revenue. |
| Market Share | Leading market positions in semiconductor solutions and infrastructure software, benefiting from large and growing revenue streams. | Significant market share in semiconductor equipment, supported by large segment revenues but slower growth in adjacent markets. |
Key takeaways: Broadcom shows superior profitability and a growing return on invested capital, indicating a very favorable competitive position. Applied Materials maintains strong profitability but faces a declining ROIC trend, suggesting caution despite solid market presence and diversified operations. Investors should weigh Broadcom’s robust growth and innovation against AMAT’s profitability challenges.
Risk Analysis
Below is a comparative table outlining key risk factors for Broadcom Inc. (AVGO) and Applied Materials, Inc. (AMAT) as of the most recent fiscal year 2025:
| Metric | Broadcom Inc. (AVGO) | Applied Materials, Inc. (AMAT) |
|---|---|---|
| Market Risk | Beta 1.22, moderate volatility | Beta 1.67, higher volatility |
| Debt level | Debt-to-Equity 0.8 (neutral) | Debt-to-Equity 0.35 (favorable) |
| Regulatory Risk | Moderate, global tech sector | Moderate, global tech sector |
| Operational Risk | Complex supply chains, firmware | Manufacturing equipment complexity |
| Environmental Risk | Moderate, exposure to energy sectors | Moderate, manufacturing emissions |
| Geopolitical Risk | Exposure to US-China tensions | Exposure to US-China tensions |
The most impactful risks are Broadcom’s elevated leverage and Applied Materials’ higher market volatility. Both face regulatory and geopolitical pressures due to global semiconductor supply chain dependencies, underscored by recent US-China trade tensions. Investors should weigh these risks against their risk tolerance.
Which Stock to Choose?
Broadcom Inc. (AVGO) has shown strong income growth with a 23.87% revenue increase in 2025 and a highly favorable net margin of 36.2%. Its financial ratios reveal strengths in ROE (28.45%) and ROIC (16.36%), with moderate debt levels and a very favorable overall rating of B.
Applied Materials, Inc. (AMAT) presents moderate income growth with 4.39% revenue growth in 2025 and a solid net margin of 24.67%. Its financial ratios indicate higher ROE (34.28%) and ROIC (21.96%) but slightly better debt metrics, supported by a very favorable rating of B+.
Investors seeking durable competitive advantages might see Broadcom’s very favorable moat and strong income statement as attractive, while those focused on financial stability and value creation could interpret Applied Materials’ higher ROE and lower debt as favorable. Growth-oriented investors may prefer Broadcom’s accelerating profitability, whereas risk-sensitive profiles might lean toward Applied Materials’ steadier balance sheet.
Disclaimer: Investment carries a risk of loss of initial capital. The past performance is not a reliable indicator of future results. Be sure to understand risks before making an investment decision.
Go Further
I encourage you to read the complete analyses of Broadcom Inc. and Applied Materials, Inc. to enhance your investment decisions: