In the rapidly evolving semiconductor industry, Applied Materials, Inc. (AMAT) and Astera Labs, Inc. (ALAB) stand out as key players shaping the future of technology. AMAT, a well-established giant, provides critical manufacturing equipment and services, while ALAB focuses on innovative connectivity solutions for cloud and AI infrastructure. This comparison explores their market overlap and innovation strategies to identify which company offers the most compelling investment opportunity for you.

Table of contents
Companies Overview
I will begin the comparison between Applied Materials, Inc. and Astera Labs, Inc. by providing an overview of these two companies and their main differences.
Applied Materials, Inc. Overview
Applied Materials, Inc. provides manufacturing equipment, services, and software primarily to the semiconductor, display, and related industries. It operates through three segments: Semiconductor Systems, Applied Global Services, and Display and Adjacent Markets. The company is a well-established player with a broad product portfolio supporting semiconductor fabrication and display manufacturing, headquartered in Santa Clara, CA, with a market cap of 260.6B USD.
Astera Labs, Inc. Overview
Astera Labs, Inc. designs and sells semiconductor-based connectivity solutions tailored for cloud and AI infrastructure. Its Intelligent Connectivity Platform offers data, network, and memory connectivity products built on a software-defined architecture to support scalable high-performance infrastructure. Founded in 2017 and also based in Santa Clara, CA, Astera Labs is a smaller firm with a market cap of 29.7B USD and a focus on emerging AI and cloud technologies.
Key similarities and differences
Both companies operate in the semiconductor industry and are based in Santa Clara, California, but they differ significantly in scale and market focus. Applied Materials has a diversified business model spanning manufacturing equipment and services for semiconductors and displays, while Astera Labs concentrates on connectivity solutions for cloud and AI infrastructure. Applied Materials is a mature industry leader with 36,000 employees, whereas Astera Labs is a younger, specialized company with 440 employees.
Income Statement Comparison
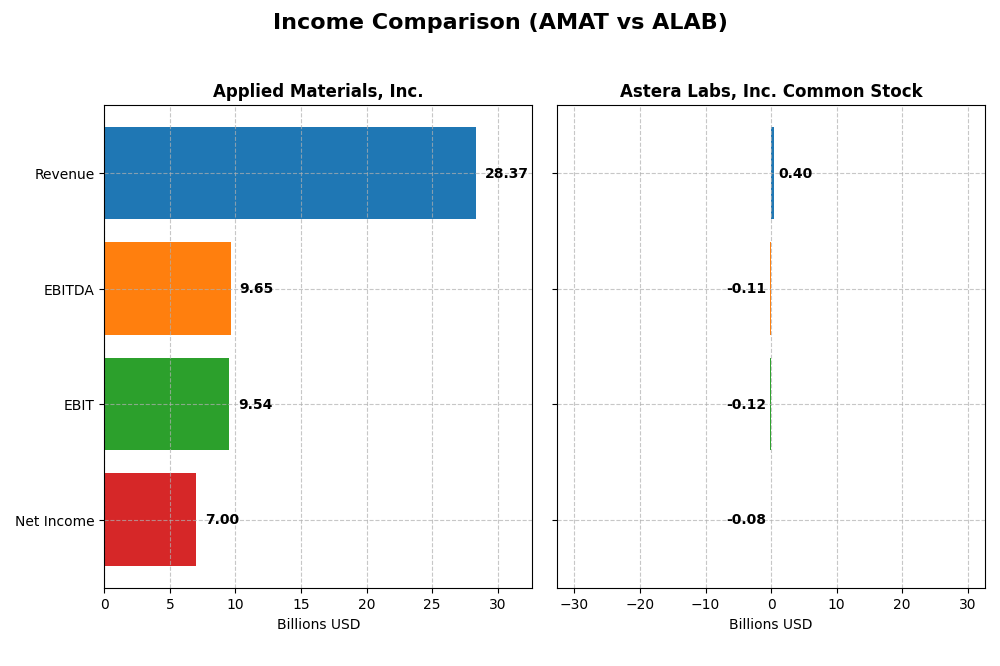
The table below compares key income statement metrics for Applied Materials, Inc. and Astera Labs, Inc. for their most recent fiscal years, providing a clear snapshot of their financial performance.
| Metric | Applied Materials, Inc. (AMAT) | Astera Labs, Inc. Common Stock (ALAB) |
|---|---|---|
| Market Cap | 261B | 29.7B |
| Revenue | 28.4B | 396M |
| EBITDA | 9.65B | -113M |
| EBIT | 9.54B | -116M |
| Net Income | 7.0B | -83.4M |
| EPS | 8.71 | -0.64 |
| Fiscal Year | 2025 | 2024 |
Income Statement Interpretations
Applied Materials, Inc.
Applied Materials experienced steady revenue growth from $23B in 2021 to $28.4B in 2025, with net income rising from $5.9B to $7B. Gross and EBIT margins remained strong and favorable, around 49% and 34% respectively. In 2025, revenue growth slowed to 4.4%, while net margin dipped slightly, signaling some margin pressure despite solid operating income growth.
Astera Labs, Inc. Common Stock
Astera Labs showed rapid revenue growth from $80M in 2022 to $396M in 2024, though net income remained negative, widening from -$58M to -$83M. Despite a high gross margin of 76%, EBIT and net margins were unfavorable, reflecting substantial operating losses. The latest year saw significant revenue acceleration but continued net losses and margin challenges persisted.
Which one has the stronger fundamentals?
Applied Materials demonstrates stronger fundamentals with consistent revenue and net income growth, favorable margins, and positive earnings per share trends over five years. Astera Labs, while growing rapidly in revenue, faces ongoing losses and negative margins. The balance of favorable to unfavorable indicators favors Applied Materials, reflecting a more stable profitability profile.
Financial Ratios Comparison
This table presents the most recent key financial ratios for Applied Materials, Inc. and Astera Labs, Inc., facilitating a straightforward side-by-side comparison for the fiscal year 2025.
| Ratios | Applied Materials, Inc. (AMAT) | Astera Labs, Inc. (ALAB) |
|---|---|---|
| ROE | 34.3% | -8.6% |
| ROIC | 22.0% | -12.0% |
| P/E | 26.6 | -208.4 |
| P/B | 9.11 | 18.02 |
| Current Ratio | 2.61 | 11.71 |
| Quick Ratio | 1.87 | 11.21 |
| D/E (Debt-to-Equity) | 0.35 | 0.0013 |
| Debt-to-Assets | 19.4% | 0.12% |
| Interest Coverage | 30.8 | 0 |
| Asset Turnover | 0.78 | 0.38 |
| Fixed Asset Turnover | 5.54 | 11.12 |
| Payout Ratio | 19.8% | 0 |
| Dividend Yield | 0.74% | 0 |
Interpretation of the Ratios
Applied Materials, Inc.
Applied Materials shows strong profitability with a net margin of 24.67%, a high ROE of 34.28%, and a solid ROIC at 21.96%, reflecting efficient capital use. Liquidity and leverage ratios such as a 2.61 current ratio and 0.35 debt-to-equity are favorable, though valuation metrics like P/E at 26.58 and P/B at 9.11 appear stretched. The company pays dividends with a low 0.74% yield, supported by free cash flow, posing limited risk of unsustainable payouts.
Astera Labs, Inc. Common Stock
Astera Labs struggles with negative profitability ratios, including a net margin of -21.05% and ROE of -8.65%, indicating ongoing losses. Despite a very high current ratio of 11.71, other operational metrics such as asset turnover (0.38) are weak. The company does not pay dividends, consistent with its high R&D spend and reinvestment focus typical for a growth-phase firm, with no share buybacks noted.
Which one has the best ratios?
Applied Materials exhibits a predominantly favorable financial profile, balancing profitability, liquidity, and leverage with some valuation caution. In contrast, Astera Labs presents an unfavorable ratio set dominated by losses and operational inefficiencies, reflecting its early-stage growth status without shareholder returns. Overall, Applied Materials holds the stronger ratio position.
Strategic Positioning
This section compares the strategic positioning of Applied Materials, Inc. (AMAT) and Astera Labs, Inc. (ALAB) across Market position, Key segments, and Exposure to technological disruption:
Applied Materials, Inc.
- Leading semiconductor equipment provider with a $260B market cap facing intense competition.
- Diverse segments: Semiconductor Systems, Applied Global Services, Display and Adjacent Markets drive revenues.
- Operates across multiple advanced technologies; potential exposure to rapid innovation cycles.
Astera Labs, Inc.
- Smaller firm with a $30B market cap, focusing on niche connectivity solutions.
- Concentrated portfolio in semiconductor connectivity solutions for cloud and AI infrastructure.
- Software-defined architecture supports scalable high-performance cloud and AI infrastructure.
Applied Materials, Inc. vs Astera Labs, Inc. Positioning
AMAT operates a diversified business model spanning multiple semiconductor manufacturing segments, offering broader revenue streams but greater complexity. ALAB’s concentrated focus on connectivity solutions targets growth markets but may limit diversification benefits.
Which has the best competitive advantage?
AMAT demonstrates a slightly favorable moat by creating value despite declining profitability, while ALAB shows a slightly unfavorable moat due to value destruction despite improving returns, indicating AMAT’s current advantage in sustaining economic profits.
Stock Comparison
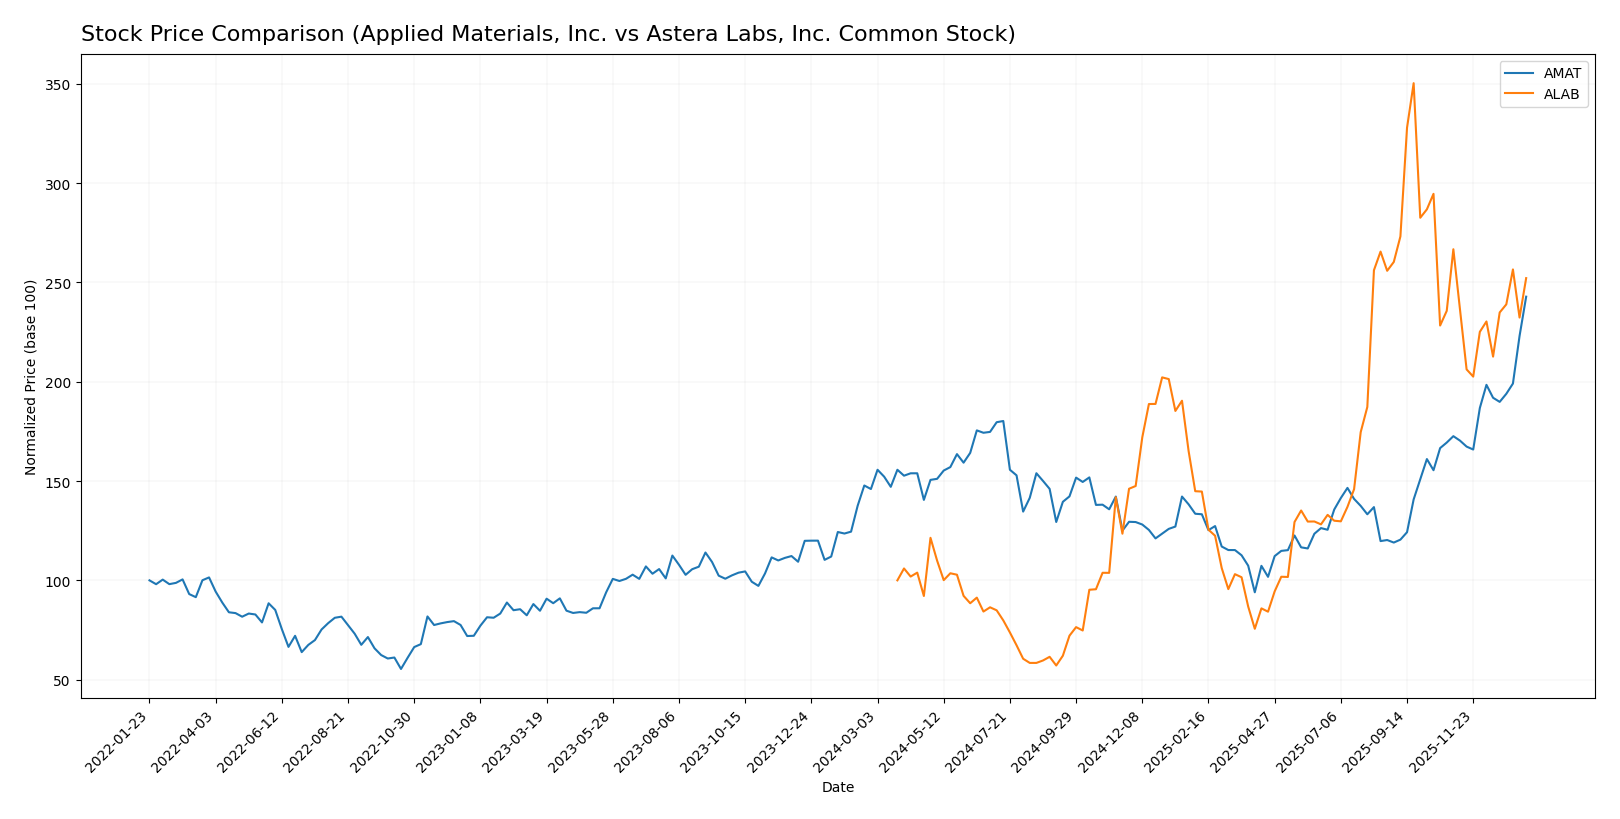
The stock price movements of Applied Materials, Inc. and Astera Labs, Inc. over the past year reveal significant divergences in growth trajectories and trading patterns, with Applied Materials showing sustained acceleration and Astera Labs facing recent deceleration.
Trend Analysis
Applied Materials, Inc. exhibits a strong bullish trend over the past 12 months with a 66.33% price increase, accelerated growth, and high volatility as shown by a 34.75 standard deviation. The stock reached a high of 327.94 and a low of 126.95.
Astera Labs, Inc. shows a higher overall bullish trend with a 152.16% rise over 12 months but with deceleration recently. The stock experienced higher volatility at 50.17 standard deviation, with a peak price of 245.2 and a low of 40.0, though recent performance declined by 5.45%.
Comparing both, Astera Labs delivered the highest market performance in price appreciation despite recent weakening, while Applied Materials maintained steady acceleration with slightly lower total gains.
Target Prices
The analyst consensus for target prices indicates a positive outlook for both Applied Materials, Inc. and Astera Labs, Inc.
| Company | Target High | Target Low | Consensus |
|---|---|---|---|
| Applied Materials, Inc. | 400 | 273 | 323.43 |
| Astera Labs, Inc. Common Stock | 225 | 165 | 202.14 |
Analysts expect Applied Materials’ price to hover slightly below its current 327.18 USD, while Astera Labs shows upside potential from its current 175.86 USD, reflecting moderate optimism for both stocks.
Analyst Opinions Comparison
This section compares analysts’ ratings and financial scores for Applied Materials, Inc. (AMAT) and Astera Labs, Inc. Common Stock (ALAB):
Rating Comparison
AMAT Rating
- Rating: B+, indicating a very favorable overall evaluation.
- Discounted Cash Flow Score: Moderate at 3, suggesting fair valuation.
- ROE Score: Very favorable at 5, showing high efficiency in generating profit from equity.
- ROA Score: Very favorable at 5, reflecting strong asset utilization.
- Debt To Equity Score: Moderate at 2, implying moderate financial risk.
- Overall Score: Moderate at 3, representing a balanced financial standing.
ALAB Rating
- Rating: B, also reflecting a very favorable overall evaluation.
- Discounted Cash Flow Score: Very unfavorable at 1, indicating potential overvaluation.
- ROE Score: Favorable at 4, indicating good profitability from equity.
- ROA Score: Very favorable at 5, matching AMAT in asset efficiency.
- Debt To Equity Score: Favorable at 4, indicating stronger balance sheet management.
- Overall Score: Moderate at 3, similarly indicating balanced financial health.
Which one is the best rated?
Based strictly on the data, AMAT holds a slightly better rating (B+) than ALAB (B), with stronger scores in discounted cash flow and return on equity. ALAB excels in debt management but has a notably weaker cash flow score.
Scores Comparison
Here is a comparison of the financial scores for Applied Materials, Inc. and Astera Labs, Inc. Common Stock:
AMAT Scores
- Altman Z-Score: 13.45, well within the safe zone
- Piotroski Score: 7, indicating strong financial health
ALAB Scores
- Altman Z-Score: 136.88, well within the safe zone
- Piotroski Score: 6, indicating average financial health
Which company has the best scores?
Based on the provided data, ALAB has a significantly higher Altman Z-Score than AMAT, both in the safe zone, but AMAT has a stronger Piotroski Score. The scores highlight differing strengths in financial stability and health.
Grades Comparison
Here is the comparison of grades from recognized grading companies for the two companies:
Applied Materials, Inc. Grades
The table below summarizes recent grades and actions from reputable grading firms for Applied Materials, Inc.:
| Grading Company | Action | New Grade | Date |
|---|---|---|---|
| B of A Securities | Maintain | Buy | 2026-01-13 |
| Susquehanna | Upgrade | Positive | 2026-01-12 |
| Cantor Fitzgerald | Maintain | Overweight | 2026-01-08 |
| B. Riley Securities | Maintain | Buy | 2025-12-18 |
| Mizuho | Maintain | Neutral | 2025-12-17 |
| Wells Fargo | Maintain | Overweight | 2025-12-15 |
| Jefferies | Maintain | Buy | 2025-12-15 |
| Keybanc | Maintain | Overweight | 2025-12-02 |
| UBS | Upgrade | Buy | 2025-11-25 |
| B. Riley Securities | Maintain | Buy | 2025-11-14 |
Applied Materials, Inc. shows a consistent pattern of Buy and Overweight ratings with occasional upgrades, reflecting generally positive analyst sentiment.
Astera Labs, Inc. Common Stock Grades
The table below presents recent grades and actions from verified grading firms for Astera Labs, Inc.:
| Grading Company | Action | New Grade | Date |
|---|---|---|---|
| Northland Capital Markets | Maintain | Outperform | 2025-12-09 |
| Northland Capital Markets | Upgrade | Outperform | 2025-11-17 |
| Stifel | Maintain | Buy | 2025-11-05 |
| Morgan Stanley | Maintain | Overweight | 2025-11-05 |
| Roth Capital | Maintain | Buy | 2025-11-05 |
| Needham | Maintain | Buy | 2025-11-05 |
| JP Morgan | Maintain | Overweight | 2025-11-05 |
| TD Cowen | Maintain | Hold | 2025-11-05 |
| Barclays | Downgrade | Equal Weight | 2025-10-20 |
| Stifel | Maintain | Buy | 2025-10-17 |
Astera Labs, Inc. displays mostly Buy and Outperform ratings, with one downgrade to Equal Weight, indicating a generally favorable but slightly more mixed analyst perspective.
Which company has the best grades?
Both companies have a consensus “Buy” rating, but Applied Materials, Inc. has a higher number of Buy and Overweight grades with fewer Hold ratings, suggesting stronger analyst conviction. This could imply relatively higher confidence in Applied Materials’ outlook by the analyst community, potentially influencing investor sentiment accordingly.
Strengths and Weaknesses
Below is a comparative overview of the key strengths and weaknesses of Applied Materials, Inc. (AMAT) and Astera Labs, Inc. Common Stock (ALAB) based on recent financial and operational data.
| Criterion | Applied Materials, Inc. (AMAT) | Astera Labs, Inc. Common Stock (ALAB) |
|---|---|---|
| Diversification | Highly diversified with three major segments: Semiconductor Systems ($19.9B), Applied Global Services ($6.2B), Display and Adjacent Markets ($0.9B) in 2024 | Limited diversification; primarily product-driven revenue ($393M) with minimal technology services ($3.2M) |
| Profitability | Strong profitability with net margin 24.67%, ROE 34.28%, ROIC 21.96% in 2025 | Negative profitability: net margin -21.05%, ROE -8.65%, ROIC -11.97% in 2024 |
| Innovation | Consistent investment in semiconductor technologies, though ROIC trend is declining (-28%) | Growing ROIC trend (+65%), indicating improving profitability potential despite current losses |
| Global presence | Established global footprint with large-scale operations and customer base | Smaller scale, likely more regionally focused with limited global reach |
| Market Share | Leading market position in semiconductor equipment with strong value creation (ROIC > WACC by 10.57%) | Early-stage or niche player shedding value (ROIC < WACC by -22.83%) but showing growth potential |
Key takeaways: AMAT exhibits strong diversification, solid profitability, and market leadership, but faces a declining ROIC trend signaling some pressure on returns. ALAB is currently unprofitable and less diversified but shows a promising upward trajectory in ROIC, suggesting improving operational efficiency and future growth potential. Investors should weigh AMAT’s stability against ALAB’s growth risks.
Risk Analysis
Below is a comparative table highlighting key risk metrics for Applied Materials, Inc. (AMAT) and Astera Labs, Inc. (ALAB) as of their latest fiscal years.
| Metric | Applied Materials, Inc. (AMAT) | Astera Labs, Inc. (ALAB) |
|---|---|---|
| Market Risk | Beta 1.67 (higher volatility) | Beta 1.51 (moderate volatility) |
| Debt level | Debt/Equity 0.35 (low) | Debt/Equity 0.0 (none) |
| Regulatory Risk | Moderate, global semiconductor regulations | Moderate, emerging semiconductor sector regulations |
| Operational Risk | Established operations, 36K employees | Small scale, 440 employees, higher operational scaling risk |
| Environmental Risk | Moderate, industry-related compliance | Moderate, startup phase environmental compliance |
| Geopolitical Risk | Exposure to US-China and Asia markets | Similar exposure with focus on cloud/AI markets |
The most impactful risks are market volatility and regulatory pressures in the semiconductor industry. AMAT shows strong financial stability mitigating debt risk, while ALAB faces higher operational and market risks due to its smaller size and negative profitability. Both have exposure to geopolitical tensions affecting supply chains.
Which Stock to Choose?
Applied Materials, Inc. (AMAT) shows steady income growth with a 23% revenue increase over five years and favorable profitability ratios, including a 24.7% net margin and 34.3% ROE. Its low debt levels and strong balance sheet support a very favorable B+ rating and a slightly favorable moat, despite a declining ROIC trend.
Astera Labs, Inc. (ALAB) exhibits rapid revenue growth of 396% overall but faces profitability challenges with a negative net margin of -21% and unfavorable returns on equity and invested capital. Its debt situation is conservative, reflected in a favorable debt ratio, and it holds a B rating with a slightly unfavorable moat but improving profitability.
Investors focused on stable profitability and established financial strength may find AMAT’s favorable income and ratio evaluations more reassuring, while those with a higher risk tolerance seeking rapid growth potential could interpret ALAB’s metrics as indicative of a developing opportunity amid current profitability struggles.
Disclaimer: Investment carries a risk of loss of initial capital. The past performance is not a reliable indicator of future results. Be sure to understand risks before making an investment decision.
Go Further
I encourage you to read the complete analyses of Applied Materials, Inc. and Astera Labs, Inc. Common Stock to enhance your investment decisions: