In the rapidly evolving semiconductor industry, Applied Materials, Inc. (AMAT) and Arm Holdings plc (ARM) stand out as influential players driving innovation. Applied Materials leads in manufacturing equipment and services, while Arm focuses on CPU architecture and licensing technology. Their complementary roles shape the future of technology, making them compelling choices for investors. This article will help you determine which company offers the most promising opportunity for your portfolio.
Table of contents
Companies Overview
I will begin the comparison between Applied Materials, Inc. and Arm Holdings plc by providing an overview of these two companies and their main differences.
Applied Materials, Inc. Overview
Applied Materials, Inc. provides manufacturing equipment, services, and software primarily to the semiconductor, display, and related industries. It operates through segments including Semiconductor Systems, Applied Global Services, and Display and Adjacent Markets. The company develops advanced technologies used in semiconductor fabrication and display manufacturing. Headquartered in Santa Clara, California, it employs 36,000 people and holds a significant market presence with a market cap of $260B.
Arm Holdings plc Overview
Arm Holdings plc architects, develops, and licenses CPU products and related technologies for semiconductor firms and OEMs. Its offerings include microprocessors, GPUs, physical and systems IP, software, and tools used in automotive, computing infrastructure, consumer technology, and IoT markets. Based in Cambridge, UK, Arm has 8,330 employees and a market capitalization of $114B. It operates globally and is a subsidiary of Kronos II LLC.
Key similarities and differences
Both companies operate in the semiconductor industry and serve global markets, but Applied Materials focuses on manufacturing equipment and services, while Arm specializes in designing and licensing semiconductor IP and software. Applied Materials has a broader product range including display technologies, whereas Arm concentrates on chip architecture and intellectual property. Their workforce sizes and market caps also differ substantially, reflecting distinct business models and operational scopes.
Income Statement Comparison
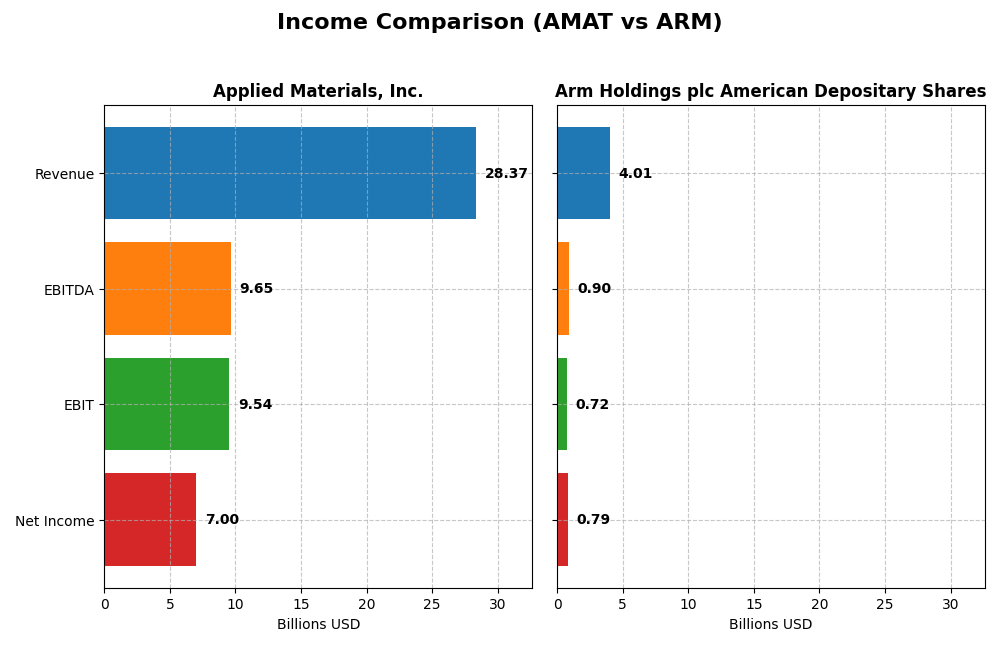
The table below compares the key income statement metrics for Applied Materials, Inc. and Arm Holdings plc for their most recent fiscal years, providing a snapshot of their financial performance.
| Metric | Applied Materials, Inc. | Arm Holdings plc American Depositary Shares |
|---|---|---|
| Market Cap | 260B | 114B |
| Revenue | 28.4B | 4.0B |
| EBITDA | 9.65B | 903M |
| EBIT | 9.54B | 720M |
| Net Income | 7.00B | 792M |
| EPS | 8.71 | 0.75 |
| Fiscal Year | 2025 | 2025 |
Income Statement Interpretations
Applied Materials, Inc.
Applied Materials exhibited steady revenue growth from 23.1B in 2021 to 28.4B in 2025, with net income rising from 5.9B to 7.0B in the same period. Gross and EBIT margins remained favorable at around 48.7% and 33.6%, respectively. The 2025 fiscal year showed slowed revenue growth (4.4%) and a slight dip in net margin, despite improved EBIT growth (13.6%).
Arm Holdings plc American Depositary Shares
Arm Holdings demonstrated rapid expansion, with revenue surging from 2.0B in 2021 to 4.0B in 2025 and net income doubling from 388M to 792M. Margins were notably strong, including a gross margin of 94.9% and a net margin near 19.8%. The latest year recorded strong growth across revenue (23.9%), net margin (108.8%), and EPS (158.6%), indicating accelerating profitability.
Which one has the stronger fundamentals?
Arm Holdings shows stronger growth dynamics with a 97.7% revenue increase and over 100% net income growth across five years, alongside very high gross margins. Applied Materials, while more mature with larger absolute earnings and stable margins, experienced slower growth and a slight net margin decline. Both companies maintain favorable income statement profiles, but Arm’s rapid expansion contrasts with Applied’s steady but more moderate improvement.
Financial Ratios Comparison
The table below presents a side-by-side comparison of key financial ratios for Applied Materials, Inc. (AMAT) and Arm Holdings plc American Depositary Shares (ARM), based on their most recent fiscal year data.
| Ratios | Applied Materials, Inc. (AMAT) 2025 | Arm Holdings plc (ARM) 2025 |
|---|---|---|
| ROE | 34.3% | 11.6% |
| ROIC | 21.9% | 10.3% |
| P/E | 26.6 | 141.6 |
| P/B | 9.11 | 16.4 |
| Current Ratio | 2.61 | 5.20 |
| Quick Ratio | 1.87 | 5.20 |
| D/E (Debt-to-Equity) | 0.35 | 0.05 |
| Debt-to-Assets | 19.4% | 4.0% |
| Interest Coverage | 30.8 | 0 |
| Asset Turnover | 0.78 | 0.45 |
| Fixed Asset Turnover | 5.54 | 5.61 |
| Payout Ratio | 19.8% | 0% |
| Dividend Yield | 0.74% | 0% |
Interpretation of the Ratios
Applied Materials, Inc.
Applied Materials exhibits a strong overall ratio profile, with favorable net margin at 24.67%, ROE at 34.28%, and ROIC at 21.96%. Its liquidity and solvency ratios, including a current ratio of 2.61 and debt to equity at 0.35, are also favorable. However, valuation metrics such as PE at 26.58 and PB at 9.11 are less attractive. The company pays dividends with a modest yield of 0.74%, supported by free cash flow, though the yield is considered low.
Arm Holdings plc American Depositary Shares
Arm’s ratios show mixed strength: a favorable net margin of 19.77% contrasts with weaker returns on equity (11.58%, neutral) and invested capital (10.28%, unfavorable). Its valuation multiples are high, with a PE of 141.58 and PB of 16.4, reflecting elevated market expectations. Liquidity is mixed; the quick ratio is favorable at 5.2, but the current ratio is unfavorable. Arm does not pay dividends, likely prioritizing reinvestment and growth.
Which one has the best ratios?
Applied Materials presents a more favorable ratio profile overall, with higher profitability, solid liquidity, and manageable leverage. Arm shows strengths in certain areas but is burdened by high valuation multiples and weaker returns. While Applied Materials offers modest dividends, Arm’s lack of payout aligns with its growth focus. Thus, Applied Materials currently demonstrates stronger financial health based on these ratios.
Strategic Positioning
This section compares the strategic positioning of Applied Materials and Arm Holdings, including market position, key segments, and exposure to technological disruption:
Applied Materials
- Leading equipment supplier with strong competitive pressure in semiconductors.
- Diverse segments: Semiconductor Systems, Global Services, Display and Adjacent Markets.
- Provides advanced manufacturing technologies; moderate exposure to disruption.
Arm Holdings
- Semiconductor IP licensor facing high beta and volatile market.
- Focused on CPU architecture, licensing, and royalties across multiple markets.
- Dependent on licensing model; exposed to shifts in semiconductor design trends.
Applied Materials vs Arm Holdings Positioning
Applied Materials has a diversified business model across manufacturing equipment and services, offering resilience. Arm Holdings concentrates on licensing and IP, which may limit revenue sources but focuses on innovation in chip design.
Which has the best competitive advantage?
Applied Materials shows a slightly favorable moat with value creation despite declining profitability. Arm Holdings has an unfavorable moat, consistently shedding value despite stable performance, indicating a weaker competitive advantage.
Stock Comparison
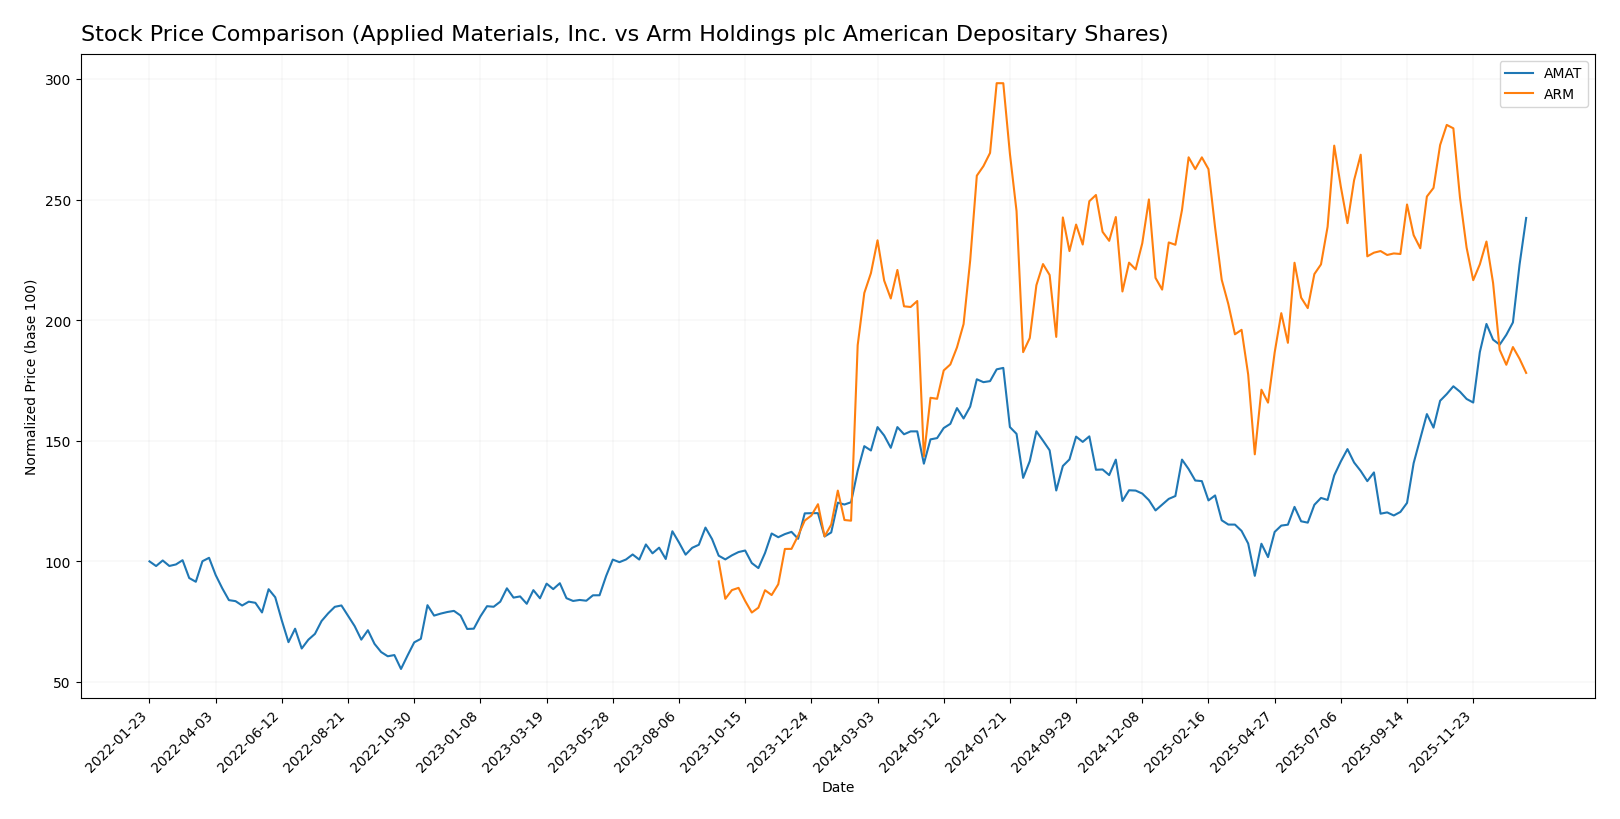
Over the past year, Applied Materials, Inc. (AMAT) demonstrated a pronounced bullish trend with significant price acceleration, while Arm Holdings plc (ARM) experienced a sustained bearish trend marked by deceleration and notable price decline.
Trend Analysis
Applied Materials, Inc. showed a strong bullish trend with a 66.04% price increase over the past 12 months, supported by accelerating momentum and a high volatility measured by a 34.73 std deviation.
Arm Holdings plc displayed a bearish trend with an 18.84% price decline over the same period, accompanied by deceleration and lower volatility at 19.26 std deviation.
Comparing both, AMAT delivered the highest market performance, significantly outperforming ARM’s negative price movement over the past year.
Target Prices
The current analyst consensus for target prices indicates a positive outlook for both Applied Materials, Inc. and Arm Holdings plc.
| Company | Target High | Target Low | Consensus |
|---|---|---|---|
| Applied Materials, Inc. | 400 | 273 | 323.43 |
| Arm Holdings plc American Depositary Shares | 210 | 120 | 166 |
Analysts expect Applied Materials’ price to slightly increase from its current 326.60 USD, while Arm Holdings shows potential for significant upside from 108.36 USD, reflecting optimism in both semiconductor companies’ growth prospects.
Analyst Opinions Comparison
This section compares analysts’ ratings and grades for Applied Materials, Inc. (AMAT) and Arm Holdings plc American Depositary Shares (ARM):
Rating Comparison
AMAT Rating
- Rating: B+ indicating a very favorable assessment of financial strength and performance.
- Discounted Cash Flow Score: Moderate score of 3, suggesting fair valuation based on cash flow.
- ROE Score: Very favorable score of 5, showing strong profit generation from equity.
- ROA Score: Very favorable score of 5, demonstrating effective asset utilization.
- Debt To Equity Score: Moderate score of 2, suggesting moderate financial leverage risk.
- Overall Score: Moderate score of 3, reflecting balanced financial health and performance.
ARM Rating
- Rating: B indicating a very favorable but slightly lower overall financial assessment.
- Discounted Cash Flow Score: Moderate score of 3, reflecting similar valuation considerations.
- ROE Score: Moderate score of 3, indicating average efficiency in generating equity returns.
- ROA Score: Favorable score of 4, indicating good but less effective asset use than AMAT.
- Debt To Equity Score: Favorable score of 4, indicating a stronger balance sheet with less debt.
- Overall Score: Moderate score of 3, also indicating balanced but slightly different financials.
Which one is the best rated?
AMAT holds a higher rating (B+) compared to ARM’s B, with stronger scores in return on equity and assets. ARM shows better debt management but overall scores are equal at 3, making AMAT slightly better rated based on the provided data.
Scores Comparison
Here is a comparison of the Altman Z-Score and Piotroski Score for the two companies:
AMAT Scores
- Altman Z-Score: 13.45, indicating a safe zone risk
- Piotroski Score: 7, reflecting strong financial health
ARM Scores
- Altman Z-Score: 32.43, indicating a safe zone risk
- Piotroski Score: 7, reflecting strong financial health
Which company has the best scores?
Both AMAT and ARM are in the safe zone for Altman Z-Score and share the same strong Piotroski Score of 7. ARM’s Altman Z-Score is notably higher, suggesting comparatively stronger financial stability based on this metric.
Grades Comparison
The following analysis compares the recent grades and rating trends for Applied Materials, Inc. and Arm Holdings plc American Depositary Shares:
Applied Materials, Inc. Grades
This table presents recent grades from notable grading companies for Applied Materials, Inc.:
| Grading Company | Action | New Grade | Date |
|---|---|---|---|
| B of A Securities | Maintain | Buy | 2026-01-13 |
| Susquehanna | Upgrade | Positive | 2026-01-12 |
| Cantor Fitzgerald | Maintain | Overweight | 2026-01-08 |
| B. Riley Securities | Maintain | Buy | 2025-12-18 |
| Mizuho | Maintain | Neutral | 2025-12-17 |
| Wells Fargo | Maintain | Overweight | 2025-12-15 |
| Jefferies | Maintain | Buy | 2025-12-15 |
| Keybanc | Maintain | Overweight | 2025-12-02 |
| UBS | Upgrade | Buy | 2025-11-25 |
| B. Riley Securities | Maintain | Buy | 2025-11-14 |
Overall, Applied Materials maintains a predominantly positive outlook with multiple Buy and Overweight grades and few Neutral ratings, reflecting strong analyst confidence.
Arm Holdings plc American Depositary Shares Grades
This table presents recent grades from notable grading companies for Arm Holdings plc ADS:
| Grading Company | Action | New Grade | Date |
|---|---|---|---|
| B of A Securities | Downgrade | Neutral | 2026-01-13 |
| B of A Securities | Maintain | Buy | 2025-12-16 |
| Goldman Sachs | Downgrade | Sell | 2025-12-15 |
| Loop Capital | Maintain | Buy | 2025-11-12 |
| TD Cowen | Maintain | Buy | 2025-11-06 |
| Rosenblatt | Maintain | Buy | 2025-11-06 |
| Wells Fargo | Maintain | Overweight | 2025-11-06 |
| Mizuho | Maintain | Outperform | 2025-11-06 |
| Barclays | Maintain | Overweight | 2025-11-06 |
| UBS | Maintain | Buy | 2025-11-06 |
Arm Holdings shows a mixed grade trend with several Buy and Overweight ratings but also recent downgrades including a Sell from Goldman Sachs, indicating some analyst caution.
Which company has the best grades?
Applied Materials has received more consistent Buy and Overweight grades compared to Arm Holdings, which shows a wider range from Buy to Sell. This difference may affect investor confidence and risk perception when evaluating these stocks.
Strengths and Weaknesses
Below is a comparison of Applied Materials, Inc. (AMAT) and Arm Holdings plc (ARM) highlighting their key strengths and weaknesses based on the most recent data.
| Criterion | Applied Materials, Inc. (AMAT) | Arm Holdings plc (ARM) |
|---|---|---|
| Diversification | Strong diversification with Semiconductor Systems (19.9B), Applied Global Services (6.23B), and Display Markets (885M) revenues | Less diversified, mainly License and Royalty revenues totaling ~4B USD |
| Profitability | High profitability: net margin 24.67%, ROE 34.28%, ROIC 21.96% | Moderate profitability: net margin 19.77%, ROE 11.58%, ROIC 10.28% |
| Innovation | Strong innovation indicated by high fixed asset turnover (5.54) and significant R&D investment in semiconductor tech | Innovation focus on IP licensing and royalties, but high P/E (141.58) signals market expectations not yet fully justified by profits |
| Global presence | Well-established global footprint with diverse end markets in semiconductors and services | Global reach via licensing, but less diversified operational footprint |
| Market Share | Leading in semiconductor equipment with consistent revenue growth | Strong in semiconductor IP licensing but currently value-destroying (ROIC < WACC) |
In summary, Applied Materials shows robust profitability, diversification, and efficient capital use, though its ROIC has declined recently. Arm Holdings, while innovative and globally recognized for IP licensing, currently struggles with profitability and value creation, suggesting higher risk for investors.
Risk Analysis
Below is a comparison table highlighting key risk factors for Applied Materials, Inc. (AMAT) and Arm Holdings plc (ARM) based on the most recent 2025 data:
| Metric | Applied Materials, Inc. (AMAT) | Arm Holdings plc (ARM) |
|---|---|---|
| Market Risk | Beta 1.67, moderate volatility | Beta 4.36, high volatility |
| Debt Level | Debt/Equity 0.35, moderate | Debt/Equity 0.05, very low |
| Regulatory Risk | Moderate due to global operations | Moderate, exposure to UK, US, China regulations |
| Operational Risk | Diverse segments, strong services | Focused on IP licensing, less operational complexity |
| Environmental Risk | Exposure to manufacturing emissions | Lower, primarily IP business |
| Geopolitical Risk | Significant presence in Asia-Pacific | Exposure to multiple countries including China |
The most impactful risks are ARM’s high market volatility (beta 4.36) and stretched valuation (P/E 141.58) alongside regulatory exposures in geopolitically sensitive regions. AMAT shows balanced financial health with manageable leverage but faces operational and environmental risks from its manufacturing footprint. Both companies remain in safe financial zones, yet investors should weigh ARM’s valuation and volatility carefully.
Which Stock to Choose?
Applied Materials, Inc. (AMAT) shows steady income growth with favorable profitability ratios including a 24.67% net margin and 34.28% ROE. The company maintains low debt levels, strong liquidity, and a very favorable overall rating of B+. Its economic moat is slightly favorable, indicating value creation despite a declining ROIC trend.
Arm Holdings plc (ARM) exhibits impressive revenue and net income growth, supported by a high gross margin of 94.86%. However, its profitability ratios are weaker, with a modest 11.58% ROE and an unfavorable ROIC compared to WACC, signaling value destruction. ARM’s debt is low, but its overall ratios and rating (B) are slightly unfavorable.
Investors prioritizing stable profitability and strong value creation might find AMAT’s financial profile more appealing, while those seeking high growth potential despite higher valuation risks could view ARM’s performance differently. The choice could depend on tolerance for risk and investment strategy preferences.
Disclaimer: Investment carries a risk of loss of initial capital. The past performance is not a reliable indicator of future results. Be sure to understand risks before making an investment decision.
Go Further
I encourage you to read the complete analyses of Applied Materials, Inc. and Arm Holdings plc American Depositary Shares to enhance your investment decisions: