In the dynamic energy sector, Texas Pacific Land Corporation (TPL) and APA Corporation (APA) stand out as two influential players with distinct yet overlapping business models. Both companies operate primarily in oil and gas exploration and production, with TPL focusing on land and resource management in the Permian Basin, while APA emphasizes global exploration and pipeline assets. This article will analyze their strategies and performance to help you decide which stock could be the smarter addition to your portfolio.

Table of contents
Companies Overview
I will begin the comparison between Texas Pacific Land Corporation and APA Corporation by providing an overview of these two companies and their main differences.
Texas Pacific Land Corporation Overview
Texas Pacific Land Corporation focuses on land and resource management alongside water services and operations. Managing about 880,000 acres, it holds various nonparticipating perpetual oil and gas royalty interests under large land areas in western Texas. The company also leases land for infrastructure and commercial activities and provides comprehensive water services in the Permian Basin. Founded in 1888 and headquartered in Dallas, it operates within the energy sector with 111 employees.
APA Corporation Overview
APA Corporation is engaged in exploration, development, and production of oil and gas properties with operations in the United States, Egypt, the UK, and offshore Suriname. It also manages gathering, processing, and transmission assets in West Texas and holds stakes in multiple Permian-to-Gulf Coast pipelines. Founded in 1954, APA is based in Houston and operates in the energy sector with a workforce of 2,305 employees.
Key similarities and differences
Both companies operate in the oil and gas exploration and production industry, primarily in the United States with a focus on the Permian Basin region. Texas Pacific Land emphasizes land management and water services, holding royalty interests, whereas APA concentrates on upstream oil and gas production and midstream assets like pipelines. The scale of operations differs, with APA having a significantly larger workforce and broader geographic reach.
Income Statement Comparison
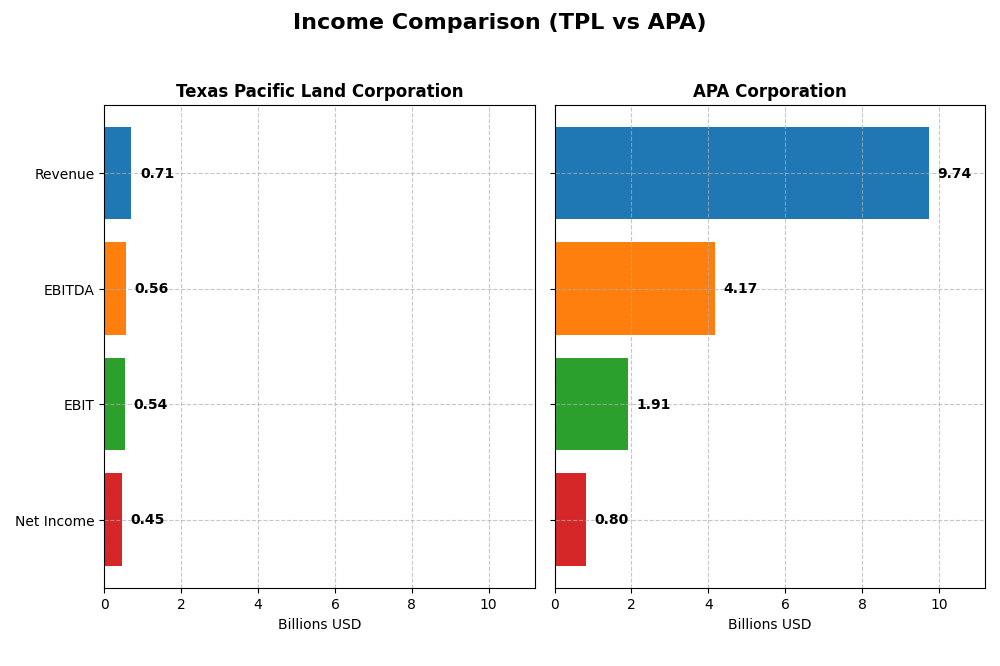
The following table compares key income statement metrics for Texas Pacific Land Corporation and APA Corporation for the fiscal year 2024, providing a snapshot of their financial performance.
| Metric | Texas Pacific Land Corporation | APA Corporation |
|---|---|---|
| Market Cap | 21.5B | 8.9B |
| Revenue | 706M | 9.74B |
| EBITDA | 564M | 4.17B |
| EBIT | 539M | 1.91B |
| Net Income | 454M | 804M |
| EPS | 6.58 | 2.28 |
| Fiscal Year | 2024 | 2024 |
Income Statement Interpretations
Texas Pacific Land Corporation
Texas Pacific Land Corporation (TPL) exhibited strong revenue growth from 2020 to 2024, increasing from $303M to $706M, with net income rising from $176M to $454M. Margins remained robust and stable, with gross margin at 89.9% and net margin at 64.3% in 2024. The latest year showed favorable revenue growth of 11.75%, and margins held steady, reflecting solid operational efficiency.
APA Corporation
APA Corporation (APA) experienced significant revenue growth between 2020 and 2024, from $4.4B to $9.7B, alongside net income growth from a loss of $4.8B in 2020 to $804M in 2024. However, margins are considerably lower than TPL’s, with a 44.2% gross margin and 8.3% net margin in 2024. The recent year saw favorable revenue growth of 17.6%, but a marked decline in EBIT and net margin, indicating pressure on profitability.
Which one has the stronger fundamentals?
TPL’s income statement reflects consistently high margins, stable growth, and favorable margin improvements, showcasing strong fundamentals. APA, while showing recovery and revenue growth, faces margin compression and unfavorable EBIT and net margin trends recently. Overall, TPL demonstrates more robust and stable income fundamentals compared to APA’s more volatile profitability profile.
Financial Ratios Comparison
The table below presents the key financial ratios for Texas Pacific Land Corporation (TPL) and APA Corporation (APA) for the fiscal year 2024, highlighting profitability, liquidity, leverage, efficiency, and dividend metrics.
| Ratios | Texas Pacific Land Corp (TPL) | APA Corporation (APA) |
|---|---|---|
| ROE | 40.1% | 15.2% |
| ROIC | 35.6% | 14.0% |
| P/E | 18.7 | 10.1 |
| P/B | 7.48 | 1.54 |
| Current Ratio | 8.33 | 1.15 |
| Quick Ratio | 8.33 | 1.01 |
| D/E | 0.0004 | 1.17 |
| Debt-to-Assets | 0.04% | 31.8% |
| Interest Coverage | 0 (no interest expense) | 8.44 |
| Asset Turnover | 0.57 | 0.50 |
| Fixed Asset Turnover | 1.27 | 0.77 |
| Payout ratio | 76.5% | 43.9% |
| Dividend yield | 4.10% | 4.33% |
Interpretation of the Ratios
Texas Pacific Land Corporation
Texas Pacific Land Corporation demonstrates strong profitability with a net margin of 64.32% and a return on equity of 40.09%, both favorable indicators. However, the company shows some weaknesses, such as an unfavorable price-to-book ratio of 7.48 and a high current ratio of 8.33, which may suggest inefficiencies in asset utilization. It pays dividends with a healthy yield of 4.1%, supported by solid free cash flow coverage, though investors should monitor the balance between dividend payouts and buyback programs to avoid unsustainable distributions.
APA Corporation
APA Corporation’s ratios present a mixed picture with favorable returns on equity (15.23%) and invested capital (14.03%), yet a modest net margin of 8.26% rated neutral. Its debt-to-equity ratio of 1.17 is unfavorable, indicating higher leverage risk, while liquidity ratios remain neutral to favorable. APA pays dividends with a 4.33% yield, but its free cash flow is negative, suggesting the dividend payments and potential buybacks rely on external financing or operational improvements in the future.
Which one has the best ratios?
Texas Pacific Land Corporation holds a more favorable overall ratio profile with higher profitability, better leverage metrics, and strong dividend sustainability. APA Corporation shows some strengths in return metrics and dividend yield but faces challenges with higher debt levels and weaker cash flow coverage. The more balanced financial health of Texas Pacific Land supports its more favorable global ratios evaluation compared to APA’s slightly favorable rating.
Strategic Positioning
This section compares the strategic positioning of Texas Pacific Land Corporation and APA Corporation, including market position, key segments, and exposure to technological disruption:
Texas Pacific Land Corporation
- Market leader in land/resource management with limited competition in Permian Basin land rights
- Key segments include land and resource management, water services, and royalties from hydrocarbons
- Exposure primarily through land royalties and water services, less direct operational risk from tech disruption
APA Corporation
- Mid-sized oil and gas producer facing competitive pressures in multiple regions
- Focused on oil and gas exploration, production, and pipeline assets in US, Egypt, UK, and Suriname
- Operational exposure to exploration and production technology and pipeline infrastructure
Texas Pacific Land Corporation vs APA Corporation Positioning
Texas Pacific Land operates a diversified business model focused on land royalties and water services, benefiting from a unique asset base, while APA concentrates on upstream oil and gas production and infrastructure, exposing it to commodity cycles. The diversification of Texas Pacific Land offers stable revenue streams compared to APA’s operational complexity.
Which has the best competitive advantage?
Both companies demonstrate a very favorable economic moat with growing ROIC, but Texas Pacific Land’s stable royalty and land management model suggests a more durable competitive advantage compared to APA’s asset-heavy production operations.
Stock Comparison
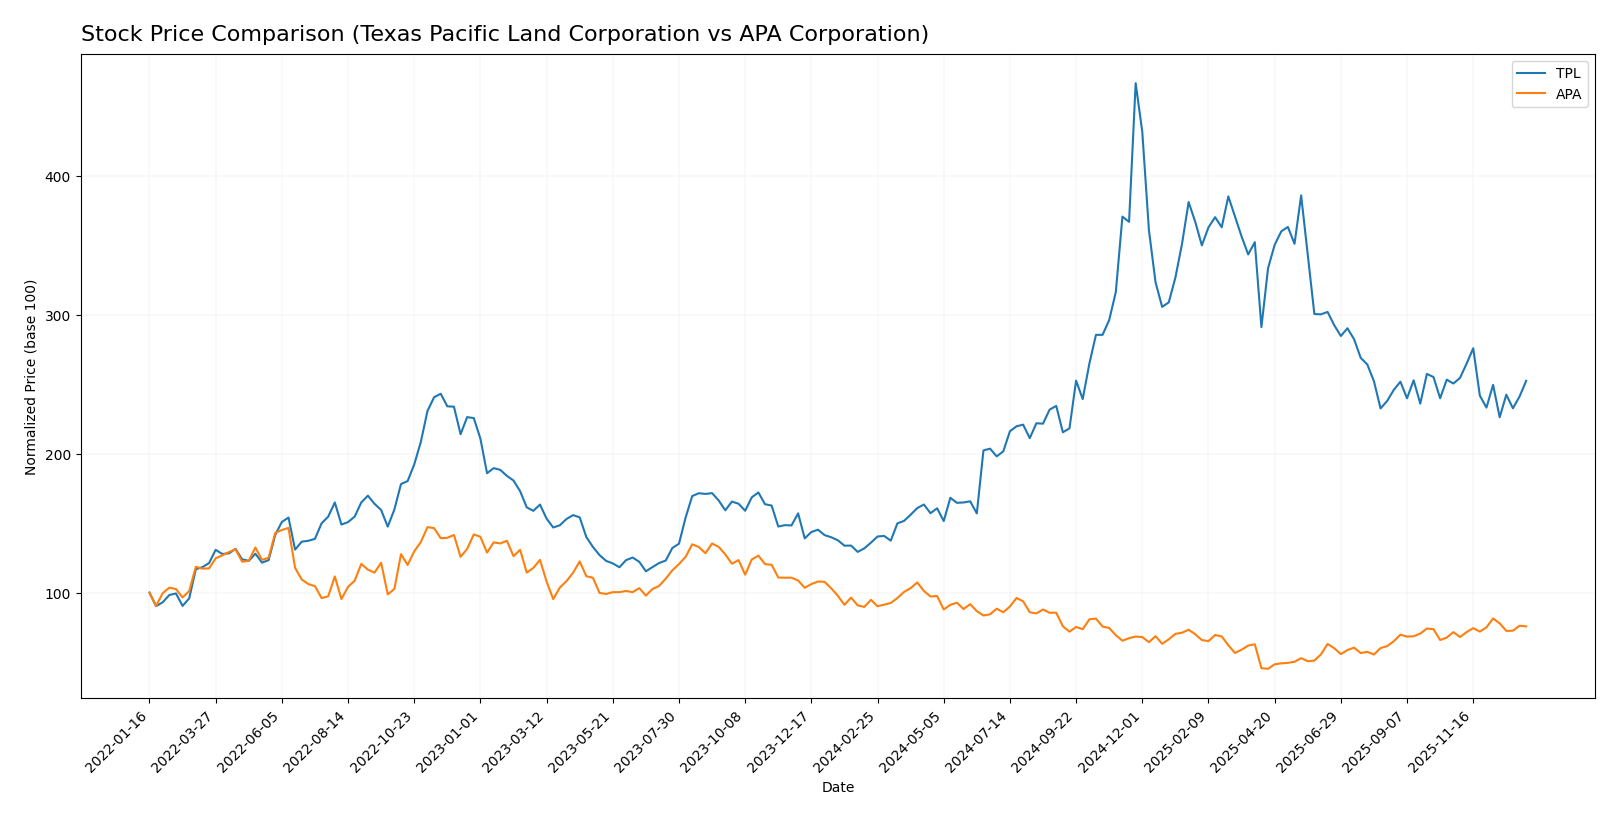
The stock price movements of Texas Pacific Land Corporation (TPL) and APA Corporation (APA) over the past year demonstrate contrasting dynamics, with TPL showing a strong bullish trend and APA experiencing a bearish trajectory, while recent trading sessions suggest a moderation in momentum for both.
Trend Analysis
Texas Pacific Land Corporation’s stock exhibited a bullish trend over the past 12 months, with an 85.66% price increase despite deceleration in trend acceleration. The price ranged from a low of 167.98 to a high of 576.67, with high volatility reflected in a 91.94 standard deviation.
APA Corporation’s stock followed a bearish trend over the same period, declining by 20.18%. The trend showed acceleration in the downward movement, with price fluctuations between 15.04 and 35.74 and notably lower volatility at 4.79 standard deviation.
Comparing the two, Texas Pacific Land Corporation delivered the highest market performance with a strong bullish trend and significant price appreciation, while APA trended downward despite recent modest positive movement.
Target Prices
The target price consensus for these energy companies reflects differing analyst expectations.
| Company | Target High | Target Low | Consensus |
|---|---|---|---|
| Texas Pacific Land Corporation | 1050 | 1050 | 1050 |
| APA Corporation | 40 | 21 | 26.75 |
Analysts expect Texas Pacific Land Corporation’s stock to significantly outperform its current price of $311.87. APA Corporation’s consensus target price of $26.75 slightly exceeds its current price of $25.20, indicating modest upside potential.
Analyst Opinions Comparison
This section compares analysts’ ratings and grades for Texas Pacific Land Corporation and APA Corporation:
Rating Comparison
Texas Pacific Land Corporation Rating
- Rating: A- with a very favorable status.
- Discounted Cash Flow Score: 4, indicating a favorable valuation.
- ROE Score: 5, very favorable efficiency in generating equity profit.
- ROA Score: 5, very favorable asset utilization.
- Debt To Equity Score: 3, moderate financial risk.
- Overall Score: 4, a favorable overall financial standing.
APA Corporation Rating
- Rating: A- with a very favorable status.
- Discounted Cash Flow Score: 3, indicating a moderate valuation.
- ROE Score: 5, very favorable efficiency in generating equity profit.
- ROA Score: 5, very favorable asset utilization.
- Debt To Equity Score: 1, very unfavorable financial risk due to high debt.
- Overall Score: 4, a favorable overall financial standing.
Which one is the best rated?
Both companies share the same overall rating of A- and an overall score of 4, indicating favorable standings. Texas Pacific Land shows a stronger discounted cash flow score and moderate debt risk, while APA has a lower debt to equity score, indicating higher financial risk.
Scores Comparison
The comparison of scores between Texas Pacific Land Corporation and APA Corporation is as follows:
Texas Pacific Land Corporation Scores
- Altman Z-Score: 29.77, indicating a safe zone far above the bankruptcy risk threshold.
- Piotroski Score: 4, reflecting average financial strength and investment potential.
APA Corporation Scores
- Altman Z-Score: 1.48, placing the company in the distress zone with high bankruptcy risk.
- Piotroski Score: 6, also reflecting average financial strength but higher than Texas Pacific Land.
Which company has the best scores?
Based solely on the provided data, Texas Pacific Land shows a significantly stronger Altman Z-Score, indicating much lower bankruptcy risk, while APA Corporation has a higher Piotroski Score, suggesting marginally better financial strength. Overall, Texas Pacific Land’s scores suggest greater financial safety.
Grades Comparison
Here is the grades comparison for Texas Pacific Land Corporation and APA Corporation from recognized grading companies:
Texas Pacific Land Corporation Grades
The following table shows recent grades assigned by established grading firms for Texas Pacific Land Corporation:
| Grading Company | Action | New Grade | Date |
|---|---|---|---|
| BWS Financial | Maintain | Buy | 2024-08-12 |
| BWS Financial | Maintain | Buy | 2024-05-10 |
| BWS Financial | Maintain | Buy | 2024-04-02 |
| Stifel | Maintain | Hold | 2024-01-23 |
| Stifel | Maintain | Hold | 2023-11-30 |
| Stifel | Maintain | Hold | 2023-05-22 |
| Stifel | Maintain | Hold | 2023-05-21 |
| Stifel | Maintain | Hold | 2023-04-27 |
| Stifel | Maintain | Hold | 2023-04-26 |
| Stifel | Maintain | Hold | 2023-04-12 |
The grades for Texas Pacific Land Corporation indicate a stable view, with BWS Financial consistently maintaining a Buy rating and Stifel maintaining Hold ratings.
APA Corporation Grades
Below are the latest grades given by recognized grading companies for APA Corporation:
| Grading Company | Action | New Grade | Date |
|---|---|---|---|
| Bernstein | Maintain | Market Perform | 2026-01-05 |
| UBS | Maintain | Neutral | 2025-12-12 |
| Mizuho | Maintain | Underperform | 2025-12-12 |
| Johnson Rice | Upgrade | Accumulate | 2025-12-05 |
| Citigroup | Maintain | Neutral | 2025-11-26 |
| Goldman Sachs | Maintain | Sell | 2025-11-21 |
| Piper Sandler | Maintain | Neutral | 2025-11-18 |
| RBC Capital | Maintain | Sector Perform | 2025-11-17 |
| Susquehanna | Maintain | Positive | 2025-11-12 |
| UBS | Maintain | Neutral | 2025-11-10 |
The grading trend for APA Corporation is mixed, with a range from Accumulate to Sell ratings, reflecting diverse analyst opinions and some uncertainty.
Which company has the best grades?
Texas Pacific Land Corporation has received more consistently positive grades, primarily Buy and Hold, compared to APA Corporation’s mixed ratings ranging from Accumulate to Sell. This consistency in grading may influence investors seeking steadier analyst confidence.
Strengths and Weaknesses
The table below summarizes the key strengths and weaknesses of Texas Pacific Land Corporation (TPL) and APA Corporation (APA) based on recent financial and operational data:
| Criterion | Texas Pacific Land Corporation (TPL) | APA Corporation (APA) |
|---|---|---|
| Diversification | Moderate: Revenue streams include royalties from oil, gas, water, easements, and land sales, showing some diversification in resource types. | Low: Primarily focused on oil and gas production and purchase, less diversification across product types. |
| Profitability | High: Net margin at 64.3%, ROE 40.1%, ROIC 35.6%, indicating strong profitability and capital efficiency. | Moderate: Net margin 8.3%, ROE 15.2%, ROIC 14.0%, profitable but with lower margins than TPL. |
| Innovation | Limited: Business model centered on land and royalties; innovation impact is minimal but stable. | Moderate: Industry-driven innovation in exploration and production technologies, supporting ROIC growth. |
| Global presence | Limited: Operations mainly concentrated in Texas and surrounding areas. | Broader: Operates in multiple regions globally, increasing exposure but also operational complexity. |
| Market Share | Niche: Dominant landowner with royalties in key US basins, strong economic moat with 27.4% excess ROIC. | Competitive: Growing ROIC trend (7.9% excess), but faces intense competition in upstream oil and gas markets. |
Key takeaways: TPL exhibits strong profitability, a durable competitive moat, and diversified royalty-based revenues with low debt, making it a stable choice. APA shows promising growth and favorable financial ratios but carries higher operational risks inherent in exploration and production activities.
Risk Analysis
Below is a comparative table of key risks for Texas Pacific Land Corporation (TPL) and APA Corporation (APA) based on 2024 data.
| Metric | Texas Pacific Land Corporation (TPL) | APA Corporation (APA) |
|---|---|---|
| Market Risk | Moderate (Beta 0.935, stable energy sector exposure) | Moderate (Beta 0.743, diversified geographical operations) |
| Debt level | Very low (Debt-to-Equity 0.0, Debt-to-Assets 0.04%) | High (Debt-to-Equity 1.17, Debt-to-Assets 31.78%) |
| Regulatory Risk | Moderate (US land and resource regulations) | Moderate to high (US, Egypt, UK regulations, offshore activities) |
| Operational Risk | Low (Focused land management, water services, limited employees) | Moderate (Large operations, exploration risks) |
| Environmental Risk | Moderate (Resource management, water services impact) | Moderate to high (Oil & gas production, pipeline ownership) |
| Geopolitical Risk | Low (US-focused operations) | Moderate (International operations in Egypt, UK, Suriname) |
The most impactful risks are APA’s high debt level and geopolitical exposure due to its international operations, which elevate financial and regulatory uncertainties. TPL shows robust financial health with minimal debt, but faces moderate regulatory and environmental risks tied to resource management in Texas. Investors should weigh APA’s higher leverage and international risks against TPL’s more stable but land-dependent business model.
Which Stock to Choose?
Texas Pacific Land Corporation (TPL) shows strong income growth with a 133% revenue increase over five years and a robust 64.3% net margin. Its profitability ratios are favorable, supported by very low debt and a very favorable overall rating, reflecting a durable competitive advantage.
APA Corporation (APA) presents moderate income growth at 120% over five years with an 8.3% net margin. Financial ratios are slightly favorable, though debt levels are higher and its rating, while very favorable overall, includes some moderate and unfavorable debt-related scores.
Investors seeking strong profitability and low leverage might find TPL more appealing, while those tolerating higher debt for potential growth could consider APA. The choice could depend on whether an investor prioritizes financial stability or growth potential.
Disclaimer: Investment carries a risk of loss of initial capital. The past performance is not a reliable indicator of future results. Be sure to understand risks before making an investment decision.
Go Further
I encourage you to read the complete analyses of Texas Pacific Land Corporation and APA Corporation to enhance your investment decisions: