In the dynamic world of energy, Occidental Petroleum Corporation (OXY) and APA Corporation (APA) stand out as key players in oil and gas exploration and production. Both headquartered in Houston, these companies share market focus yet differ in scale and innovation strategies. By comparing their operational strengths and growth potential, I aim to help you identify which stock might better fit your investment portfolio in 2026. Let’s explore their prospects together.
Table of contents
Companies Overview
I will begin the comparison between Occidental Petroleum Corporation and APA Corporation by providing an overview of these two companies and their main differences.
Occidental Petroleum Corporation Overview
Occidental Petroleum Corporation is an energy company focused on the acquisition, exploration, and development of oil and gas properties across the United States, the Middle East, Africa, and Latin America. It operates through three segments: Oil and Gas, Chemical, and Midstream and Marketing. Founded in 1920 and based in Houston, Texas, Occidental holds a strong market position with a $42.2B market cap and a diversified asset base.
APA Corporation Overview
APA Corporation engages in the exploration, development, and production of oil and gas with operations in the United States, Egypt, the United Kingdom, and offshore Suriname. It also manages gathering, processing, and transmission assets, including ownership in several Permian-to-Gulf Coast pipelines. Founded in 1954 and headquartered in Houston, Texas, APA has a market cap of approximately $8.9B and a more focused geographic footprint.
Key similarities and differences
Both Occidental and APA operate in the oil and gas exploration and production industry, headquartered in Houston, Texas, and listed on major U.S. exchanges. Occidental is larger with diversified operations including chemicals and midstream assets, while APA has a narrower scope focused on upstream activities and regional pipeline ownership. Occidental employs over 13K staff compared to APA’s 2.3K, reflecting their differing scales and business models.
Income Statement Comparison
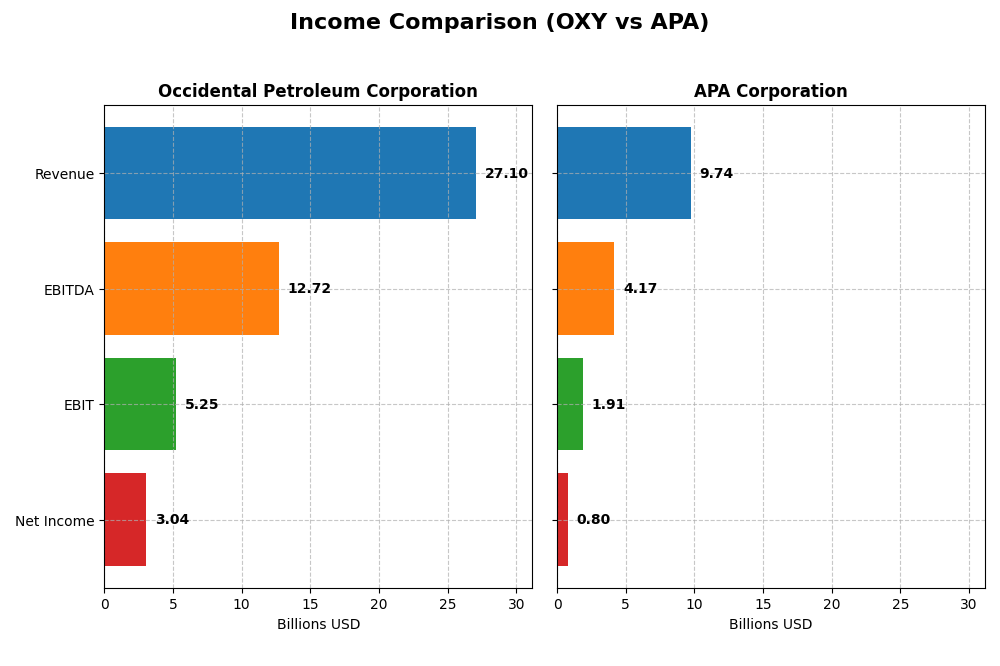
This table compares key income statement metrics for Occidental Petroleum Corporation and APA Corporation for the fiscal year 2024.
| Metric | Occidental Petroleum Corporation | APA Corporation |
|---|---|---|
| Market Cap | 42.2B | 8.9B |
| Revenue | 27.1B | 9.7B |
| EBITDA | 12.7B | 4.2B |
| EBIT | 5.2B | 1.9B |
| Net Income | 3.0B | 804M |
| EPS | 2.59 | 2.28 |
| Fiscal Year | 2024 | 2024 |
Income Statement Interpretations
Occidental Petroleum Corporation
Occidental Petroleum showed a strong overall revenue growth of 58.12% and net income growth of 120.52% from 2020 to 2024. Margins remained favorable, with a 35.61% gross margin and 11.23% net margin in 2024. However, the most recent year saw a 4.35% decline in revenue and a 31.92% drop in net margin, indicating a slowdown in growth and margin contraction.
APA Corporation
APA Corporation experienced a robust 119.55% revenue increase and 116.81% net income growth over 2020–2024. The company maintained favorable margins, including a 44.18% gross margin and 8.26% net margin in 2024. The latest year showed a 17.61% revenue rise but a significant 76.06% decline in net margin, reflecting mixed recent performance with margin pressure despite revenue gains.
Which one has the stronger fundamentals?
Both companies demonstrate favorable income statement fundamentals over the long term, with APA showing higher revenue growth and gross margins. Occidental maintains better net margins and less recent volatility, though it experienced a revenue decline in the latest year. APA’s stronger recent revenue growth contrasts with its sharper margin compression, suggesting differing risk and profitability profiles.
Financial Ratios Comparison
The table below presents a side-by-side comparison of key financial ratios for Occidental Petroleum Corporation (OXY) and APA Corporation (APA) based on their most recent fiscal year 2024 data.
| Ratios | Occidental Petroleum Corporation (OXY) | APA Corporation (APA) |
|---|---|---|
| ROE | 8.91% | 15.23% |
| ROIC | 5.48% | 14.03% |
| P/E | 14.8 | 10.1 |
| P/B | 1.32 | 1.54 |
| Current Ratio | 0.95 | 1.15 |
| Quick Ratio | 0.73 | 1.01 |
| D/E (Debt to Equity) | 0.79 | 1.17 |
| Debt-to-Assets | 31.7% | 31.8% |
| Interest Coverage | 5.08 | 8.44 |
| Asset Turnover | 0.32 | 0.50 |
| Fixed Asset Turnover | 0.39 | 0.77 |
| Payout ratio | 47.5% | 43.9% |
| Dividend yield | 3.21% | 4.33% |
Interpretation of the Ratios
Occidental Petroleum Corporation
Occidental Petroleum shows a mixed ratio profile with favorable net margin (11.23%) and dividend yield (3.21%), but unfavorable return on equity (8.91%) and liquidity ratios (current ratio 0.95). Asset turnover ratios are also weak, suggesting efficiency concerns. Dividend payments are supported, but coverage by free cash flow is limited, indicating possible risks in sustaining distributions or buybacks.
APA Corporation
APA Corporation presents a stronger ratio set overall, with favorable return on equity (15.23%), return on invested capital (14.03%), and interest coverage ratio (5.03). Liquidity ratios are solid, and the dividend yield is higher at 4.33%. However, debt-to-equity is unfavorable at 1.17, signaling higher leverage. Dividend payments appear well-supported given cash flow metrics and profitability.
Which one has the best ratios?
APA Corporation exhibits a more favorable ratio profile, with half of its key ratios marked positive and stronger profitability and liquidity measures. Occidental Petroleum, while offering a decent dividend yield, has more unfavorable ratios and weaker asset efficiency, resulting in a neutral overall assessment compared to APA’s slightly favorable stance.
Strategic Positioning
This section compares the strategic positioning of Occidental Petroleum Corporation (OXY) and APA Corporation (APA) regarding market position, key segments, and exposure to technological disruption:
Occidental Petroleum Corporation (OXY)
- Large market cap of 42B; operates globally with diverse competitive pressures in oil, chemicals, and midstream segments.
- Diversified business with Oil & Gas (21.7B), Chemical (4.9B), and Midstream (1.7B) segments driving revenue.
- Exposure includes traditional oil and gas operations with additional chemical manufacturing; no explicit technological disruption noted.
APA Corporation (APA)
- Smaller market cap of 8.9B; focused mainly on oil and gas exploration and production in select regions.
- Revenue mainly from Oil & Gas excluding purchased (8.2B) and purchased (1.5B); limited segment diversification.
- Concentrated in oil and gas exploration and production with pipeline ownership; no specific mention of technological disruption.
Occidental Petroleum Corporation vs APA Corporation Positioning
OXY employs a diversified strategy across oil, chemicals, and midstream businesses, providing multiple revenue streams but facing varied competitive pressures. APA concentrates on oil and gas production and transmission, offering focused operations with potentially less complexity but narrower market exposure.
Which has the best competitive advantage?
APA demonstrates a very favorable moat with value creation and growing ROIC, indicating a durable competitive advantage. OXY shows a slightly favorable moat with increased profitability but is still shedding value, reflecting a less established competitive edge.
Stock Comparison
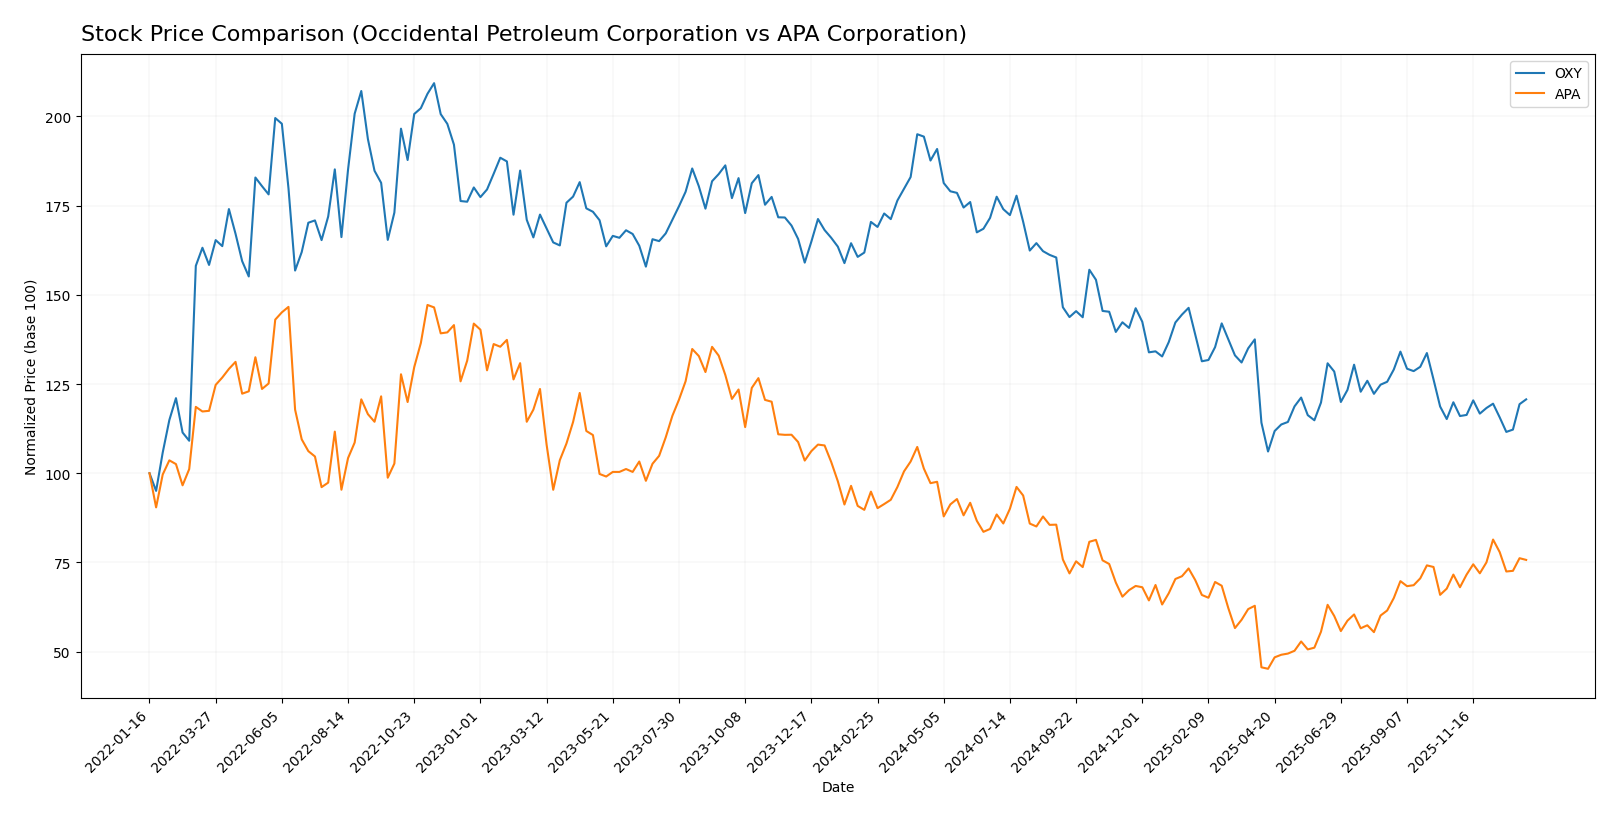
The stock price movements of Occidental Petroleum Corporation (OXY) and APA Corporation (APA) over the past 12 months reveal contrasting bearish trends with differing acceleration and recent short-term dynamics.
Trend Analysis
Occidental Petroleum Corporation’s stock showed a -29.18% decline over the past year, indicating a bearish trend with accelerating downward momentum. The price ranged from a high of 69.25 to a low of 37.67, with notable volatility at an 8.33 standard deviation.
APA Corporation experienced a -20.18% decrease in share price over the same period, also reflecting a bearish trend with accelerating decline. The price fluctuated between 35.74 and 15.04, accompanied by a lower volatility of 4.79 standard deviation.
Comparing recent trends, APA’s stock outperformed with a 5.75% gain versus OXY’s mild 0.68% increase, making APA the higher market performer in the latest quarter.
Target Prices
The consensus among analysts provides a clear outlook on the target prices for Occidental Petroleum Corporation and APA Corporation.
| Company | Target High | Target Low | Consensus |
|---|---|---|---|
| Occidental Petroleum Corporation | 64 | 38 | 49.36 |
| APA Corporation | 40 | 21 | 26.75 |
Analysts expect Occidental Petroleum’s stock to appreciate moderately above its current price of 42.86 USD, while APA Corporation’s consensus target suggests a slight upside from its current 25.2 USD. Both stocks show potential but with a cautious range.
Analyst Opinions Comparison
This section compares analysts’ ratings and financial scores for Occidental Petroleum Corporation (OXY) and APA Corporation (APA):
Rating Comparison
OXY Rating
- Rating: B+, considered Very Favorable
- Discounted Cash Flow Score: 5, Very Favorable
- ROE Score: 3, Moderate
- ROA Score: 4, Favorable
- Debt To Equity Score: 1, Very Unfavorable
- Overall Score: 3, Moderate
APA Rating
- Rating: A-, considered Very Favorable
- Discounted Cash Flow Score: 3, Moderate
- ROE Score: 5, Very Favorable
- ROA Score: 5, Very Favorable
- Debt To Equity Score: 1, Very Unfavorable
- Overall Score: 4, Favorable
Which one is the best rated?
Based strictly on the provided data, APA holds a higher overall rating (A- vs. B+) and stronger scores in ROE and ROA, while both share a very unfavorable debt-to-equity score. APA is better rated overall.
Scores Comparison
Here is a comparison of the financial scores for Occidental Petroleum Corporation (OXY) and APA Corporation (APA):
OXY Scores
- Altman Z-Score: 1.39, indicating financial distress zone
- Piotroski Score: 5, classified as average financial strength
APA Scores
- Altman Z-Score: 1.48, indicating financial distress zone
- Piotroski Score: 6, classified as average financial strength
Which company has the best scores?
Both companies fall into the financial distress zone by Altman Z-Score, but APA has a slightly higher Z-Score and a better Piotroski Score than OXY. Based strictly on scores, APA shows marginally stronger financial metrics.
Grades Comparison
The following is a summary of the latest reliable grades assigned to Occidental Petroleum Corporation and APA Corporation:
Occidental Petroleum Corporation Grades
This table outlines recent grades assigned by recognized financial institutions to Occidental Petroleum Corporation.
| Grading Company | Action | New Grade | Date |
|---|---|---|---|
| UBS | Maintain | Neutral | 2025-12-12 |
| B of A Securities | Maintain | Neutral | 2025-12-11 |
| JP Morgan | Downgrade | Underweight | 2025-12-08 |
| Citigroup | Maintain | Neutral | 2025-11-19 |
| Piper Sandler | Maintain | Neutral | 2025-11-18 |
| Susquehanna | Maintain | Positive | 2025-11-13 |
| Wells Fargo | Maintain | Underweight | 2025-11-12 |
| Mizuho | Maintain | Outperform | 2025-11-11 |
| Piper Sandler | Maintain | Neutral | 2025-10-21 |
| Susquehanna | Maintain | Positive | 2025-10-20 |
Overall, Occidental Petroleum’s grades show a mixed but generally neutral to cautious stance, with several maintains at neutral and some underweight or outperform ratings indicating moderate variability in analyst outlooks.
APA Corporation Grades
This table presents recent grades from credible grading companies for APA Corporation.
| Grading Company | Action | New Grade | Date |
|---|---|---|---|
| Bernstein | Maintain | Market Perform | 2026-01-05 |
| UBS | Maintain | Neutral | 2025-12-12 |
| Mizuho | Maintain | Underperform | 2025-12-12 |
| Johnson Rice | Upgrade | Accumulate | 2025-12-05 |
| Citigroup | Maintain | Neutral | 2025-11-26 |
| Goldman Sachs | Maintain | Sell | 2025-11-21 |
| Piper Sandler | Maintain | Neutral | 2025-11-18 |
| RBC Capital | Maintain | Sector Perform | 2025-11-17 |
| Susquehanna | Maintain | Positive | 2025-11-12 |
| UBS | Maintain | Neutral | 2025-11-10 |
The grades for APA Corporation indicate a generally cautious to slightly negative sentiment, with several neutral maintains balanced by underperform and sell ratings, alongside a notable upgrade by Johnson Rice.
Which company has the best grades?
Occidental Petroleum Corporation generally receives stronger and more positive grades compared to APA Corporation, with more outperform and positive ratings versus APA’s underperform and sell grades. This difference may influence investors’ risk perceptions and portfolio positioning.
Strengths and Weaknesses
Below is a comparative overview of the key strengths and weaknesses of Occidental Petroleum Corporation (OXY) and APA Corporation (APA) based on the latest available data.
| Criterion | Occidental Petroleum Corporation (OXY) | APA Corporation (APA) |
|---|---|---|
| Diversification | Strong diversification with significant revenue from Chemical (4.92B), Midstream (1.65B), and Oil & Gas (21.7B) segments | Less diversified, primarily focused on Oil & Gas production (around 9.8B in 2024) with some purchased volumes |
| Profitability | Moderate profitability: Net margin 11.23% (favorable), ROIC 5.48% (neutral), but ROE low at 8.91% (unfavorable) | Higher profitability: Net margin 8.26% (neutral), ROIC strong at 14.03% (favorable), ROE also favorable at 15.23% |
| Innovation | No clear data indicating strong innovation initiatives; ROIC trend growing but still shedding value | Demonstrates durable competitive advantage with very favorable moat status and growing ROIC trend |
| Global presence | Large global footprint with integrated operations across chemicals, midstream, and oil & gas | Focused mainly on oil and gas operations, less diversified geographically and segment-wise |
| Market Share | Established player with sizable market share in chemicals and oil & gas | Smaller scale than OXY but showing strong growth and value creation |
Key takeaways: APA Corporation stands out with a very favorable competitive moat and higher profitability metrics, indicating efficient capital use and value creation. Occidental Petroleum shows diversification benefits but struggles with value creation despite improving profitability. Investors should weigh APA’s stronger financial health against OXY’s broader business exposure.
Risk Analysis
Below is a comparative table presenting key risk metrics for Occidental Petroleum Corporation (OXY) and APA Corporation (APA) in 2024, reflecting their financial and operational risk exposure.
| Metric | Occidental Petroleum Corporation (OXY) | APA Corporation (APA) |
|---|---|---|
| Market Risk | Low beta (0.38) indicates lower volatility | Moderate beta (0.74) shows moderate sensitivity |
| Debt Level | Moderate debt-to-equity (0.79), neutral risk | Higher debt-to-equity (1.17), unfavorable risk |
| Regulatory Risk | US and international operations expose to varied regulations | Operations in US, Egypt, UK, and Suriname increase complexity |
| Operational Risk | Large-scale chemical and midstream activities; asset turnover low | Smaller scale, better asset turnover but still moderate |
| Environmental Risk | Exposure due to oil & gas exploration, chemical manufacturing | Similar oil & gas footprint with offshore exploration risks |
| Geopolitical Risk | Presence in Middle East, Africa, Latin America adds risk | Operations in politically sensitive regions like Egypt, Suriname |
Both companies face significant debt-related risks with APA showing higher leverage, increasing its financial vulnerability. Market risk is relatively contained for OXY due to lower beta, while APA is moderately exposed to market swings. Operational and environmental risks remain substantial given the nature of the energy sector. Geopolitical risks are notable for both due to international operations, with potential impact from regional instability. The most pressing concerns are high leverage and geopolitical exposure, which could affect financial stability and operational continuity.
Which Stock to Choose?
Occidental Petroleum Corporation (OXY) shows a favorable income statement with strong gross and EBIT margins but recent revenue and net margin declines. Financial ratios are mixed, with favorable valuation metrics yet some liquidity and profitability concerns. Its debt level is moderate, and the overall rating is very favorable.
APA Corporation (APA) demonstrates favorable income growth and margins overall, despite some short-term EBIT and net margin decreases. Financial ratios appear slightly favorable, supported by strong returns and liquidity, though debt-to-equity is unfavorable. The company holds a very favorable rating with improving profitability metrics.
For investors, APA’s very favorable rating and strong ROIC above WACC suggest durable competitive advantage and value creation, appealing to growth-oriented profiles. OXY’s neutral ratio evaluation and slightly favorable moat indicate improving profitability but less stability, which might suit risk-tolerant or value-focused investors. The final choice could depend on individual risk tolerance and investment strategy.
Disclaimer: Investment carries a risk of loss of initial capital. The past performance is not a reliable indicator of future results. Be sure to understand risks before making an investment decision.
Go Further
I encourage you to read the complete analyses of Occidental Petroleum Corporation and APA Corporation to enhance your investment decisions: