EQT Corporation and APA Corporation are two prominent players in the oil and gas exploration and production industry, each with distinctive operational footprints and growth strategies. EQT focuses primarily on natural gas within the U.S., while APA operates across multiple regions with a broader oil and gas portfolio. Their overlapping market presence and innovation in resource development make this comparison timely. Join me to explore which company presents a more compelling investment opportunity in 2026.
Table of contents
Companies Overview
I will begin the comparison between EQT and APA by providing an overview of these two companies and their main differences.
EQT Overview
EQT Corporation is a natural gas production company based in Pittsburgh, Pennsylvania. Founded in 1878, it operates primarily in the United States, focusing on producing natural gas and natural gas liquids such as ethane and propane. With 25.0 trillion cubic feet of proved reserves across about 2.0 million gross acres, EQT holds a strong position in the oil and gas exploration and production sector.
APA Overview
APA Corporation, headquartered in Houston, Texas, explores, develops, and produces oil and gas properties in the US, Egypt, and the UK, with offshore activities in Suriname. Founded in 1954, APA also manages gathering, processing, and transmission assets, including ownership in pipelines from the Permian Basin to the Gulf Coast. It operates within the energy sector with a diversified geographic footprint.
Key similarities and differences
Both EQT and APA operate in the oil and gas exploration and production industry in the United States and are publicly traded but on different exchanges (NYSE for EQT and NASDAQ for APA). EQT primarily focuses on natural gas with significant reserves, while APA has a broader geographic presence and pipeline assets. EQT employs fewer people but controls a larger reserve base compared to APA’s diversified operations and higher employee count.
Income Statement Comparison
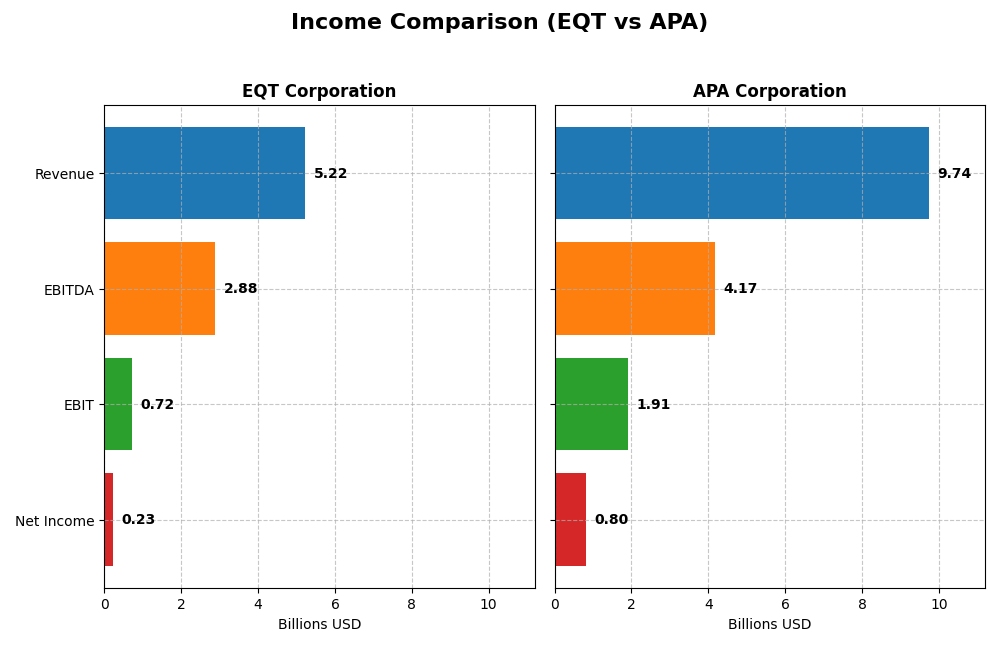
This table provides a factual comparison of key income statement metrics for EQT Corporation and APA Corporation for the fiscal year 2024.
| Metric | EQT Corporation | APA Corporation |
|---|---|---|
| Market Cap | 31.9B | 8.9B |
| Revenue | 5.22B | 9.74B |
| EBITDA | 2.88B | 4.17B |
| EBIT | 719M | 1.91B |
| Net Income | 231M | 804M |
| EPS | 0.45 | 2.28 |
| Fiscal Year | 2024 | 2024 |
Income Statement Interpretations
EQT Corporation
EQT Corporation’s revenue nearly doubled from 2020 to 2024, showing a favorable overall growth of 96.42%. However, net income declined sharply in 2024 after a peak in 2023, resulting in an 87.1% drop in net margin growth. The 2024 EBIT margin remains favorable at 13.77%, but the year saw declines in gross profit and EPS, indicating a slowdown in profitability despite stable revenue growth.
APA Corporation
APA Corporation demonstrated strong revenue growth of 119.55% over the period, with a favorable gross margin of 44.18% and an EBIT margin of 19.6% in 2024. Although net income and EPS fell significantly in 2024 compared to 2023, the company maintains a positive net margin of 8.26%. Operating expenses grew unfavorably, yet overall fundamentals reflect improvement and resilience in core operations.
Which one has the stronger fundamentals?
APA Corporation exhibits stronger fundamentals with higher gross and EBIT margins, lower interest expense ratio, and more favorable overall income statement evaluations. While both companies experienced year-on-year declines in net income and EPS in 2024, APA’s superior margin profile and higher revenue growth rate outweigh EQT’s more volatile profitability and neutral margin trends, suggesting more consistent financial health.
Financial Ratios Comparison
The table below compares key financial ratios for EQT Corporation and APA Corporation for the fiscal year 2024, providing a snapshot of their profitability, liquidity, leverage, efficiency, and dividend metrics.
| Ratios | EQT Corporation | APA Corporation |
|---|---|---|
| ROE | 1.12% | 15.23% |
| ROIC | 1.66% | 14.03% |
| P/E | 101.91 | 10.14 |
| P/B | 1.14 | 1.54 |
| Current Ratio | 0.70 | 1.15 |
| Quick Ratio | 0.70 | 1.01 |
| D/E | 0.45 | 1.17 |
| Debt-to-Assets | 23.5% | 31.8% |
| Interest Coverage | 1.51 | 8.44 |
| Asset Turnover | 0.13 | 0.50 |
| Fixed Asset Turnover | 0.16 | 0.77 |
| Payout Ratio | 142% | 44% |
| Dividend Yield | 1.39% | 4.33% |
Interpretation of the Ratios
EQT Corporation
EQT exhibits mostly weak financial ratios, with unfavorable net margin (4.42%), ROE (1.12%), and ROIC (1.66%), alongside low current and quick ratios (0.7). However, it shows strengths in debt-to-equity (0.45) and debt-to-assets (23.51%). The dividend yield is moderate at 1.39%, indicating steady but cautious dividend returns with potential risks due to low coverage from free cash flow.
APA Corporation
APA displays stronger ratios, including favorable ROE (15.23%), ROIC (14.03%), and interest coverage (5.03). Its current ratio is neutral at 1.15, with a higher dividend yield of 4.33%, supported by manageable payout ratios. Some concerns exist over its debt-to-equity ratio (1.17), which is unfavorable, but overall financial health is slightly favorable.
Which one has the best ratios?
APA Corporation holds a more favorable financial profile with superior profitability and coverage ratios compared to EQT. EQT faces multiple weaknesses in profitability and liquidity ratios, while APA’s higher dividend yield and stronger returns on equity and invested capital provide a comparatively better foundation for investors assessing ratio strength.
Strategic Positioning
This section compares the strategic positioning of EQT Corporation and APA Corporation, including market position, key segments, and exposure to technological disruption:
EQT Corporation
- Larger market cap of 31.9B USD on NYSE, faces typical energy sector competition
- Focus on natural gas production, NGLs, and crude oil with 25T cubic feet reserves
- No explicit data on technology disruption exposure
APA Corporation
- Smaller market cap of 8.9B USD on NASDAQ, competes in global energy markets
- Diversified oil and gas exploration and production with US, Egypt, UK operations
- No explicit data on technology disruption exposure
EQT Corporation vs APA Corporation Positioning
EQT is concentrated in natural gas production with significant reserves, while APA operates diversified oil and gas assets internationally. EQT’s scale offers resource depth; APA’s international presence supports broader market access but with smaller market cap.
Which has the best competitive advantage?
APA shows a very favorable MOAT with ROIC exceeding WACC by 7.9% and strong growth, indicating durable competitive advantage. EQT’s slightly unfavorable MOAT signals value destruction despite improving profitability.
Stock Comparison
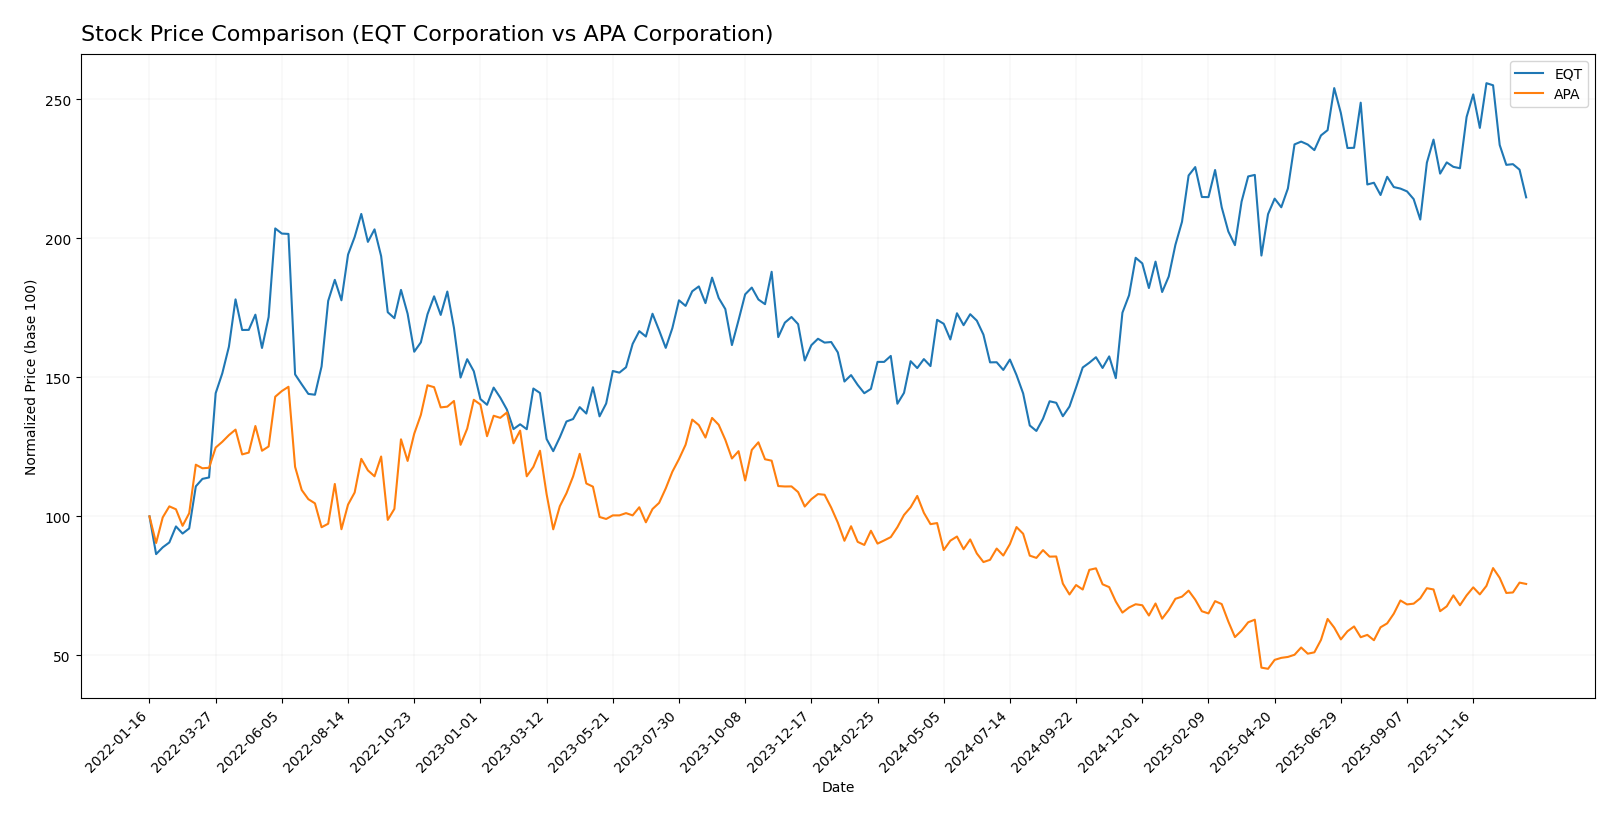
The stock prices of EQT Corporation and APA Corporation have exhibited contrasting dynamics over the past year, with EQT showing significant gains while APA experienced a notable decline, reflecting divergent market sentiments and trading behaviors.
Trend Analysis
EQT Corporation’s stock showed a strong bullish trend over the past 12 months with a 47.23% price increase, though momentum has decelerated recently with a slight 4.86% dip in the last quarter.
APA Corporation’s stock demonstrated a bearish trend over the same period, declining 20.18%, despite recent acceleration with a 5.75% rise in the last quarter suggesting a potential recovery phase.
Comparing the two, EQT delivered the highest market performance over the past year, significantly outperforming APA, which faced a prolonged downward trend despite recent positive momentum.
Target Prices
Analyst consensus on target prices indicates mixed valuations for these energy sector companies.
| Company | Target High | Target Low | Consensus |
|---|---|---|---|
| EQT Corporation | 55 | 23 | 41.11 |
| APA Corporation | 40 | 21 | 26.75 |
For EQT Corporation, the consensus target price of 41.11 is below the current market price of 51.09, suggesting some downside risk. APA Corporation’s consensus target of 26.75 sits slightly above its current price of 25.20, implying modest upside potential.
Analyst Opinions Comparison
This section compares analysts’ ratings and grades for EQT Corporation and APA Corporation:
Rating Comparison
EQT Rating
- Rating: A- with a very favorable overall evaluation.
- Discounted Cash Flow Score: 5, indicating a very favorable valuation outlook.
- ROE Score: 4, showing favorable efficiency in generating profit from equity.
- ROA Score: 4, reflecting favorable asset utilization.
- Debt To Equity Score: 2, representing moderate financial risk.
- Overall Score: 4, rated as favorable.
APA Rating
- Rating: A- with a very favorable overall evaluation.
- Discounted Cash Flow Score: 3, suggesting a moderate valuation outlook.
- ROE Score: 5, indicating very favorable efficiency in generating profit.
- ROA Score: 5, reflecting very favorable asset utilization.
- Debt To Equity Score: 1, indicating very unfavorable financial risk due to high leverage.
- Overall Score: 4, rated as favorable.
Which one is the best rated?
Both EQT and APA share the same overall rating of A- and an overall score of 4. EQT excels in discounted cash flow with a very favorable score, while APA outperforms in ROE and ROA but has a higher financial risk reflected in a weaker debt-to-equity score.
Scores Comparison
Here is a comparison of the Altman Z-Score and Piotroski Score for EQT Corporation and APA Corporation:
EQT Scores
- Altman Z-Score: 2.01, positioned in the grey zone indicating moderate bankruptcy risk.
- Piotroski Score: 8, classified as very strong financial health.
APA Scores
- Altman Z-Score: 1.48, in the distress zone signaling high bankruptcy risk.
- Piotroski Score: 6, reflecting average financial strength.
Which company has the best scores?
Based strictly on the scores, EQT shows a better financial condition with a higher Altman Z-Score in the grey zone versus APA’s distress zone, and a stronger Piotroski Score of 8 against APA’s 6.
Grades Comparison
The following section compares the recent grades and ratings from recognized financial institutions for EQT Corporation and APA Corporation:
EQT Corporation Grades
This table summarizes the latest grades issued by reputable firms for EQT Corporation:
| Grading Company | Action | New Grade | Date |
|---|---|---|---|
| Bernstein | Maintain | Outperform | 2026-01-05 |
| Citigroup | Maintain | Buy | 2025-12-19 |
| Mizuho | Maintain | Outperform | 2025-12-12 |
| UBS | Maintain | Buy | 2025-12-12 |
| Scotiabank | Maintain | Sector Perform | 2025-11-21 |
| Piper Sandler | Maintain | Neutral | 2025-11-18 |
| Wells Fargo | Maintain | Overweight | 2025-10-23 |
| UBS | Maintain | Buy | 2025-10-17 |
| Scotiabank | Maintain | Sector Perform | 2025-10-09 |
| Barclays | Maintain | Overweight | 2025-10-07 |
EQT’s grades predominantly indicate a positive outlook, with multiple “Buy” and “Outperform” ratings, reflecting confidence across various analysts.
APA Corporation Grades
The following table shows the latest grades from credible sources for APA Corporation:
| Grading Company | Action | New Grade | Date |
|---|---|---|---|
| Bernstein | Maintain | Market Perform | 2026-01-05 |
| UBS | Maintain | Neutral | 2025-12-12 |
| Mizuho | Maintain | Underperform | 2025-12-12 |
| Johnson Rice | Upgrade | Accumulate | 2025-12-05 |
| Citigroup | Maintain | Neutral | 2025-11-26 |
| Goldman Sachs | Maintain | Sell | 2025-11-21 |
| Piper Sandler | Maintain | Neutral | 2025-11-18 |
| RBC Capital | Maintain | Sector Perform | 2025-11-17 |
| Susquehanna | Maintain | Positive | 2025-11-12 |
| UBS | Maintain | Neutral | 2025-11-10 |
APA’s grades present a more mixed perspective, including “Neutral,” “Underperform,” and “Sell” ratings, with few upgrades, indicating cautious sentiment among analysts.
Which company has the best grades?
EQT Corporation has received consistently stronger grades with numerous “Buy” and “Outperform” ratings, while APA Corporation shows a more cautious consensus with mixed and lower ratings. This contrast may influence investor confidence and perceived risk profiles.
Strengths and Weaknesses
Below is a comparison of EQT Corporation and APA Corporation based on key financial and strategic criteria as of 2024.
| Criterion | EQT Corporation | APA Corporation |
|---|---|---|
| Diversification | Primarily focused on natural gas sales with limited diversification | Strong presence in oil and gas with a mix of purchased and produced volumes |
| Profitability | Low net margin (4.42%), ROIC below WACC, value destroying but improving | Higher net margin (8.26%), ROIC well above WACC, value creating and increasing profitability |
| Innovation | Moderate innovation with improving ROIC trend but overall unfavorable financial ratios | Demonstrates durable competitive advantage with favorable ROIC and profitability ratios |
| Global presence | Mainly domestic with limited global reach | More diversified in markets, benefiting from broader operations |
| Market Share | Smaller market share in oil segment, dominant in natural gas | Larger market share in oil and gas production and purchase segments |
Key takeaway: APA Corporation shows stronger financial health and value creation with a favorable profitability trend and diversification, while EQT Corporation is improving but still shedding value with weaker profitability and liquidity metrics. Investors seeking stability and growth may prefer APA, while cautious monitoring is advised for EQT.
Risk Analysis
Below is a summary table presenting key risk factors for EQT Corporation and APA Corporation based on the most recent financial and operational data from 2024.
| Metric | EQT Corporation | APA Corporation |
|---|---|---|
| Market Risk | Beta 0.68 – lower volatility, moderate exposure to energy price fluctuations | Beta 0.74 – slightly higher market sensitivity, exposed to global oil and gas prices |
| Debt Level | Debt-to-Equity 0.45 – moderate, with favorable debt-to-assets (23.5%) | Debt-to-Equity 1.17 – relatively high leverage, moderate debt-to-assets (31.8%) |
| Regulatory Risk | U.S.-focused natural gas operations, subject to environmental and energy regulations | Operations in U.S., Egypt, UK – increased complexity and exposure to multiple regulatory regimes |
| Operational Risk | Concentrated in Marcellus shale with 25Tcf reserves, operational efficiency concerns (low asset turnover) | Diverse assets including pipelines and offshore exploration, but fixed asset turnover unfavorable |
| Environmental Risk | Risks linked to natural gas production emissions and fracking impacts | Broader footprint including offshore, higher environmental risk from oil exploration and pipeline operations |
| Geopolitical Risk | Primarily U.S.-based, minimal geopolitical risk | Exposure to Egypt, Suriname, UK – moderate geopolitical risk in emerging and offshore markets |
In synthesis, APA Corporation carries higher financial leverage and geopolitical risk due to its international presence, increasing vulnerability. EQT shows moderate debt and lower market volatility but operational risks remain from efficiency and environmental constraints. Both companies face significant regulatory and environmental challenges inherent to the energy sector. APA’s distressed Altman Z-Score signals caution, while EQT is in a grey zone but with stronger financial health metrics overall.
Which Stock to Choose?
EQT Corporation shows mixed income evolution with a neutral global income statement opinion despite strong revenue and net income growth over 2020-2024. Its financial ratios are mostly unfavorable, with low profitability and liquidity but moderate debt management. The company’s rating is very favorable, supported by solid scores in return on equity and assets.
APA Corporation exhibits favorable income statement metrics with significant revenue and net income growth over the period. Its financial ratios are slightly favorable, highlighting strong profitability and coverage ratios despite higher debt levels. The overall rating is very favorable, with excellent return on equity and assets but weaker debt-to-equity scores.
For investors, APA might appear more attractive for those prioritizing growth and profitability given its favorable income and financial ratios, while EQT could be considered by those valuing a strong rating and moderate debt profile despite its less favorable ratio metrics. This interpretation depends on the investor’s risk tolerance and investment strategy.
Disclaimer: Investment carries a risk of loss of initial capital. The past performance is not a reliable indicator of future results. Be sure to understand risks before making an investment decision.
Go Further
I encourage you to read the complete analyses of EQT Corporation and APA Corporation to enhance your investment decisions: