In the dynamic energy sector, EOG Resources, Inc. and APA Corporation stand out as prominent players in oil and gas exploration and production. Both headquartered in Houston, Texas, they share a focus on innovation and market presence across key regions, including the United States. This article will compare their strategies and performance to help you identify which company could be the most compelling addition to your investment portfolio. Let’s explore their potential together.
Table of contents
Companies Overview
I will begin the comparison between EOG Resources and APA Corporation by providing an overview of these two companies and their main differences.
EOG Resources Overview
EOG Resources, Inc. focuses on exploring, developing, producing, and marketing crude oil, natural gas, and natural gas liquids. The company operates mainly in New Mexico, Texas, and Trinidad and Tobago, holding substantial net proved reserves. Founded in 1985 and headquartered in Houston, Texas, EOG is a significant player in the oil and gas exploration and production sector with a market capitalization of approximately 57.5B USD.
APA Corporation Overview
APA Corporation explores, develops, and produces oil and gas properties with operations spanning the United States, Egypt, the United Kingdom, and offshore Suriname. The company also manages gathering, processing, and transmission assets in West Texas and holds interests in several pipelines. Founded in 1954 and based in Houston, Texas, APA has a market cap near 8.9B USD, positioning it as a mid-sized energy company.
Key similarities and differences
Both EOG and APA operate in the oil and gas exploration and production industry with a strong presence in the United States and Houston headquarters. EOG has a larger market capitalization and reserves compared to APA. While EOG’s activities focus more on reserves and production, APA combines exploration with infrastructure operations like pipelines. Their geographic footprints differ, with APA having more international operations.
Income Statement Comparison
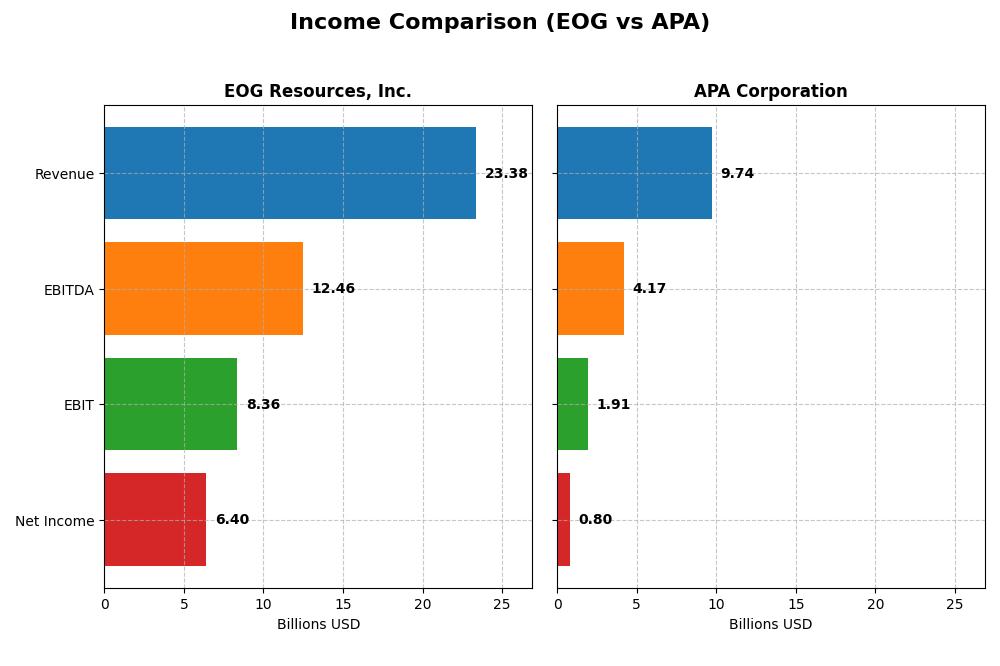
The table below presents the key income statement metrics for EOG Resources, Inc. and APA Corporation for the fiscal year 2024, providing a snapshot of their financial performance.
| Metric | EOG Resources, Inc. | APA Corporation |
|---|---|---|
| Market Cap | 57.5B | 8.9B |
| Revenue | 23.4B | 9.7B |
| EBITDA | 12.5B | 4.2B |
| EBIT | 8.4B | 1.9B |
| Net Income | 6.4B | 804M |
| EPS | 11.31 | 2.28 |
| Fiscal Year | 2024 | 2024 |
Income Statement Interpretations
EOG Resources, Inc.
EOG Resources experienced strong revenue growth of 137% from 2020 to 2024, with net income increasing over 1158% in the same period. Margins remain robust, with a 75.7% gross margin and a 27.4% net margin in 2024, indicating operational efficiency. However, the latest year showed a slight slowdown in revenue growth (0.85%) and a decline in net income and margins, reflecting some short-term pressures.
APA Corporation
APA Corporation’s revenue rose 120% over the 2020-2024 period, with net income growth of 117%. The company maintains favorable margins, including a 44.2% gross margin and an 8.3% net margin in 2024. The most recent year saw a healthy 17.6% revenue increase but a significant drop in net margin and earnings per share, suggesting rising costs or other profitability challenges despite top-line growth.
Which one has the stronger fundamentals?
EOG Resources shows stronger fundamentals with higher margins and more pronounced net income growth over the period, despite recent margin compression. APA exhibits solid revenue growth but faces more volatility in profitability and margin declines in the latest year. Both companies are rated favorably overall, though EOG’s superior margin profiles and scale suggest more resilient income statement fundamentals.
Financial Ratios Comparison
The table below presents a side-by-side comparison of key financial ratios for EOG Resources, Inc. and APA Corporation for the fiscal year 2024, facilitating a clear evaluation of their financial performance and stability.
| Ratios | EOG Resources, Inc. | APA Corporation |
|---|---|---|
| ROE | 21.8% | 15.2% |
| ROIC | 14.8% | 14.0% |
| P/E | 10.8 | 10.1 |
| P/B | 2.36 | 1.54 |
| Current Ratio | 2.10 | 1.15 |
| Quick Ratio | 1.91 | 1.01 |
| D/E | 0.17 | 1.17 |
| Debt-to-Assets | 10.7% | 31.8% |
| Interest Coverage | 58.6 | 8.44 |
| Asset Turnover | 0.50 | 0.50 |
| Fixed Asset Turnover | 0.68 | 0.77 |
| Payout ratio | 32.6% | 43.9% |
| Dividend yield | 3.01% | 4.33% |
Interpretation of the Ratios
EOG Resources, Inc.
EOG Resources shows a strong financial profile with favorable net margin at 27.39%, ROE at 21.82%, and ROIC at 14.75%, indicating effective profitability and capital use. Its low debt-to-equity of 0.17 and high interest coverage of 60.55 reflect solid financial stability. The company pays dividends with a 3.01% yield, supported by sustainable free cash flow and manageable payout risks.
APA Corporation
APA Corporation presents mixed ratios with favorable ROE at 15.23% and ROIC at 14.03%, but a neutral net margin of 8.26% and moderate current ratio of 1.15. Its debt-to-equity ratio of 1.17 is unfavorable, suggesting higher leverage risk. APA also pays dividends with a 4.33% yield, though its higher debt level may affect distribution sustainability over time.
Which one has the best ratios?
EOG Resources has a more robust financial standing, with a higher percentage of favorable ratios (78.57% vs. 50.0%) and stronger profitability and liquidity metrics. APA shows some strengths but is weighed down by higher leverage and more neutral ratios, making EOG’s overall financial ratios more favorable for investors assessing stability and returns.
Strategic Positioning
This section compares the strategic positioning of EOG Resources, Inc. and APA Corporation, focusing on market position, key segments, and exposure to technological disruption:
EOG Resources, Inc.
- Leading US oil and gas producer with strong market cap, moderate competitive pressure.
- Key segments include oil and condensate, natural gas liquids, and natural gas production.
- Exposure to disruption limited; operates in traditional oil and gas sectors without noted tech shifts.
APA Corporation
- Smaller market cap, operates in US, Egypt, UK, with moderate competition.
- Focused on oil and gas exploration, production, and purchased volumes.
- Similar exposure; primarily traditional oil and gas with no explicit tech disruption.
EOG vs APA Positioning
EOG shows a diversified product base across oil, gas liquids, and natural gas, while APA concentrates on oil and gas exploration and purchased volumes. EOG benefits from a larger market presence, whereas APA operates in more varied geographies.
Which has the best competitive advantage?
Both companies have a very favorable moat with growing ROICs above WACC, indicating durable competitive advantages and efficient capital use, though EOG shows a slightly higher ROIC and stronger growth trend.
Stock Comparison
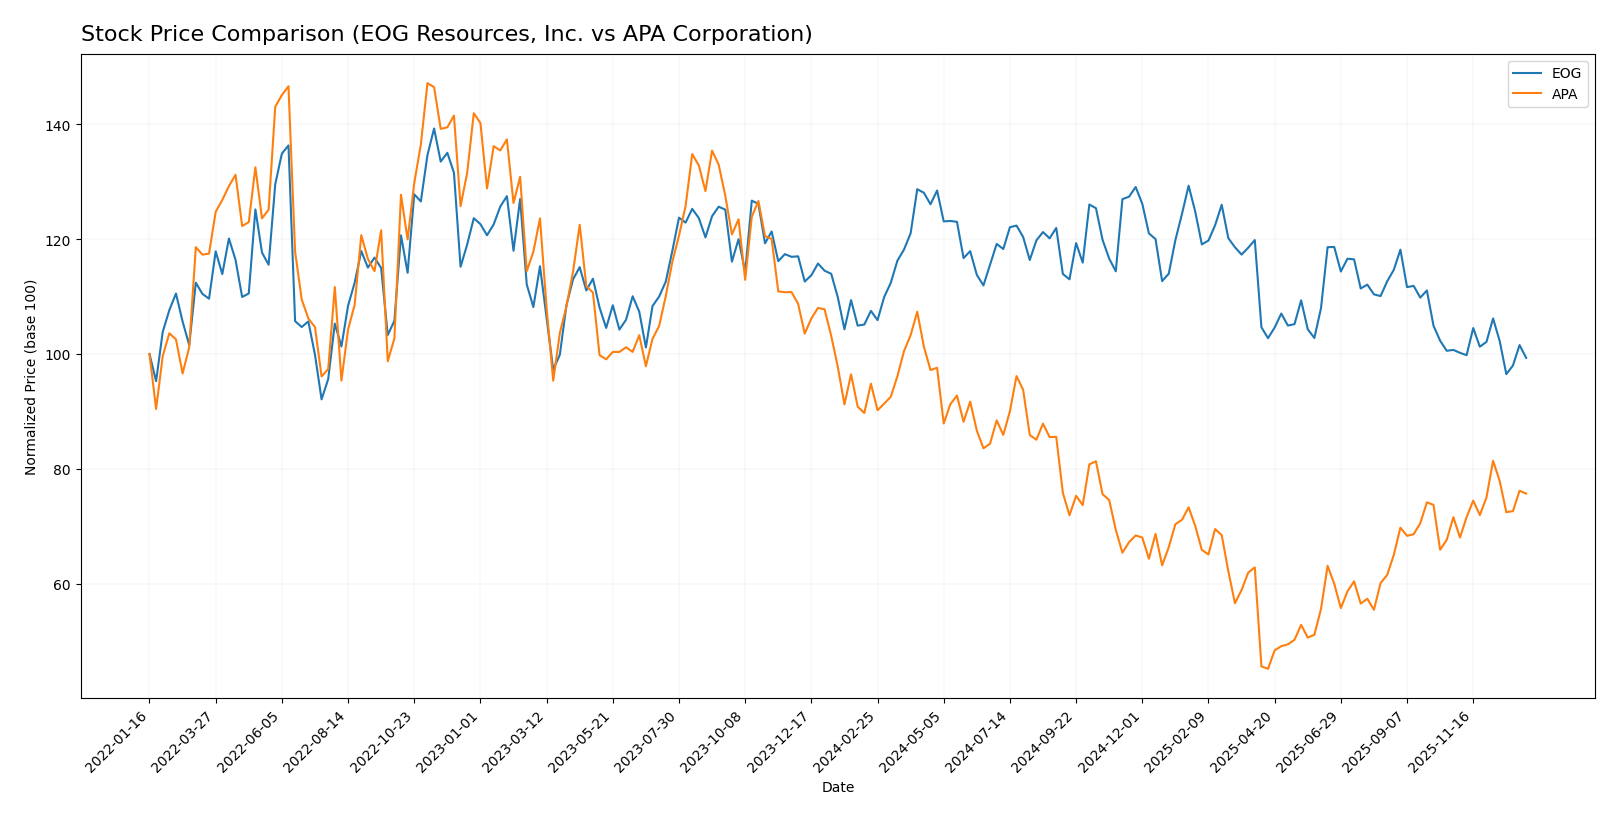
The stock price dynamics of EOG Resources, Inc. and APA Corporation over the past year reveal contrasting patterns, with both experiencing notable volatility and shifts in trading momentum.
Trend Analysis
EOG Resources, Inc. exhibited a bearish trend over the past 12 months with a -7.61% price change, accelerating downward between highs of 136.58 and lows of 101.93, supported by a high volatility level of 8.9 std deviation.
APA Corporation also showed a bearish trend over the same period, declining by -20.18%, with accelerating losses and moderate volatility at 4.79 std deviation, ranging from 35.74 to 15.04 in price.
Comparatively, APA suffered a steeper overall decline, while EOG’s losses were more moderate; APA showed recent bullish momentum, unlike EOG’s slightly bearish recent trend.
Target Prices
Analysts provide a clear price consensus for EOG Resources, Inc. and APA Corporation, reflecting cautious optimism in the energy sector.
| Company | Target High | Target Low | Consensus |
|---|---|---|---|
| EOG Resources, Inc. | 170 | 124 | 139.45 |
| APA Corporation | 40 | 21 | 26.75 |
For EOG, the consensus target of 139.45 USD suggests a potential upside of about 33% from the current price of 104.92 USD. APA’s consensus target of 26.75 USD is close to its current price of 25.20 USD, indicating limited near-term upside.
Analyst Opinions Comparison
This section compares analysts’ ratings and grades for EOG Resources, Inc. and APA Corporation:
Rating Comparison
EOG Rating
- Rating: Both companies have an A- rating, indicating a very favorable status.
- Discounted Cash Flow Score: EOG scores 5, considered very favorable.
- ROE Score: Both EOG and APA score 5, representing very favorable returns.
- ROA Score: Both companies have a score of 5, indicating very favorable asset use.
- Debt To Equity Score: EOG scores 2, reflecting moderate financial risk.
- Overall Score: Both companies share an overall score of 4, considered favorable.
APA Rating
- Rating: Both companies have an A- rating, indicating a very favorable status.
- Discounted Cash Flow Score: APA scores 3, considered moderate.
- ROE Score: Both EOG and APA score 5, representing very favorable returns.
- ROA Score: Both companies have a score of 5, indicating very favorable asset use.
- Debt To Equity Score: APA scores 1, indicating very unfavorable financial risk.
- Overall Score: Both companies share an overall score of 4, considered favorable.
Which one is the best rated?
Both EOG and APA have the same A- rating and overall score of 4. EOG outperforms APA in discounted cash flow and has a stronger debt-to-equity score, making EOG slightly better rated based on provided data.
Scores Comparison
Here is a comparison of the Altman Z-Score and Piotroski Score for both companies:
EOG Scores
- Altman Z-Score: 3.34, in the safe zone indicating low bankruptcy risk.
- Piotroski Score: 5, classified as average financial strength.
APA Scores
- Altman Z-Score: 1.48, in the distress zone indicating high bankruptcy risk.
- Piotroski Score: 6, classified as average financial strength.
Which company has the best scores?
EOG has a significantly higher Altman Z-Score, placing it in the safe zone, while APA is in the distress zone. APA’s Piotroski Score is slightly better but both remain in the average range. Overall, EOG shows stronger financial stability based on these scores.
Grades Comparison
The following presents the latest reliable grades and ratings for EOG Resources, Inc. and APA Corporation:
EOG Resources, Inc. Grades
This table summarizes recent analyst grades and actions for EOG Resources, Inc. from verified grading companies.
| Grading Company | Action | New Grade | Date |
|---|---|---|---|
| Bernstein | Maintain | Market Perform | 2026-01-05 |
| Citigroup | Maintain | Neutral | 2025-12-17 |
| Mizuho | Maintain | Neutral | 2025-12-12 |
| UBS | Maintain | Buy | 2025-12-12 |
| Piper Sandler | Maintain | Neutral | 2025-11-18 |
| Wells Fargo | Maintain | Overweight | 2025-11-11 |
| Piper Sandler | Maintain | Neutral | 2025-10-21 |
| Susquehanna | Maintain | Positive | 2025-10-20 |
| Wells Fargo | Maintain | Overweight | 2025-10-17 |
| Morgan Stanley | Maintain | Equal Weight | 2025-10-14 |
Overall, EOG’s grades reflect a generally positive consensus with multiple “Buy” and “Overweight” ratings and no downgrades.
APA Corporation Grades
This table summarizes recent analyst grades and actions for APA Corporation from verified grading companies.
| Grading Company | Action | New Grade | Date |
|---|---|---|---|
| Bernstein | Maintain | Market Perform | 2026-01-05 |
| Mizuho | Maintain | Underperform | 2025-12-12 |
| UBS | Maintain | Neutral | 2025-12-12 |
| Johnson Rice | Upgrade | Accumulate | 2025-12-05 |
| Citigroup | Maintain | Neutral | 2025-11-26 |
| Goldman Sachs | Maintain | Sell | 2025-11-21 |
| Piper Sandler | Maintain | Neutral | 2025-11-18 |
| RBC Capital | Maintain | Sector Perform | 2025-11-17 |
| Susquehanna | Maintain | Positive | 2025-11-12 |
| UBS | Maintain | Neutral | 2025-11-10 |
APA displays a mixed rating profile including “Underperform” and “Sell” grades alongside some “Neutral” and “Accumulate” ratings.
Which company has the best grades?
EOG Resources, Inc. holds a stronger and more consistent set of grades with a “Buy” consensus, whereas APA Corporation’s grades are more mixed and less favorable, reflected by a “Hold” consensus. This contrast suggests differing analyst confidence levels, which may influence investor risk assessments and portfolio positioning.
Strengths and Weaknesses
Below is a comparison of key strengths and weaknesses of EOG Resources, Inc. (EOG) and APA Corporation (APA) based on recent financial and operational data.
| Criterion | EOG Resources, Inc. | APA Corporation |
|---|---|---|
| Diversification | Strong focus on oil and natural gas segments with integrated marketing and processing capabilities | Primarily oil and gas production with less segment diversification |
| Profitability | High net margin (27.4%), strong ROE (21.8%), ROIC (14.8%) well above WACC (5.9%) | Moderate net margin (8.3%), decent ROE (15.2%), ROIC (14.0%) above WACC (6.2%) |
| Innovation | Demonstrates durable competitive advantage with growing ROIC, indicating efficient capital use and innovation in operations | Also shows value creation with growing ROIC, but less pronounced growth than EOG |
| Global presence | Significant presence in the United States and Trinidad and Tobago with diversified geographical revenue streams | Focused predominantly on U.S. operations, with less international exposure |
| Market Share | Larger revenue base with $13.9B oil and condensate sales in 2024, solid market positioning | Smaller revenue at $8.2B excluding purchased oil & gas, indicating smaller market share |
Key takeaways: EOG Resources stands out with stronger profitability, diversification, and global reach, supported by a very favorable economic moat. APA shows solid value creation but with a narrower focus and moderate profitability, suggesting a slightly higher risk profile for investors seeking growth and diversification.
Risk Analysis
Below is a comparative table highlighting key risks associated with EOG Resources, Inc. and APA Corporation as of 2026:
| Metric | EOG Resources, Inc. | APA Corporation |
|---|---|---|
| Market Risk | Moderate (Beta 0.50) | Moderate (Beta 0.74) |
| Debt level | Low (D/E 0.17, favorable) | High (D/E 1.17, unfavorable) |
| Regulatory Risk | Moderate, US & Trinidad focus | Moderate, US, Egypt, UK, Suriname |
| Operational Risk | Moderate, large US operations | Moderate, diversified regions |
| Environmental Risk | Elevated (Oil & Gas sector) | Elevated (Oil & Gas sector) |
| Geopolitical Risk | Moderate (Trinidad exposure) | Higher (Egypt, Suriname exposure) |
The highest risk for APA stems from its elevated debt level and geopolitical exposure in politically sensitive regions, increasing financial and operational vulnerability. EOG shows stronger financial health with low debt and safer asset allocation, though environmental and regulatory risks remain inherent to the oil and gas industry. Investors should weigh APA’s financial leverage and geopolitical risks carefully against EOG’s more stable profile.
Which Stock to Choose?
EOG Resources, Inc. shows strong income growth over 2020-2024 with a favorable income statement despite recent slight declines. Its financial ratios are largely favorable, highlighting solid profitability, low debt, and a very favorable rating of A-. The company maintains a very favorable moat with a growing ROIC above WACC and demonstrates financial stability with safe zone Altman Z-Score.
APA Corporation exhibits favorable income metrics with positive revenue growth overall, though recent earnings declines are marked. Financial ratios are slightly favorable, reflecting moderate profitability and higher debt levels, but it holds a very favorable rating of A-. APA also has a very favorable moat with increasing ROIC above WACC, yet it faces financial distress signals with an Altman Z-Score in the distress zone.
Considering ratings, income, and financial ratios, EOG might appear more stable and profitable with stronger debt management, suiting risk-averse or quality-focused investors. APA’s profile, with higher debt and recent volatility, could be interpreted as more suitable for risk-tolerant investors seeking growth potential despite elevated risk.
Disclaimer: Investment carries a risk of loss of initial capital. The past performance is not a reliable indicator of future results. Be sure to understand risks before making an investment decision.
Go Further
I encourage you to read the complete analyses of EOG Resources, Inc. and APA Corporation to enhance your investment decisions: