In the ever-evolving energy sector, Diamondback Energy, Inc. (FANG) and APA Corporation (APA) stand out as prominent players in oil and gas exploration and production. Both companies operate extensively in the Permian Basin, leveraging innovative strategies to optimize resource development and midstream infrastructure. This comparison reveals key differences and opportunities, guiding investors toward the energy stock best suited to their portfolio goals. Let’s explore which company offers the most compelling investment case.
Table of contents
Companies Overview
I will begin the comparison between Diamondback Energy, Inc. and APA Corporation by providing an overview of these two companies and their main differences.
Diamondback Energy, Inc. Overview
Diamondback Energy, Inc. is an independent oil and natural gas company focused on acquiring, developing, exploring, and exploiting unconventional and onshore reserves in the Permian Basin, West Texas. It holds significant acreage and producing wells in the Midland and Delaware basins, alongside midstream infrastructure such as pipelines and water systems. Founded in 2007, it operates primarily in the US energy sector.
APA Corporation Overview
APA Corporation explores, develops, and produces oil and gas properties with operations spanning the US, Egypt, the UK, and offshore Suriname. It also manages gathering, processing, and transmission assets in West Texas and owns interests in Permian-to-Gulf Coast pipelines. Founded in 1954 and based in Houston, APA is a diversified energy company with a global footprint and a longer operational history.
Key similarities and differences
Both companies operate in the oil and gas exploration and production industry with significant interests in the Permian Basin and midstream assets. Diamondback Energy focuses primarily on US onshore unconventional reserves, while APA has a more international presence with assets in multiple countries. Diamondback is younger with concentrated operations, whereas APA maintains a broader geographic scope and diverse pipeline ownership.
Income Statement Comparison
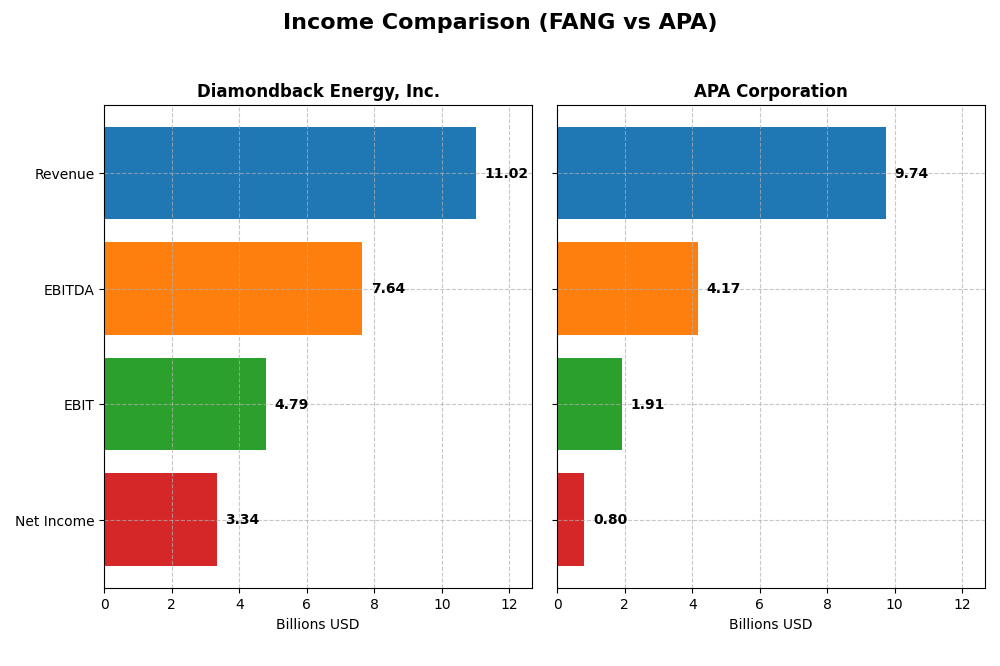
The following table presents a side-by-side comparison of key income statement metrics for Diamondback Energy, Inc. (FANG) and APA Corporation (APA) for the fiscal year 2024.
| Metric | Diamondback Energy, Inc. (FANG) | APA Corporation (APA) |
|---|---|---|
| Market Cap | 42.9B | 8.9B |
| Revenue | 11.0B | 9.7B |
| EBITDA | 7.64B | 4.17B |
| EBIT | 4.79B | 1.91B |
| Net Income | 3.34B | 804M |
| EPS | 15.53 | 2.28 |
| Fiscal Year | 2024 | 2024 |
Income Statement Interpretations
Diamondback Energy, Inc.
Diamondback Energy showed strong revenue growth from 2020 to 2024, with a notable jump to $11B in 2024. Net income rebounded significantly after a loss in 2020, reaching $3.34B in 2024. Margins remained robust, with gross and EBIT margins above 40%. In 2024, revenue growth accelerated, but net margin and EPS declined, indicating margin pressure despite higher sales.
APA Corporation
APA Corporation’s revenue rose steadily to $9.74B in 2024, with net income also increasing overall, albeit more modestly at $804M in 2024. Gross and EBIT margins were favorable but lower than Diamondback’s, with net margin at 8.26%. The latest year saw slowed EBIT and net margin growth, with EPS declining sharply, reflecting operational challenges despite revenue gains.
Which one has the stronger fundamentals?
Diamondback Energy demonstrates stronger fundamentals with higher margins, more pronounced revenue and net income growth, and better profitability ratios. APA shows consistent progress but struggles with lower margins and recent declines in EBIT and EPS. Both companies are favorable overall, yet Diamondback’s superior margin stability and growth metrics suggest a more resilient income statement profile.
Financial Ratios Comparison
The table below presents a side-by-side comparison of key financial ratios for Diamondback Energy, Inc. (FANG) and APA Corporation (APA) based on their most recent fiscal year data from 2024.
| Ratios | Diamondback Energy, Inc. (FANG) | APA Corporation (APA) |
|---|---|---|
| ROE | 8.85% | 15.23% |
| ROIC | 5.75% | 14.03% |
| P/E | 10.48 | 10.14 |
| P/B | 0.93 | 1.54 |
| Current Ratio | 0.44 | 1.15 |
| Quick Ratio | 0.41 | 1.01 |
| D/E | 0.33 | 1.17 |
| Debt-to-Assets | 18.47% | 31.78% |
| Interest Coverage | 15.11 | 8.44 |
| Asset Turnover | 0.16 | 0.50 |
| Fixed Asset Turnover | 0.17 | 0.77 |
| Payout ratio | 47.27% | 43.91% |
| Dividend yield | 4.51% | 4.33% |
Interpretation of the Ratios
Diamondback Energy, Inc.
Diamondback Energy shows a generally favorable ratio profile with strong net margin at 30.28% and a favorable P/E of 10.48, though its return on equity at 8.85% is less convincing. Liquidity ratios are weak, with a current ratio of 0.44, raising concerns about short-term obligations. The company pays a solid dividend yielding 4.51%, well-covered by free cash flow, but risks include tight liquidity and moderate leverage.
APA Corporation
APA Corporation presents a mixed ratio picture with a moderate net margin of 8.26% and strong returns on equity (15.23%) and invested capital (14.03%). Liquidity ratios are healthier than its peer, with a current ratio of 1.15 and a quick ratio of 1.01, indicating better short-term financial stability. APA pays a 4.33% dividend, supported by consistent cash flow, while its higher debt-to-equity ratio of 1.17 signals elevated leverage risk.
Which one has the best ratios?
Diamondback Energy exhibits a higher proportion of favorable ratios overall, particularly in profitability and valuation metrics, despite weaker liquidity. APA’s ratios suggest better liquidity and leverage management but with more neutral profitability. The choice depends on weighing profitability strength against liquidity and leverage considerations, as both companies present a blend of strengths and vulnerabilities.
Strategic Positioning
This section compares the strategic positioning of Diamondback Energy, Inc. and APA Corporation, including Market position, Key segments, and disruption:
Diamondback Energy, Inc.
- Leading independent oil and natural gas producer in the Permian Basin with moderate competitive pressure.
- Focused on upstream services and midstream infrastructure in Permian Basin, including pipelines and water systems.
- Exposure mainly to conventional oil and gas production with no explicit mention of technological disruption.
APA Corporation
- Operates oil and gas exploration in US, Egypt, UK, and Suriname with broader geographic footprint.
- Revenue driven by oil and gas production, including purchased volumes, with significant pipeline ownership.
- No explicit exposure to technological disruption mentioned; operates both onshore and offshore assets.
Diamondback Energy, Inc. vs APA Corporation Positioning
Diamondback Energy is concentrated in the Permian Basin with integrated upstream and midstream assets, while APA has a more diversified geographic presence and asset mix. Diamondback’s focus may limit expansion, whereas APA’s breadth offers wider exposure but possibly more complexity.
Which has the best competitive advantage?
APA demonstrates a very favorable moat with growing ROIC well above WACC, indicating strong value creation and durable competitive advantage. Diamondback shows a slightly favorable moat with growing ROIC but currently shedding value, suggesting weaker competitive strength.
Stock Comparison
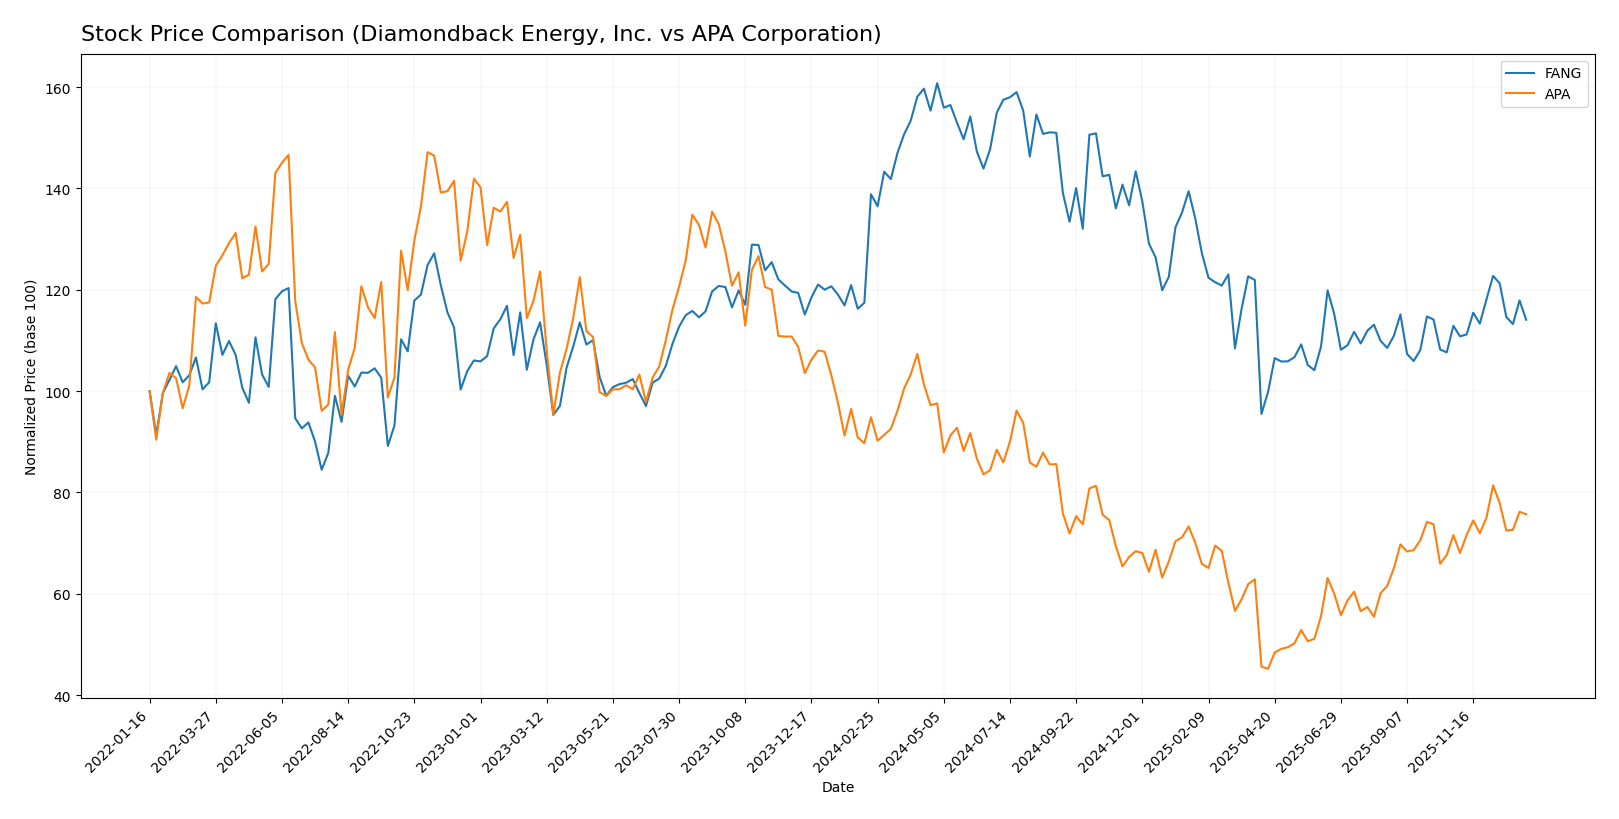
The stock price movements of Diamondback Energy, Inc. (FANG) and APA Corporation (APA) over the past year reveal distinct bearish trends with accelerating declines, punctuated by recent modest recoveries in both securities.
Trend Analysis
Diamondback Energy, Inc. (FANG) experienced a bearish trend over the past 12 months with a price decline of 17.84%, showing acceleration and high volatility, reaching a peak of 207.76 and a low of 123.37. Recent weeks show a slight positive change of 1.06%, indicating a mild recovery.
APA Corporation (APA) also followed a bearish trajectory with a 20.18% price drop over the last year, accompanied by acceleration and lower volatility than FANG. The stock ranged between 15.04 and 35.74, with recent gains of 5.75%, suggesting a stronger short-term rebound.
Comparing both, APA’s stock has delivered the highest market performance recently, with a larger positive price change in the last quarter, despite both stocks sharing similar long-term bearish trends and accelerating declines.
Target Prices
The current analyst consensus for target prices indicates a generally optimistic outlook for these energy companies.
| Company | Target High | Target Low | Consensus |
|---|---|---|---|
| Diamondback Energy, Inc. | 219 | 162 | 185.36 |
| APA Corporation | 40 | 21 | 26.75 |
Analysts expect Diamondback Energy’s shares to appreciate from the current price of 147.41 USD toward a consensus target of 185.36 USD. APA Corporation’s target consensus of 26.75 USD slightly exceeds its current price of 25.20 USD, suggesting moderate upside potential.
Analyst Opinions Comparison
This section compares analysts’ ratings and grades for Diamondback Energy, Inc. (FANG) and APA Corporation (APA):
Rating Comparison
FANG Rating
- Rating: A- with a very favorable status.
- Discounted Cash Flow Score: 5, rated very favorable, indicating strong valuation.
- ROE Score: 4, favorable, showing efficient profit generation from equity.
- ROA Score: 4, favorable, reflecting effective asset utilization.
- Debt To Equity Score: 2, moderate, indicating moderate financial risk.
- Overall Score: 4, favorable overall financial standing.
APA Rating
- Rating: A- with a very favorable status.
- Discounted Cash Flow Score: 3, moderate rating, suggesting average valuation.
- ROE Score: 5, very favorable, indicating excellent profit generation.
- ROA Score: 5, very favorable, demonstrating superior asset use.
- Debt To Equity Score: 1, very unfavorable, indicating high financial risk.
- Overall Score: 4, favorable overall financial standing.
Which one is the best rated?
Both companies share the same overall rating of A- and a favorable overall score of 4. FANG excels in discounted cash flow and has a lower financial risk, while APA leads in profitability metrics but carries higher financial risk.
Scores Comparison
The comparison of scores between Diamondback Energy, Inc. (FANG) and APA Corporation (APA) is as follows:
FANG Scores
- Altman Z-Score: 1.33, in distress zone, indicating financial distress risk.
- Piotroski Score: 5, considered average financial strength.
APA Scores
- Altman Z-Score: 1.48, in distress zone, showing financial distress risk.
- Piotroski Score: 6, considered average financial strength.
Which company has the best scores?
Based strictly on the data, APA has slightly higher scores in both Altman Z-Score and Piotroski Score, indicating marginally better financial health compared to FANG. Both remain in the distress zone for bankruptcy risk and average for financial strength.
Grades Comparison
Here is the grades comparison for Diamondback Energy, Inc. and APA Corporation:
Diamondback Energy, Inc. Grades
The table below summarizes recent grades from recognized grading companies for Diamondback Energy, Inc.:
| Grading Company | Action | New Grade | Date |
|---|---|---|---|
| Wells Fargo | Maintain | Overweight | 2024-10-18 |
| Susquehanna | Maintain | Positive | 2024-10-18 |
| Keybanc | Maintain | Overweight | 2024-10-16 |
| Truist Securities | Maintain | Buy | 2024-10-16 |
| Piper Sandler | Maintain | Overweight | 2024-10-15 |
| Scotiabank | Maintain | Sector Outperform | 2024-10-10 |
| BMO Capital | Upgrade | Outperform | 2024-10-04 |
| Benchmark | Maintain | Buy | 2024-10-03 |
| Barclays | Upgrade | Overweight | 2024-10-02 |
| Wells Fargo | Maintain | Overweight | 2024-10-01 |
Overall, Diamondback Energy, Inc. shows a strong positive trend in grades with multiple upgrades and consistent buy/overweight ratings.
APA Corporation Grades
The following table presents recent grades from recognized grading companies for APA Corporation:
| Grading Company | Action | New Grade | Date |
|---|---|---|---|
| Bernstein | Maintain | Market Perform | 2026-01-05 |
| Mizuho | Maintain | Underperform | 2025-12-12 |
| UBS | Maintain | Neutral | 2025-12-12 |
| Johnson Rice | Upgrade | Accumulate | 2025-12-05 |
| Citigroup | Maintain | Neutral | 2025-11-26 |
| Goldman Sachs | Maintain | Sell | 2025-11-21 |
| Piper Sandler | Maintain | Neutral | 2025-11-18 |
| RBC Capital | Maintain | Sector Perform | 2025-11-17 |
| Susquehanna | Maintain | Positive | 2025-11-12 |
| UBS | Maintain | Neutral | 2025-11-10 |
The overall grading for APA Corporation is mixed, with several neutral and hold ratings, a notable sell rating, and few upgrades.
Which company has the best grades?
Diamondback Energy, Inc. has received markedly stronger and more consistent buy and outperform ratings compared to APA Corporation’s mixed and cautious grades. This could imply a more favorable perception of Diamondback’s growth prospects and risk profile by analysts.
Strengths and Weaknesses
Below is a comparative overview of key strengths and weaknesses for Diamondback Energy, Inc. (FANG) and APA Corporation (APA) based on recent financial and operational data.
| Criterion | Diamondback Energy, Inc. (FANG) | APA Corporation (APA) |
|---|---|---|
| Diversification | Moderate: Primarily upstream services with some midstream revenue; limited product variety | Moderate: Focus on oil and gas production, including purchased volumes; less diversified |
| Profitability | Mixed: High net margin (30.28%) but lower ROE (8.85%) and neutral ROIC (5.75%) | Strong: ROE (15.23%) and ROIC (14.03%) favorable, net margin moderate (8.26%) |
| Innovation | Neutral: No significant innovation indicators reported | Neutral to Favorable: No direct data, but growing ROIC suggests operational improvements |
| Global presence | Limited: Mainly domestic operations in upstream and midstream segments | Limited: Focus on oil and gas with some purchased volumes, primarily domestic |
| Market Share | Moderate: Upstream services dominate with $8.3B revenue (2023) | Larger scale: $9.8B combined oil and gas revenue (2024) indicating strong market position |
Key takeaways: APA demonstrates a stronger profitability profile with a very favorable moat and growing returns on capital, while Diamondback Energy shows increasing profitability but has some operational efficiency and liquidity concerns. Investors should weigh APA’s durability and scale against FANG’s growth potential and value pricing.
Risk Analysis
Below is a comparative table of key risks for Diamondback Energy, Inc. (FANG) and APA Corporation (APA) for the year 2024:
| Metric | Diamondback Energy, Inc. (FANG) | APA Corporation (APA) |
|---|---|---|
| Market Risk | Moderate (Beta 0.58) | Moderate (Beta 0.74) |
| Debt level | Low (Debt/Equity 0.33, Favorable) | High (Debt/Equity 1.17, Unfavorable) |
| Regulatory Risk | Moderate (US onshore focused) | Elevated (US + Egypt, UK, Suriname) |
| Operational Risk | Moderate (Midstream & exploration) | Moderate (Diverse geographic ops) |
| Environmental Risk | Moderate (Permian Basin operations) | Moderate to High (Multiple basins, offshore) |
| Geopolitical Risk | Low (Primarily US operations) | Moderate (International exposure) |
The most impactful risks are APA’s elevated debt level and geopolitical exposure due to its international operations, which may heighten financial and regulatory uncertainties. Diamondback shows stronger balance sheet health but faces typical market and environmental risks tied to oil & gas exploration in the Permian Basin. Both companies’ Altman Z-Scores place them in the distress zone, suggesting caution.
Which Stock to Choose?
Diamondback Energy, Inc. (FANG) shows a strong income evolution with 291.86% revenue growth over five years and a 30.28% net margin in 2024. Its financial ratios are largely favorable, though liquidity ratios are weak. Profitability is solid with a return on equity of 8.85%, moderate debt levels, and a very favorable A- rating.
APA Corporation (APA) exhibits steady income growth of 119.55% over five years and an 8.26% net margin in 2024. Its financial ratios are slightly favorable overall, with stronger liquidity but higher leverage. Profitability is notable with a return on equity of 15.23%, higher debt-to-equity ratio, and also a very favorable A- rating.
For risk-averse investors prioritizing financial stability and strong competitive advantage, APA’s very favorable moat and higher return on equity might appear more suitable. Conversely, growth-oriented investors may find FANG’s robust income growth and favorable ratio profile more appealing despite its weaker liquidity metrics.
Disclaimer: Investment carries a risk of loss of initial capital. The past performance is not a reliable indicator of future results. Be sure to understand risks before making an investment decision.
Go Further
I encourage you to read the complete analyses of Diamondback Energy, Inc. and APA Corporation to enhance your investment decisions: