Choosing the right energy stocks is crucial in today’s volatile market, especially within oil and gas exploration and production. Devon Energy Corporation (DVN) and APA Corporation (APA) stand out as key players, sharing this industry but differing in geographic reach and innovation strategies. Both companies offer unique growth potentials and risks. In this analysis, I will help you determine which stock might be the more compelling addition to your investment portfolio.
Table of contents
Companies Overview
I will begin the comparison between Devon Energy Corporation and APA Corporation by providing an overview of these two companies and their main differences.
Devon Energy Corporation Overview
Devon Energy Corporation is an independent energy company focused on the exploration, development, and production of oil, natural gas, and natural gas liquids within the United States. Founded in 1971 and headquartered in Oklahoma City, Oklahoma, Devon operates approximately 5,134 gross wells. It is listed on the New York Stock Exchange and employs around 2,300 full-time staff.
APA Corporation Overview
APA Corporation explores, develops, and produces oil and gas properties through its subsidiaries, with operations in the United States, Egypt, the United Kingdom, and offshore Suriname. Founded in 1954 and based in Houston, Texas, APA also manages gathering, processing, and transmission assets in West Texas and owns stakes in multiple pipelines. The company is listed on the NASDAQ Global Select and has about 2,305 full-time employees.
Key similarities and differences
Both Devon and APA operate in the oil and gas exploration and production industry within the energy sector and are headquartered in the United States with similar employee counts. Devon’s activities are primarily domestic, while APA has a more international footprint including operations in Egypt, the UK, and Suriname. Both firms are publicly traded but on different exchanges, NYSE for Devon and NASDAQ for APA, reflecting their distinct market presences.
Income Statement Comparison
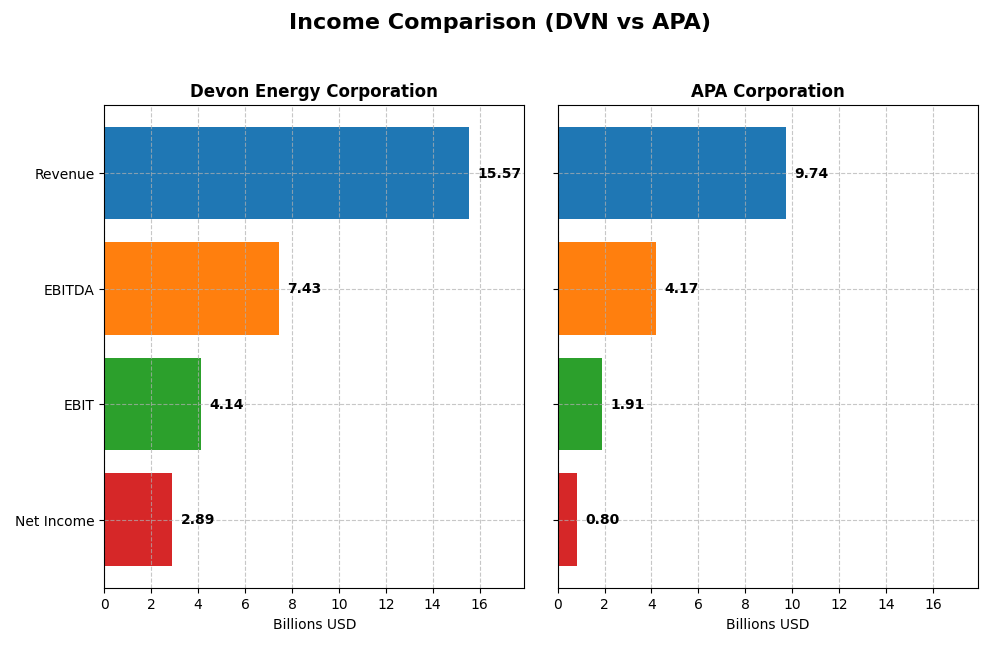
The table below compares the key income statement metrics for Devon Energy Corporation and APA Corporation for the fiscal year 2024, providing a snapshot of their financial performance.
| Metric | Devon Energy Corporation | APA Corporation |
|---|---|---|
| Market Cap | 22.9B | 8.9B |
| Revenue | 15.6B | 9.7B |
| EBITDA | 7.4B | 4.2B |
| EBIT | 4.1B | 1.9B |
| Net Income | 2.9B | 804M |
| EPS | 4.57 | 2.28 |
| Fiscal Year | 2024 | 2024 |
Income Statement Interpretations
Devon Energy Corporation
Devon Energy’s revenue increased significantly over the 2020-2024 period, reaching $15.57B in 2024, though it experienced a slight 2.82% decline in growth last year. Net income showed strong overall growth but dropped to $2.89B in 2024 from $3.75B in 2023. Margins remain favorable, with a 27.43% gross margin and 18.57% net margin, despite a recent contraction in profitability.
APA Corporation
APA Corporation’s revenue rose steadily to $9.74B in 2024, reflecting a 17.61% growth over the previous year. Net income fell sharply to $804M in 2024 from $2.86B in 2023, with net margin contracting to 8.26%. Gross margin remains strong at 44.18%, but EBIT and net income margins contracted significantly, indicating margin pressure despite revenue growth.
Which one has the stronger fundamentals?
Both companies demonstrate favorable income statement fundamentals overall, but Devon Energy shows stronger profitability margins and a more resilient net margin. APA’s higher revenue growth is offset by steep declines in net income and margins last year. Devon’s financials suggest more stable earnings, while APA faces challenges maintaining profitability despite growth.
Financial Ratios Comparison
Below is a comparison of key financial ratios for Devon Energy Corporation (DVN) and APA Corporation (APA) for the fiscal year 2024.
| Ratios | Devon Energy Corporation (DVN) | APA Corporation (APA) |
|---|---|---|
| ROE | 19.94% | 15.23% |
| ROIC | 10.80% | 14.03% |
| P/E | 7.05 | 10.14 |
| P/B | 1.41 | 1.54 |
| Current Ratio | 1.04 | 1.15 |
| Quick Ratio | 0.95 | 1.01 |
| D/E (Debt-to-Equity) | 0.63 | 1.17 |
| Debt-to-Assets | 30.18% | 31.78% |
| Interest Coverage | 9.40 | 8.44 |
| Asset Turnover | 0.51 | 0.50 |
| Fixed Asset Turnover | 0.61 | 0.77 |
| Payout ratio | 32.41% | 43.91% |
| Dividend yield | 4.60% | 4.33% |
Interpretation of the Ratios
Devon Energy Corporation
Devon Energy’s financial ratios are largely favorable, with strong net margin (18.57%), ROE (19.94%), and ROIC (10.8%) indicating efficient profitability and capital use. However, its fixed asset turnover is unfavorable, suggesting potential inefficiencies in asset utilization. The dividend yield is attractive at 4.6%, supported by a consistent payout, but free cash flow coverage appears weak, posing sustainability concerns.
APA Corporation
APA Corporation shows mixed ratio results, with favorable ROE (15.23%) and ROIC (14.03%), but a neutral net margin (8.26%) and some unfavorable leverage with a debt-to-equity ratio of 1.17. The dividend yield is solid at 4.33%, complemented by stable payouts. Still, the higher debt level raises caution about risk management and financial flexibility in future distributions.
Which one has the best ratios?
Devon Energy displays a more favorable overall ratio profile, with a higher proportion of favorable metrics and stronger profitability indicators. APA is slightly favorable but has more neutral and unfavorable leverage ratios, which temper its financial strength. Devon’s better balance of profitability and dividend yield underpins a comparatively stronger ratio assessment.
Strategic Positioning
This section compares the strategic positioning of Devon Energy Corporation and APA Corporation regarding market position, key segments, and exposure to technological disruption:
Devon Energy Corporation
- Larger market cap with NYSE listing, facing typical industry competitive pressures.
- Focuses on oil, natural gas, and NGL sales primarily in the U.S. with substantial well operations.
- No explicit mention of technological disruption exposure in available data.
APA Corporation
- Smaller market cap, listed on NASDAQ, operating in multiple geographies.
- Diversified geographically with operations in U.S., Egypt, UK, and offshore Suriname.
- No explicit mention of technological disruption exposure in available data.
Devon Energy Corporation vs APA Corporation Positioning
Devon Energy has a concentrated U.S. operational focus with a large production base, while APA shows geographic diversification including international assets. Devon’s strategy may emphasize scale in a single market; APA leverages broader regional presence but with smaller market capitalization.
Which has the best competitive advantage?
Both companies have very favorable moat evaluations with growing ROIC above WACC indicating durable competitive advantages. APA shows higher ROIC growth and value creation, suggesting a stronger capital efficiency edge based on the available MOAT data.
Stock Comparison
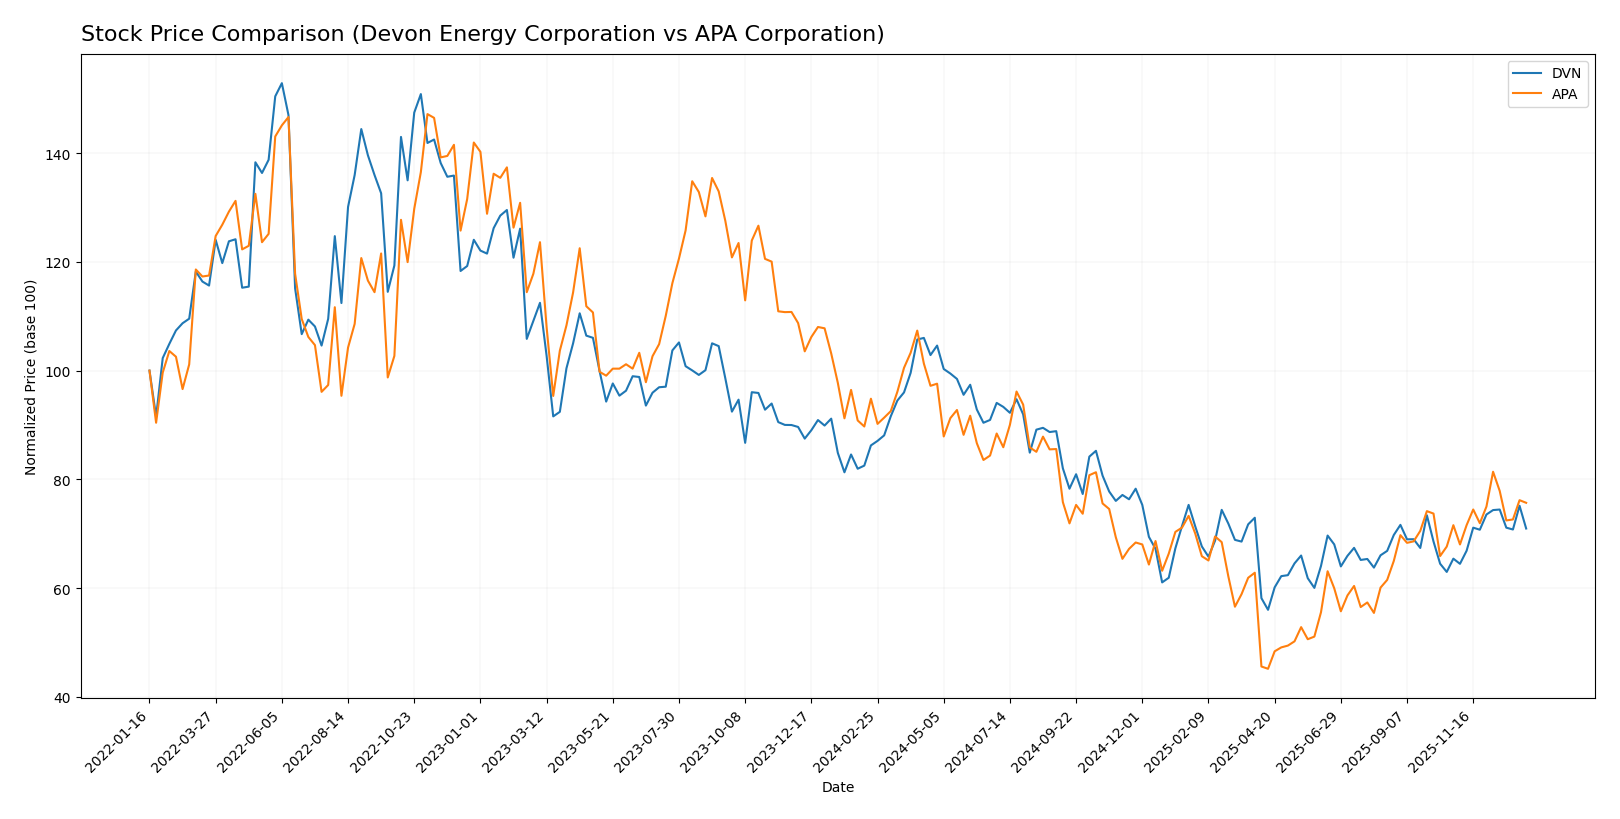
The stock prices of Devon Energy Corporation (DVN) and APA Corporation (APA) over the past 12 months reveal pronounced bearish trends with accelerating declines, followed by a recent rebound period indicating a shift towards positive momentum.
Trend Analysis
Devon Energy Corporation experienced a -17.72% price change over the past year, confirming a bearish trend with accelerating decline and notable volatility (6.4 std deviation). A recent 8.46% positive rebound suggests a short-term recovery.
APA Corporation showed a -20.18% price drop over the last 12 months, also reflecting an accelerating bearish trend with moderate volatility (4.79 std deviation). Its recent 5.75% rise indicates a modest recovery phase.
Comparing both, Devon Energy’s stock delivered a slightly stronger recent rebound and overall higher market performance despite both showing bearish annual trends with accelerating declines.
Target Prices
Analysts provide a clear consensus on target prices for Devon Energy Corporation and APA Corporation.
| Company | Target High | Target Low | Consensus |
|---|---|---|---|
| Devon Energy Corporation | 48 | 40 | 43.5 |
| APA Corporation | 40 | 21 | 26.75 |
The consensus target for Devon Energy (43.5) suggests a potential upside from its current price of 35.76, while APA’s consensus target (26.75) indicates a modest gain above its current price of 25.2. Overall, analysts expect moderate appreciation for both stocks.
Analyst Opinions Comparison
This section compares analysts’ ratings and grades for Devon Energy Corporation and APA Corporation:
Rating Comparison
Devon Energy Corporation Rating
- Rating: A-, rated Very Favorable by analysts.
- Discounted Cash Flow Score: 4, indicating favorable valuation.
- ROE Score: 5, showing very favorable profit generation efficiency.
- ROA Score: 5, reflecting very effective asset utilization.
- Debt To Equity Score: 1, considered very unfavorable due to high debt risk.
- Overall Score: 4, indicating a favorable overall financial standing.
APA Corporation Rating
- Rating: A-, rated Very Favorable by analysts.
- Discounted Cash Flow Score: 3, indicating moderate valuation.
- ROE Score: 5, showing very favorable profit generation efficiency.
- ROA Score: 5, reflecting very effective asset utilization.
- Debt To Equity Score: 1, considered very unfavorable due to high debt risk.
- Overall Score: 4, indicating a favorable overall financial standing.
Which one is the best rated?
Both Devon Energy Corporation and APA Corporation share the same overall rating of A- and an identical overall score of 4. Devon Energy scores higher in discounted cash flow, while other key financial metrics are equal, making their ratings closely comparable.
Scores Comparison
The scores comparison between Devon Energy Corporation and APA Corporation is as follows:
Devon Energy Corporation Scores
- Altman Z-Score: 2.29, indicating moderate bankruptcy risk in the grey zone.
- Piotroski Score: 5, reflecting average financial strength.
APA Corporation Scores
- Altman Z-Score: 1.48, indicating high bankruptcy risk in the distress zone.
- Piotroski Score: 6, reflecting average financial strength.
Which company has the best scores?
Devon Energy Corporation has a higher Altman Z-Score, indicating lower bankruptcy risk than APA Corporation. APA has a slightly better Piotroski Score, but both remain in the average range.
Grades Comparison
The following presents the recent grades assigned to Devon Energy Corporation and APA Corporation by respected grading firms:
Devon Energy Corporation Grades
This table summarizes recent grades from established grading companies for Devon Energy Corporation:
| Grading Company | Action | New Grade | Date |
|---|---|---|---|
| Bernstein | Maintain | Outperform | 2026-01-05 |
| Roth Capital | Maintain | Buy | 2025-12-31 |
| Citigroup | Maintain | Buy | 2025-12-17 |
| UBS | Upgrade | Buy | 2025-12-12 |
| Mizuho | Maintain | Outperform | 2025-12-12 |
| Morgan Stanley | Maintain | Overweight | 2025-12-11 |
| JP Morgan | Upgrade | Overweight | 2025-12-08 |
| Piper Sandler | Maintain | Overweight | 2025-11-18 |
| Susquehanna | Maintain | Positive | 2025-11-12 |
| Susquehanna | Maintain | Positive | 2025-10-20 |
Devon Energy shows a consistent pattern of favorable grades, with multiple firms maintaining or upgrading to buy or outperform ratings over recent months.
APA Corporation Grades
This table summarizes recent grades from established grading companies for APA Corporation:
| Grading Company | Action | New Grade | Date |
|---|---|---|---|
| Bernstein | Maintain | Market Perform | 2026-01-05 |
| UBS | Maintain | Neutral | 2025-12-12 |
| Mizuho | Maintain | Underperform | 2025-12-12 |
| Johnson Rice | Upgrade | Accumulate | 2025-12-05 |
| Citigroup | Maintain | Neutral | 2025-11-26 |
| Goldman Sachs | Maintain | Sell | 2025-11-21 |
| Piper Sandler | Maintain | Neutral | 2025-11-18 |
| RBC Capital | Maintain | Sector Perform | 2025-11-17 |
| Susquehanna | Maintain | Positive | 2025-11-12 |
| UBS | Maintain | Neutral | 2025-11-10 |
APA Corporation’s grades predominantly range from neutral to underperform, with some upgrades but also a sell rating from Goldman Sachs, indicating mixed analyst sentiment.
Which company has the best grades?
Devon Energy Corporation has consistently received stronger grades, predominantly buy and outperform ratings, compared to APA Corporation’s more neutral and underperform evaluations. For investors, this suggests Devon Energy is currently viewed more favorably by analysts, potentially reflecting stronger confidence in its performance or growth prospects.
Strengths and Weaknesses
Below is a comparison table highlighting key strengths and weaknesses of Devon Energy Corporation (DVN) and APA Corporation (APA) based on the most recent financial and operational data.
| Criterion | Devon Energy Corporation (DVN) | APA Corporation (APA) |
|---|---|---|
| Diversification | Focused on NGL product sales with $11.2B revenue (2024); strong U.S. presence with historical Canadian segment | Primarily oil and gas production, including purchased volumes, with $9.7B total revenue (2024); less diversified product base |
| Profitability | High net margin of 18.57%, ROIC 10.8%, PE ratio 7.05; strong value creation and growing ROIC | Moderate net margin of 8.26%, ROIC 14.03%, PE ratio 10.14; also creating value with growing ROIC |
| Innovation | Demonstrates durable competitive advantage with increasing profitability | Shows durable competitive advantage but with higher debt levels, potentially limiting innovation investments |
| Global presence | Mainly North American operations, strong U.S. focus | Also predominantly U.S.-focused, with no significant international diversification |
| Market Share | Strong market position in NGL product sales and U.S. energy sector | Competitive in oil and gas production but faces higher leverage and moderate profitability |
Key takeaways: Both companies demonstrate very favorable economic moats with growing profitability. DVN shows stronger profitability margins and more conservative leverage, while APA has higher ROIC but carries more debt, which could affect risk management. Diversification is limited for both, focusing mainly on U.S. energy markets.
Risk Analysis
Below is a comparative table of key risks for Devon Energy Corporation (DVN) and APA Corporation (APA) as of 2026:
| Metric | Devon Energy Corporation (DVN) | APA Corporation (APA) |
|---|---|---|
| Market Risk | Moderate (Beta 0.655, stable oil prices) | Moderate (Beta 0.743, exposure to multiple regions) |
| Debt level | Moderate (D/E 0.63, neutral) | Elevated (D/E 1.17, unfavorable) |
| Regulatory Risk | Moderate (US-focused operations) | Higher (Operations in US, Egypt, UK, offshore Suriname) |
| Operational Risk | Moderate (5,134 gross wells, US operations) | Moderate to High (Complex international operations and pipelines) |
| Environmental Risk | Moderate (Energy sector emissions) | Moderate (Energy sector emissions, offshore activity) |
| Geopolitical Risk | Low to Moderate (US operations) | Elevated (Exposure to geopolitical instability in Egypt, offshore Suriname) |
The most impactful risks for both companies are debt levels and geopolitical exposures. APA’s higher debt ratio and international footprint introduce greater financial and regulatory uncertainties. Devon Energy benefits from a more stable US-only operation and a more favorable financial profile, but both face moderate market and environmental risks inherent to the oil and gas sector. Recent financial evaluations confirm APA’s elevated financial risk, while Devon remains in a more stable but cautious position.
Which Stock to Choose?
Devon Energy Corporation (DVN) shows a favorable income evolution over 2020-2024, with strong profitability metrics and an improving ROIC well above WACC, indicating value creation. Its financial ratios are largely favorable, though some leverage and asset turnover metrics are neutral or unfavorable. DVN holds a very favorable A- rating, despite a very unfavorable debt-to-equity score.
APA Corporation (APA) exhibits favorable income growth overall, with solid profitability and a very favorable moat rating due to a growing ROIC exceeding WACC. Financial ratios are slightly favorable but include higher debt levels and some neutral to unfavorable turnover measures. APA also has a very favorable A- rating, yet faces a very unfavorable debt-to-equity score and a distress-zone Altman Z-Score.
For investors prioritizing growth and value creation, DVN’s consistent and strong financial performance with a durable competitive advantage might appear more attractive. Conversely, risk-tolerant investors willing to consider slightly higher leverage and variability may find APA’s improving income and moat profile indicative of potential. Ultimately, the choice could depend on individual risk tolerance and investment focus.
Disclaimer: Investment carries a risk of loss of initial capital. The past performance is not a reliable indicator of future results. Be sure to understand risks before making an investment decision.
Go Further
I encourage you to read the complete analyses of Devon Energy Corporation and APA Corporation to enhance your investment decisions: