Coterra Energy Inc. (CTRA) and APA Corporation (APA) are two prominent players in the oil and gas exploration and production industry, both headquartered in Houston, Texas. While Coterra focuses heavily on U.S. shale plays like the Marcellus and Permian Basins, APA maintains a more diversified geographic presence including operations in Egypt and the U.K. Their overlapping markets and distinct approaches to resource development make them compelling subjects for comparison. In this article, I will analyze which company offers the most attractive investment opportunity for your portfolio.
Table of contents
Companies Overview
I will begin the comparison between Coterra Energy Inc. and APA Corporation by providing an overview of these two companies and their main differences.
Coterra Energy Inc. Overview
Coterra Energy Inc. is an independent oil and gas company focused on the exploration, development, and production of oil, natural gas, and natural gas liquids primarily in the United States. The company holds significant acreage in the Marcellus Shale, Permian Basin, and Anadarko Basin, with proved reserves of about 2.9B barrels of oil equivalent. Headquartered in Houston, Texas, Coterra operates natural gas and saltwater disposal gathering systems in Texas.
APA Corporation Overview
APA Corporation explores, develops, and produces oil and gas across the United States, Egypt, the United Kingdom, and offshore Suriname. The company also manages gathering, processing, and transmission assets in West Texas and owns stakes in Permian-to-Gulf Coast pipelines. Founded in 1954 and based in Houston, Texas, APA employs over 2,300 people, positioning it as a diversified energy producer with global operations.
Key similarities and differences
Both companies operate in the oil & gas exploration and production sector with headquarters in Houston, Texas, and focus on natural gas and oil assets, including Permian Basin interests. However, Coterra is more U.S.-centric with operations concentrated in specific basins and fewer employees, while APA has a broader geographic footprint including international sites and pipeline ownership, reflecting a more diversified operational model.
Income Statement Comparison
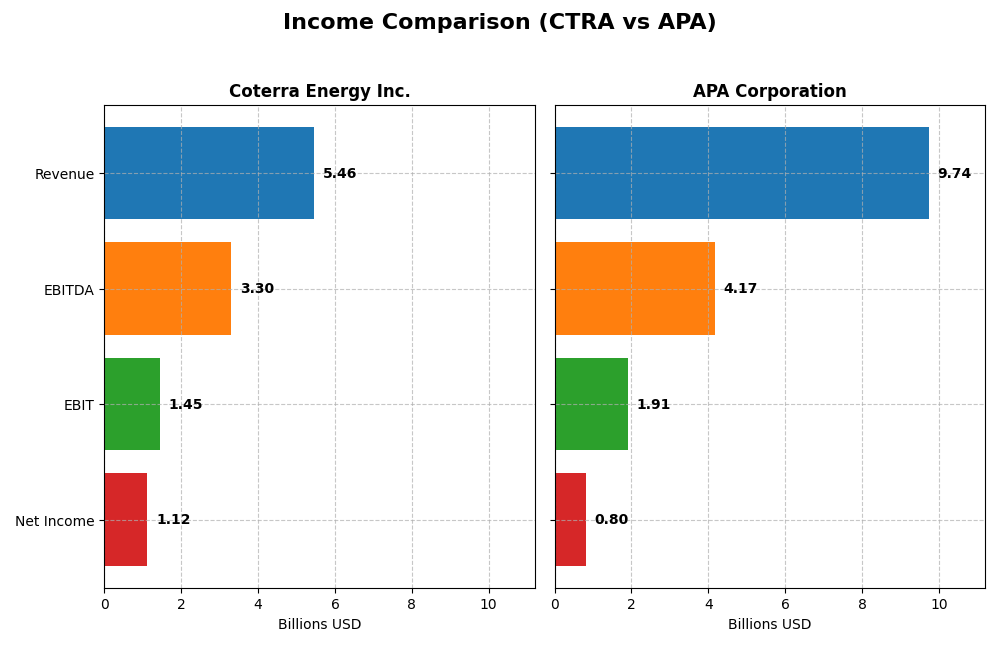
The table below presents a side-by-side comparison of key income statement metrics for Coterra Energy Inc. and APA Corporation based on their most recent fiscal year data.
| Metric | Coterra Energy Inc. (CTRA) | APA Corporation (APA) |
|---|---|---|
| Market Cap | 18.9B | 8.9B |
| Revenue | 5.46B | 9.74B |
| EBITDA | 3.30B | 4.17B |
| EBIT | 1.45B | 1.91B |
| Net Income | 1.12B | 804M |
| EPS | 1.51 | 2.28 |
| Fiscal Year | 2024 | 2024 |
Income Statement Interpretations
Coterra Energy Inc.
Coterra Energy showed strong revenue growth of 289% from 2020 to 2024, with net income increasing 459% over the same period. Margins remained favorable, with a 30.97% gross margin and a 20.53% net margin in 2024. However, recent year performance indicates a 3.92% revenue decline and a 28.2% drop in net margin, reflecting some pressure on profitability.
APA Corporation
APA’s revenue grew 120% between 2020 and 2024, with net income rising 117%. Its 2024 gross margin of 44.18% and net margin of 8.26% are favorable, though EBIT margins are lower than Coterra’s. Despite a 17.6% revenue increase last year, net income and margins fell sharply, with net margin down 76.1%, signaling recent profitability challenges.
Which one has the stronger fundamentals?
Both companies have favorable long-term income statement trends, but Coterra maintains more robust margins and a higher net margin growth overall. APA shows stronger recent revenue growth but faces greater margin compression. Coterra’s more balanced margins and consistent profitability support a stronger fundamental profile amid recent revenue softness.
Financial Ratios Comparison
The table below compares key financial ratios for Coterra Energy Inc. (CTRA) and APA Corporation (APA) based on their latest available fiscal year data for 2024.
| Ratios | Coterra Energy Inc. (CTRA) | APA Corporation (APA) |
|---|---|---|
| ROE | 8.5% | 15.2% |
| ROIC | 5.6% | 14.0% |
| P/E | 16.9 | 10.1 |
| P/B | 1.44 | 1.54 |
| Current Ratio | 2.92 | 1.15 |
| Quick Ratio | 2.88 | 1.01 |
| D/E (Debt to Equity) | 0.29 | 1.17 |
| Debt-to-Assets | 17.6% | 31.8% |
| Interest Coverage | 13.1 | 8.44 |
| Asset Turnover | 0.25 | 0.50 |
| Fixed Asset Turnover | 0.30 | 0.77 |
| Payout ratio | 56% | 44% |
| Dividend yield | 3.3% | 4.3% |
Interpretation of the Ratios
Coterra Energy Inc.
Coterra Energy exhibits mostly favorable ratios, including a strong net margin of 20.53% and a solid current ratio of 2.92, indicating good liquidity. However, return on equity (8.54%) and asset turnover ratios are weak, which could concern efficiency. The company pays dividends with a 3.3% yield, supported by manageable payout levels and free cash flow coverage, suggesting sustainable shareholder returns.
APA Corporation
APA Corporation shows a more mixed picture with favorable return on equity at 15.23% and return on invested capital at 14.03%, but a neutral net margin of 8.26%. The debt-to-equity ratio is unfavorable at 1.17, signaling higher leverage risk. APA offers a higher dividend yield of 4.33%, backed by decent interest coverage and free cash flow, indicating moderately favorable returns to shareholders.
Which one has the best ratios?
Coterra Energy’s ratios are globally more favorable, with 64.29% of ratios positive versus APA’s 50%. While APA has strengths in return metrics and dividend yield, its higher leverage and mixed liquidity metrics weigh against it. Coterra’s strong liquidity, lower leverage, and balanced profitability offer a more consistent financial profile overall.
Strategic Positioning
This section compares the strategic positioning of Coterra Energy Inc. and APA Corporation, focusing on market position, key segments, and exposure to technological disruption:
Coterra Energy Inc.
- Larger market cap at $18.9B, lower beta indicating less volatility, faces typical oil & gas competition.
- Focused on U.S. shale plays including Marcellus, Permian, Anadarko, with revenue mainly from oil, condensate, and natural gas liquids.
- Limited information on technological disruption exposure; operates traditional exploration and production with natural gas gathering systems.
APA Corporation
- Smaller market cap at $8.9B, higher beta with more market volatility, competes globally in oil & gas.
- Diversified geographically with U.S., Egypt, UK, Suriname operations; revenue from oil and gas production and purchased volumes.
- No explicit mention of technological disruption; operates pipelines and processing assets, suggesting integration along the value chain.
Coterra Energy Inc. vs APA Corporation Positioning
Coterra emphasizes concentrated U.S. shale production with a focus on natural gas liquids and oil. APA pursues a more diversified geographic footprint and integrates pipeline operations, offering broader operational scope but potentially higher operational complexity.
Which has the best competitive advantage?
APA demonstrates a very favorable economic moat with strong value creation and growing ROIC, indicating durable competitive advantage. Coterra shows a slightly favorable moat with increasing profitability but currently sheds value relative to cost of capital.
Stock Comparison
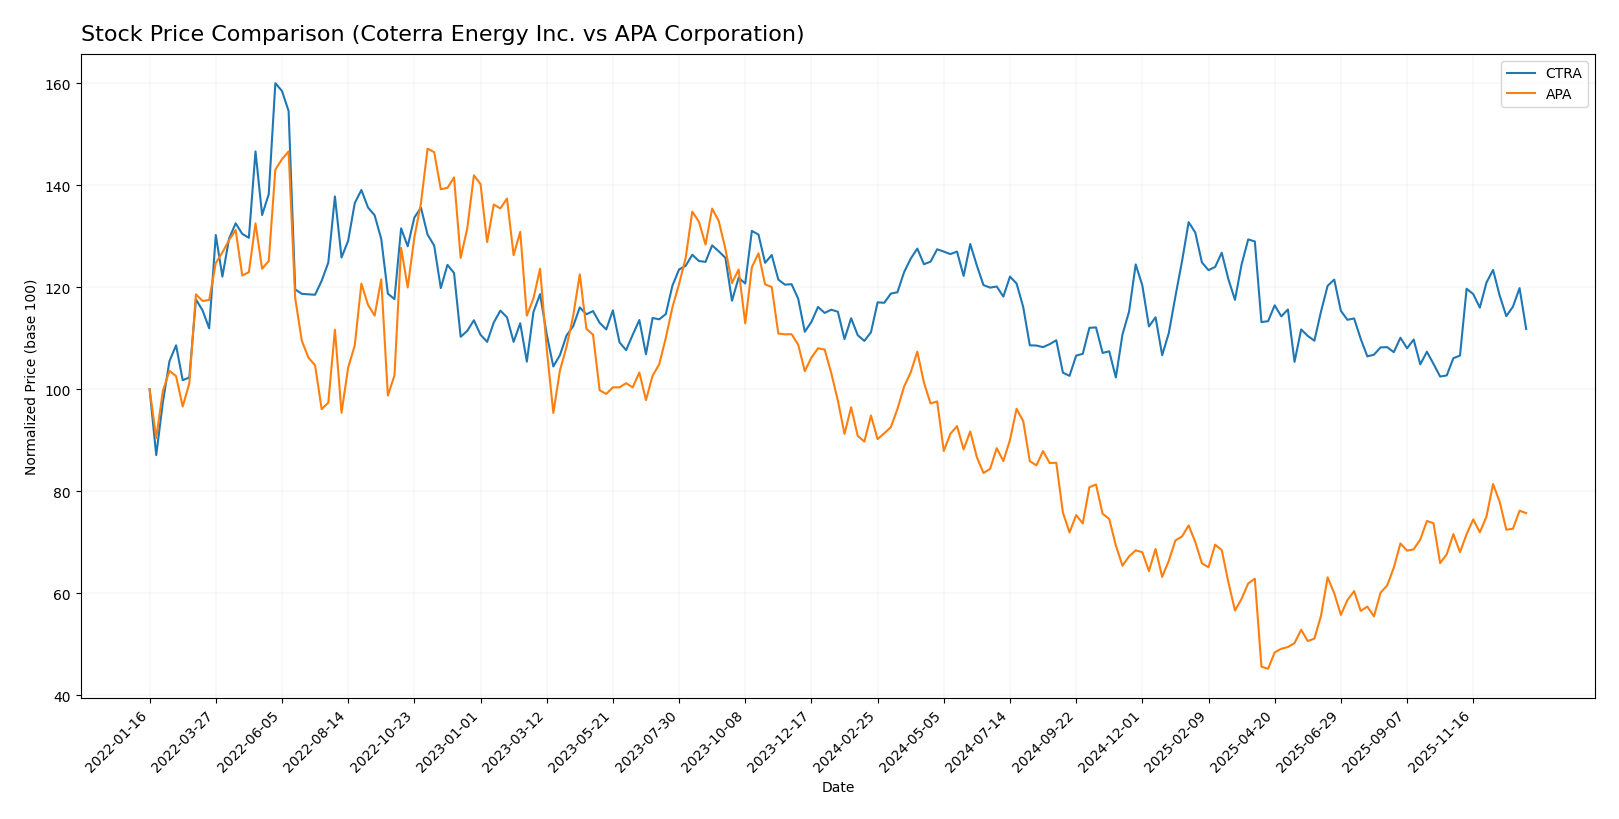
The stock prices of Coterra Energy Inc. and APA Corporation have shown distinct movements over the past 12 months, with Coterra displaying mild gains and APA experiencing a notable decline before a recent uptick in both stocks’ trading dynamics.
Trend Analysis
Coterra Energy Inc. (CTRA) exhibited a modest 0.57% price increase over the past year, indicating a neutral to mildly bullish trend with acceleration and a price range between 22.71 and 29.47. Recent months show a stronger 5.39% rise, confirming accelerating momentum.
APA Corporation (APA) faced a significant 20.18% price decline over the same period, marking a bearish trend with acceleration and greater volatility, fluctuating from 15.04 to 35.74. However, its recent 5.75% gain suggests some recovery momentum.
Comparing both, Coterra’s stock managed slight overall growth, while APA experienced a steep fall despite recent gains, making Coterra the better-performing stock over the last year.
Target Prices
The current analyst consensus provides clear target price ranges for both Coterra Energy Inc. and APA Corporation.
| Company | Target High | Target Low | Consensus |
|---|---|---|---|
| Coterra Energy Inc. | 38 | 27 | 32.5 |
| APA Corporation | 40 | 21 | 26.75 |
Analysts expect Coterra Energy’s stock to appreciate significantly from its current price of $24.82, while APA Corporation’s consensus target slightly exceeds its current price of $25.20, suggesting moderate upside potential.
Analyst Opinions Comparison
This section compares analysts’ ratings and financial scores for Coterra Energy Inc. (CTRA) and APA Corporation (APA):
Rating Comparison
CTRA Rating
- Rating: A-, considered very favorable overall.
- Discounted Cash Flow Score: 5, very favorable, indicating strong valuation.
- ROE Score: 4, favorable efficiency in generating profit from equity.
- ROA Score: 5, very favorable use of assets to generate earnings.
- Debt To Equity Score: 2, moderate financial risk with some leverage.
- Overall Score: 4, favorable overall financial standing.
APA Rating
- Rating: A-, also considered very favorable overall.
- Discounted Cash Flow Score: 3, moderate, suggesting average valuation.
- ROE Score: 5, very favorable, showing excellent profit generation efficiency.
- ROA Score: 5, very favorable, effectively utilizing assets to earn profits.
- Debt To Equity Score: 1, very unfavorable, indicating higher financial risk.
- Overall Score: 4, favorable overall financial standing.
Which one is the best rated?
Both CTRA and APA share the same overall rating of A- and an overall score of 4, indicating favorable financial health. CTRA leads in discounted cash flow and has a lower financial risk score, while APA excels in return on equity but has higher financial leverage risk.
Scores Comparison
The scores comparison between Coterra Energy Inc. and APA Corporation is as follows:
CTRA Scores
- Altman Z-Score: 2.30, placing it in the grey zone of risk.
- Piotroski Score: 6, reflecting average financial strength.
APA Scores
- Altman Z-Score: 1.48, indicating distress zone risk.
- Piotroski Score: 6, reflecting average financial strength.
Which company has the best scores?
CTRA has a higher Altman Z-Score in the grey zone, indicating better financial stability than APA, which is in distress. Both have the same average Piotroski Score of 6.
Grades Comparison
The following is a detailed comparison of the most recent grades assigned to Coterra Energy Inc. and APA Corporation:
Coterra Energy Inc. Grades
This table summarizes the latest grades from recognized financial institutions for Coterra Energy Inc.:
| Grading Company | Action | New Grade | Date |
|---|---|---|---|
| UBS | Maintain | Buy | 2025-12-12 |
| Piper Sandler | Maintain | Overweight | 2025-11-18 |
| Piper Sandler | Maintain | Overweight | 2025-10-21 |
| Susquehanna | Maintain | Positive | 2025-10-20 |
| UBS | Maintain | Buy | 2025-10-14 |
| Morgan Stanley | Maintain | Equal Weight | 2025-10-14 |
| Scotiabank | Maintain | Sector Outperform | 2025-10-09 |
| Mizuho | Maintain | Outperform | 2025-09-15 |
| Raymond James | Maintain | Outperform | 2025-09-11 |
| Piper Sandler | Maintain | Overweight | 2025-08-14 |
The overall trend for Coterra Energy Inc. shows consistent positive ratings, predominantly classified as “Buy,” “Overweight,” or “Outperform,” indicating generally favorable analyst sentiment.
APA Corporation Grades
This table presents recent grades from credible grading companies for APA Corporation:
| Grading Company | Action | New Grade | Date |
|---|---|---|---|
| Bernstein | Maintain | Market Perform | 2026-01-05 |
| UBS | Maintain | Neutral | 2025-12-12 |
| Mizuho | Maintain | Underperform | 2025-12-12 |
| Johnson Rice | Upgrade | Accumulate | 2025-12-05 |
| Citigroup | Maintain | Neutral | 2025-11-26 |
| Goldman Sachs | Maintain | Sell | 2025-11-21 |
| Piper Sandler | Maintain | Neutral | 2025-11-18 |
| RBC Capital | Maintain | Sector Perform | 2025-11-17 |
| Susquehanna | Maintain | Positive | 2025-11-12 |
| UBS | Maintain | Neutral | 2025-11-10 |
APA Corporation’s ratings are more mixed, ranging from “Accumulate” and “Positive” to “Underperform” and “Sell,” indicating a more cautious or divided analyst outlook.
Which company has the best grades?
Coterra Energy Inc. has received notably stronger and more consistent grades compared to APA Corporation, which shows mixed ratings including some negative outlooks. This difference may influence investor confidence and portfolio allocation decisions by reflecting clearer positive momentum for Coterra.
Strengths and Weaknesses
Below is a comparison table outlining key strengths and weaknesses of Coterra Energy Inc. (CTRA) and APA Corporation (APA) based on the most recent financial and operational data.
| Criterion | Coterra Energy Inc. (CTRA) | APA Corporation (APA) |
|---|---|---|
| Diversification | Moderate: Focused primarily on Oil & Condensate with some Natural Gas Liquids exposure | Strong: Broad oil and gas production including purchased gas, providing revenue stability |
| Profitability | Moderate net margin (20.53%), but ROE is low (8.54%), indicating some profitability challenges | Lower net margin (8.26%) but higher ROE (15.23%) and strong ROIC (14.03%) signify efficient capital use |
| Innovation | Neutral: Limited data on R&D or technological advances; asset turnover is low (0.25) | Slightly favorable: Better asset turnover (0.5) but fixed asset turnover is weak (0.77), indicating room for operational improvements |
| Global presence | Moderate: Primarily focused on U.S. assets, less diversified geographically | Moderate: Also U.S.-centric but larger scale in oil and gas production volumes |
| Market Share | Smaller scale with FY 2024 revenues approx. 3B USD in Oil and Condensate | Larger market presence with over 9B USD in oil and gas production revenue in 2024 |
Key takeaways: APA Corporation demonstrates a durable competitive advantage with high return on invested capital and a broad revenue base, making it a potentially stronger long-term investment. Coterra Energy shows improving profitability trends but faces challenges in capital efficiency and diversification. Investors should weigh APA’s scale and capital efficiency against Coterra’s growth potential and financial stability.
Risk Analysis
Below is a comparison of key risks for Coterra Energy Inc. (CTRA) and APA Corporation (APA) based on the most recent data from 2024-2026.
| Metric | Coterra Energy Inc. (CTRA) | APA Corporation (APA) |
|---|---|---|
| Market Risk | Low beta (0.33) suggests lower volatility; moderate exposure to oil & gas price fluctuations | Higher beta (0.74) indicates more sensitivity to market swings; diversified geographic exposure |
| Debt level | Low debt-to-equity (0.29), favorable interest coverage (13.7), low financial risk | High debt-to-equity (1.17), moderate interest coverage (5.0), elevated financial risk |
| Regulatory Risk | US-focused operations; stable regulatory environment but potential for stricter environmental policies | Operations in US, Egypt, UK, Suriname; exposure to varied regulatory frameworks and geopolitical zones |
| Operational Risk | Moderate asset turnover; focus on Marcellus and Permian basins with established infrastructure | More diversified assets and pipelines, but higher operational complexity and fixed asset turnover challenges |
| Environmental Risk | Active in natural gas and oil production with related emissions and disposal concerns | Similar environmental footprint; additional risks from international operations and offshore exploration |
| Geopolitical Risk | Primarily US operations reduce geopolitical exposure | Exposure to Egypt, UK, and Suriname elevates geopolitical risk, including political instability and resource nationalism |
In summary, APA faces higher financial and geopolitical risks due to elevated debt and international operations, while Coterra benefits from a stronger balance sheet and lower market volatility. The most impactful risk is APA’s debt burden combined with geopolitical exposure, which could affect its stability amid market or regulatory shifts. Investors should weigh these factors carefully, balancing risk tolerance with growth potential.
Which Stock to Choose?
Coterra Energy Inc. (CTRA) shows a favorable income statement with strong gross and EBIT margins, though recent yearly revenue and net income growth have declined. Its financial ratios are largely positive, including a solid current ratio and low debt levels, supported by a very favorable rating of A- and a slightly favorable moat indicating growing profitability despite value shedding.
APA Corporation (APA) presents a favorable income profile with robust gross margin and EBIT margin alongside positive long-term growth, despite recent declines in net margin and EPS. Financial ratios are slightly favorable with strengths in ROE and ROIC but hampered by higher debt levels and a distress zone Altman Z-Score; it holds an A- rating and a very favorable moat reflecting durable competitive advantage.
Investors prioritizing stability and improving profitability might find CTRA appealing due to its favorable ratios and rating, while those focusing on competitive advantage and growth potential might interpret APA’s very favorable moat and strong returns as attractive; risk tolerance and investment strategy will influence the preference between these profiles.
Disclaimer: Investment carries a risk of loss of initial capital. The past performance is not a reliable indicator of future results. Be sure to understand risks before making an investment decision.
Go Further
I encourage you to read the complete analyses of Coterra Energy Inc. and APA Corporation to enhance your investment decisions: