Home > Comparison > Energy > COP vs APA
The strategic rivalry between ConocoPhillips and APA Corporation shapes the Energy sector’s competitive landscape. ConocoPhillips operates as a diversified oil and gas explorer with a global footprint, while APA Corporation focuses on selective upstream development and midstream assets. This analysis pits ConocoPhillips’ scale and diversification against APA’s focused growth strategy. I aim to determine which company offers a superior risk-adjusted return for diversified portfolios navigating volatile commodity cycles.
Table of contents
Companies Overview
ConocoPhillips and APA Corporation anchor the competitive landscape in oil and gas exploration.
ConocoPhillips: Global Energy Giant
ConocoPhillips leads as a diversified oil and gas explorer. It generates revenue by producing and marketing crude oil, LNG, and natural gas worldwide. In 2026, its strategy centers on balancing unconventional North American plays and conventional assets across multiple continents, emphasizing LNG development and portfolio diversification.
APA Corporation: Focused Exploration and Infrastructure
APA Corporation operates as a specialized oil and gas producer with a footprint in the US, Egypt, and the UK. Its core revenue stems from exploration and production, alongside gathering, processing, and pipeline assets in West Texas. APA’s strategic focus in 2026 targets expanding its Permian-to-Gulf Coast infrastructure and offshore exploration ventures.
Strategic Collision: Similarities & Divergences
Both firms share a focus on upstream production, but ConocoPhillips pursues a broad international portfolio, while APA concentrates on regional infrastructure and selective offshore exploration. Their primary battleground is the North American unconventional oil and gas market. Investors face divergent profiles: ConocoPhillips offers scale and diversification; APA delivers niche operational leverage.
Income Statement Comparison
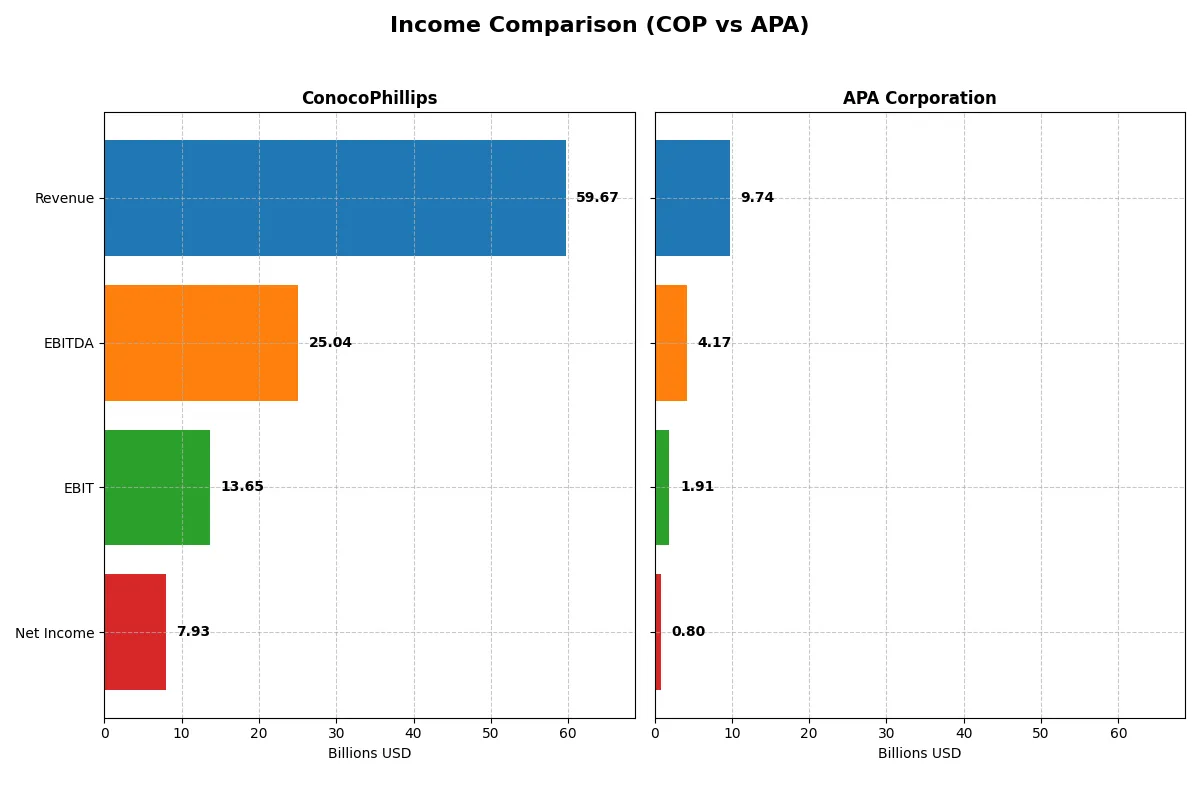
The following data dissects the core profitability and scalability of both corporate engines to reveal who dominates the bottom line:
| Metric | ConocoPhillips (COP) | APA Corporation (APA) |
|---|---|---|
| Revenue | 59.7B | 9.7B |
| Cost of Revenue | 38.7B | 5.4B |
| Operating Expenses | 9.1B | 1.1B |
| Gross Profit | 21.0B | 4.3B |
| EBITDA | 25.0B | 4.2B |
| EBIT | 13.7B | 1.9B |
| Interest Expense | 1.1B | 0.4B |
| Net Income | 7.9B | 0.8B |
| EPS | 6.34 | 2.28 |
| Fiscal Year | 2025 | 2024 |
Income Statement Analysis: The Bottom-Line Duel
This income statement comparison reveals which company operates with more efficiency and profitability amid shifting market conditions.
ConocoPhillips Analysis
ConocoPhillips shows a revenue increase to $59.7B in 2025, up 9.3% from 2024, but net income declined by 14% to $7.9B. Its gross margin of 35.2% and net margin of 13.3% remain favorable, reflecting solid cost control despite a 7.6% EBIT drop. The firm maintains strong profitability but faces pressure on bottom-line momentum.
APA Corporation Analysis
APA Corporation’s revenue surged 17.6% to $9.7B in 2024, yet net income plunged 72% to $804M, pressured by a sharp 40.6% EBIT decline. APA’s gross margin holds at a robust 44.2%, but net margin contracted to 8.3%. Despite impressive top-line growth over five years, recent profitability erosion signals operational challenges.
Margin Strength vs. Growth Volatility
ConocoPhillips delivers stronger absolute profits and steadier margins, though recent earnings momentum slowed. APA boasts faster revenue and net income growth over the long term but suffers from volatile earnings and margin compression. For investors valuing reliable profitability, ConocoPhillips offers a more stable profile amid sector cyclicality.
Financial Ratios Comparison
These vital ratios act as a diagnostic tool to expose the underlying fiscal health, valuation premiums, and capital efficiency of the companies compared below:
| Ratios | ConocoPhillips (COP) | APA Corporation (APA) |
|---|---|---|
| ROE | 12.3% | 15.2% |
| ROIC | 6.9% | 14.0% |
| P/E | 14.1 | 10.1 |
| P/B | 1.74 | 1.54 |
| Current Ratio | 1.30 | 1.15 |
| Quick Ratio | 1.14 | 1.01 |
| D/E | 0.36 | 1.17 |
| Debt-to-Assets | 19.2% | 31.8% |
| Interest Coverage | 10.4 | 8.44 |
| Asset Turnover | 0.49 | 0.50 |
| Fixed Asset Turnover | 0.64 | 0.77 |
| Payout ratio | 50.4% | 43.9% |
| Dividend yield | 3.57% | 4.33% |
| Fiscal Year | 2025 | 2024 |
Efficiency & Valuation Duel: The Vital Signs
Financial ratios serve as a company’s DNA, revealing operational strengths and hidden risks that shape investment outcomes.
ConocoPhillips
ConocoPhillips shows solid profitability with a 12.3% ROE and a favorable 13.3% net margin. Its valuation appears reasonable, with a P/E of 14.1 and a P/B of 1.74, neither stretched nor cheap. The company rewards shareholders with a 3.6% dividend yield, reflecting steady cash returns amid disciplined capital allocation.
APA Corporation
APA offers a higher ROE of 15.2% and a strong 14.0% ROIC, signaling efficient capital use. Its valuation remains attractive, trading at a P/E of 10.1 and a P/B of 1.54, suggesting undervaluation. A 4.3% dividend yield complements growth efforts, while debt levels remain elevated, warranting caution on leverage risks.
Valuation Discipline vs. Capital Efficiency
ConocoPhillips balances profitability and shareholder yield with moderate valuation and lower leverage, offering stable risk exposure. APA delivers superior returns on equity and invested capital but carries higher debt, increasing financial risk. Investors prioritizing capital efficiency and yield may lean toward APA, while those seeking valuation safety might prefer ConocoPhillips.
Which one offers the Superior Shareholder Reward?
I compare ConocoPhillips (COP) and APA Corporation (APA) by analyzing their dividend yields, payout ratios, and buyback intensity. COP delivers a 3.57% dividend yield with a payout ratio near 50%, supported by robust free cash flow coverage (~85%). COP’s buyback activity complements dividends, fueling shareholder returns sustainably. APA’s yield stands slightly higher at 4.33%, but with a lower payout ratio (~44%) and weaker free cash flow coverage (~21%), signaling less distribution sustainability. APA’s smaller buyback scale limits total return impact. In my view, COP’s balanced dividend and buyback strategy offers more reliable, superior shareholder reward in 2026.
Comparative Score Analysis: The Strategic Profile
The radar chart reveals the fundamental DNA and trade-offs of ConocoPhillips and APA Corporation, highlighting their distinct financial strengths and vulnerabilities:
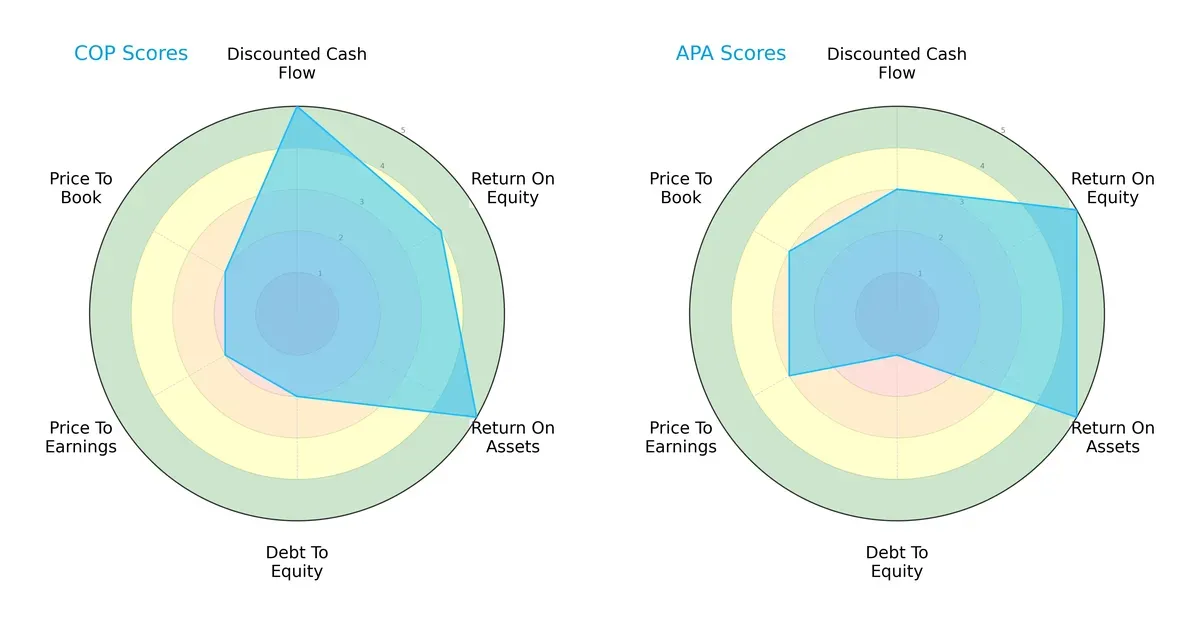
ConocoPhillips excels in discounted cash flow and asset utilization with top scores of 5 but carries higher financial risk with a debt-to-equity score of 2. APA leads in return on equity and valuation metrics, showing a more balanced but moderate cash flow profile. COP leans on operational efficiency; APA offers a steadier valuation and equity return.
Bankruptcy Risk: Solvency Showdown
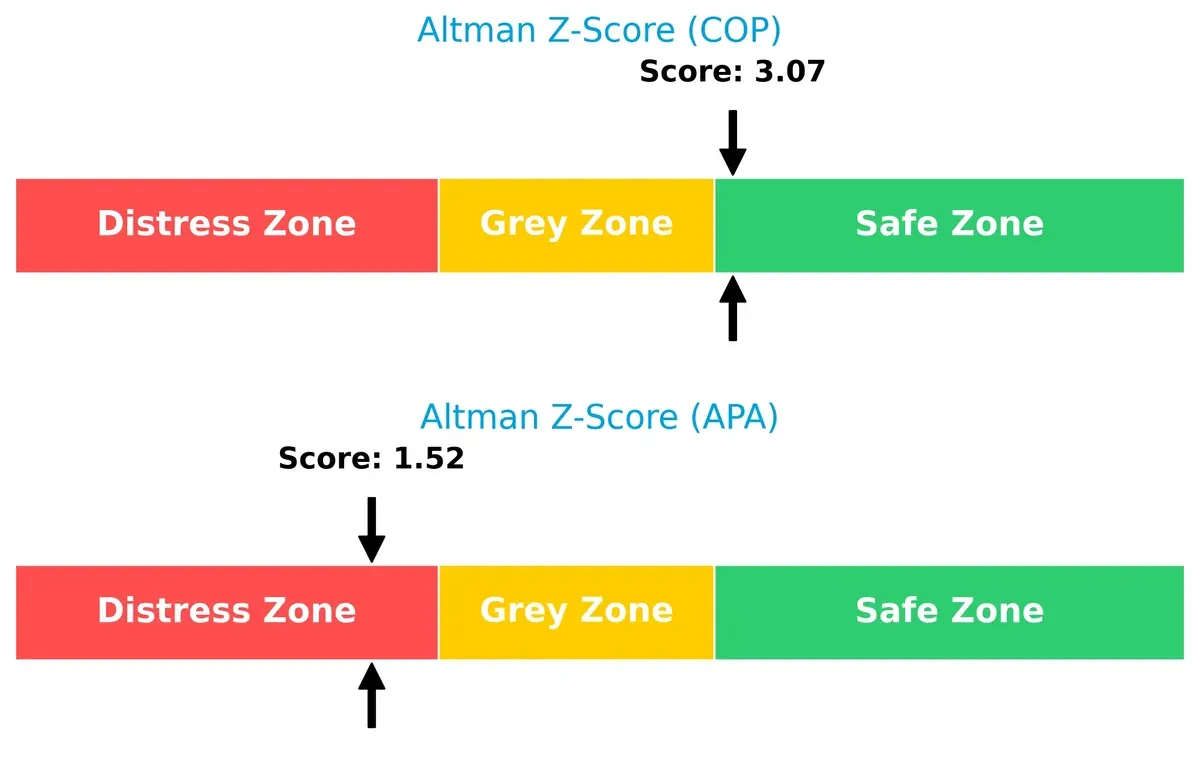
ConocoPhillips’ Altman Z-Score of 3.07 places it securely in the safe zone, while APA’s 1.52 signals distress risk, implying COP’s superior long-term survival prospects in this cycle:
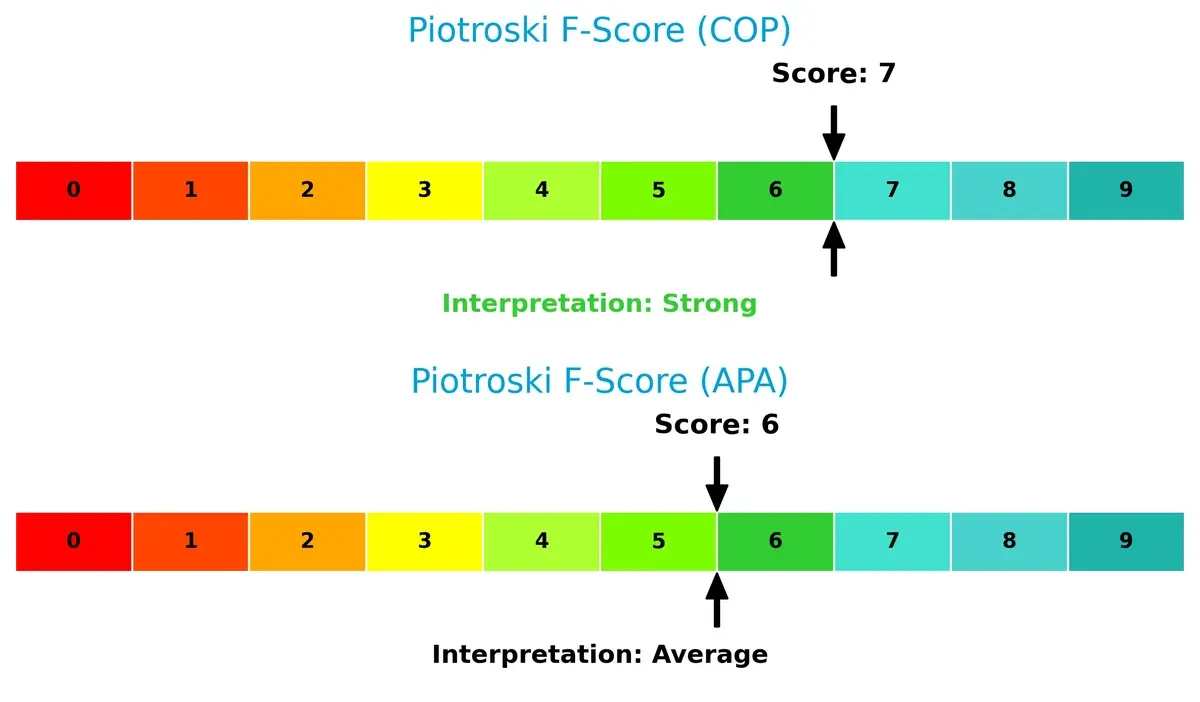
Financial Health: Quality of Operations
ConocoPhillips scores a strong 7 on the Piotroski scale versus APA’s average 6, indicating COP’s healthier internal financial metrics and fewer red flags:
How are the two companies positioned?
This section dissects COP and APA’s operational DNA by comparing their revenue distribution and internal dynamics. The goal is to confront their economic moats to identify which model offers the most resilient competitive advantage today.
Revenue Segmentation: The Strategic Mix
This visual comparison dissects how ConocoPhillips and APA Corporation diversify their income streams and where their primary sector bets lie:
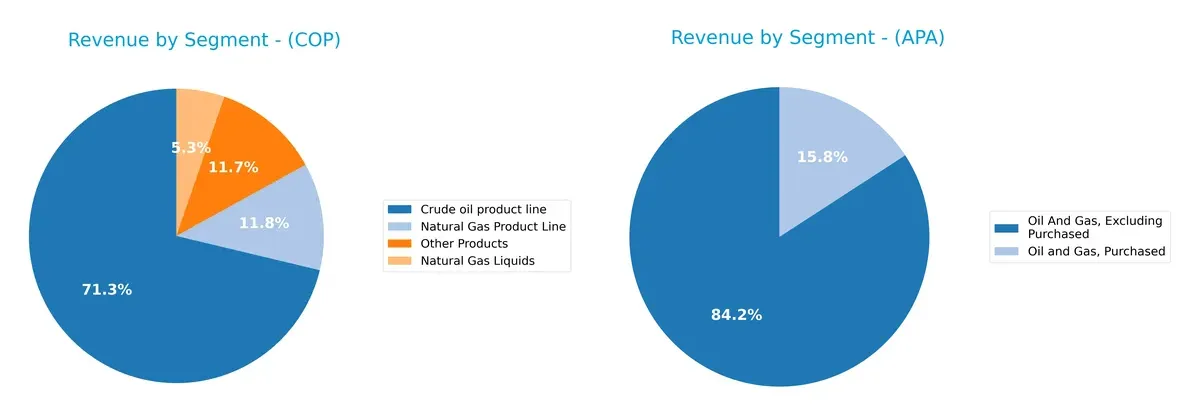
ConocoPhillips anchors its revenue heavily on the Crude Oil product line at $39B in 2024, complemented by natural gas and liquids segments totaling over $9B. APA Corporation shows a simpler split, with $8.2B from Oil And Gas excluding purchased and $1.5B from purchased volumes. COP’s broader mix suggests strategic ecosystem lock-in, while APA’s focus signals higher concentration risk but operational clarity.
Strengths and Weaknesses Comparison
This table compares the strengths and weaknesses of ConocoPhillips and APA Corporation:
ConocoPhillips Strengths
- Diverse product lines including crude oil, natural gas liquids, and natural gas
- Strong global presence across multiple regions including Canada, Norway, and the UK
- Favorable net margin at 13.29% and solid interest coverage of 11.99
- Low debt-to-equity ratio at 0.36 and favorable WACC of 4.83%
- Dividend yield of 3.57% supports shareholder returns
APA Corporation Strengths
- High ROE of 15.23% and ROIC of 14.03%, both favorable
- Favorable WACC of 6.1% and PE ratio of 10.14 indicating valuation appeal
- Favorable interest coverage at 5.03 and dividend yield of 4.33%
- Geographic concentration in the North Sea and US segments provides focused market presence
- Product mix centered on oil and gas, excluding purchased volumes
ConocoPhillips Weaknesses
- Asset turnover ratios unfavorable at 0.49 and fixed asset turnover at 0.64, indicating less efficient asset use
- Neutral ROE and ROIC suggest room for profitability improvement
- Moderate current ratio at 1.3 signals average liquidity management
- Market share heavily weighted in US Lower 48 region, limiting diversification
APA Corporation Weaknesses
- High debt-to-equity ratio at 1.17 poses financial risk
- Fixed asset turnover unfavorable at 0.77, showing less efficient asset utilization
- Neutral net margin at 8.26% below ConocoPhillips
- Geographic reach less diversified, mainly focused on North Sea and US
ConocoPhillips shows greater product and geographic diversity with solid financial stability. APA Corporation excels in profitability metrics but carries higher leverage and less diversification. These attributes suggest differing strategic priorities in efficiency and risk management.
The Moat Duel: Analyzing Competitive Defensibility
A structural moat shields long-term profits from relentless competition erosion. I examine ConocoPhillips and APA Corporation’s moats through this critical lens:
ConocoPhillips: Diversified Asset Base with Moderate ROIC Moat
ConocoPhillips leverages a diversified global portfolio as its moat, reflected in steady 13% net margins and 2% ROIC premium over WACC. However, declining ROIC signals margin pressure. Expansion in unconventional plays could either deepen or erode its competitive edge in 2026.
APA Corporation: Strong Operational Efficiency and ROIC Momentum
APA’s moat hinges on operational efficiency and a sharp ROIC surge, now nearly 8% above WACC with an accelerating trend. Unlike ConocoPhillips, APA’s leaner asset base and focused North Sea and U.S. operations fuel this expanding advantage. Its growth trajectory suggests enhanced market disruption potential.
Asset Diversification vs. ROIC Momentum: The Moat Showdown
APA wields a deeper, more sustainable moat, driven by rising ROIC and efficient capital use. ConocoPhillips’ broader asset spread offers resilience but faces margin headwinds. APA is better positioned to defend and grow its market share amid evolving industry dynamics.
Which stock offers better returns?
Over the past year, both ConocoPhillips and APA Corporation experienced notable price declines followed by recent rebounds, with ConocoPhillips showing a stronger recovery and more pronounced trading dynamics.
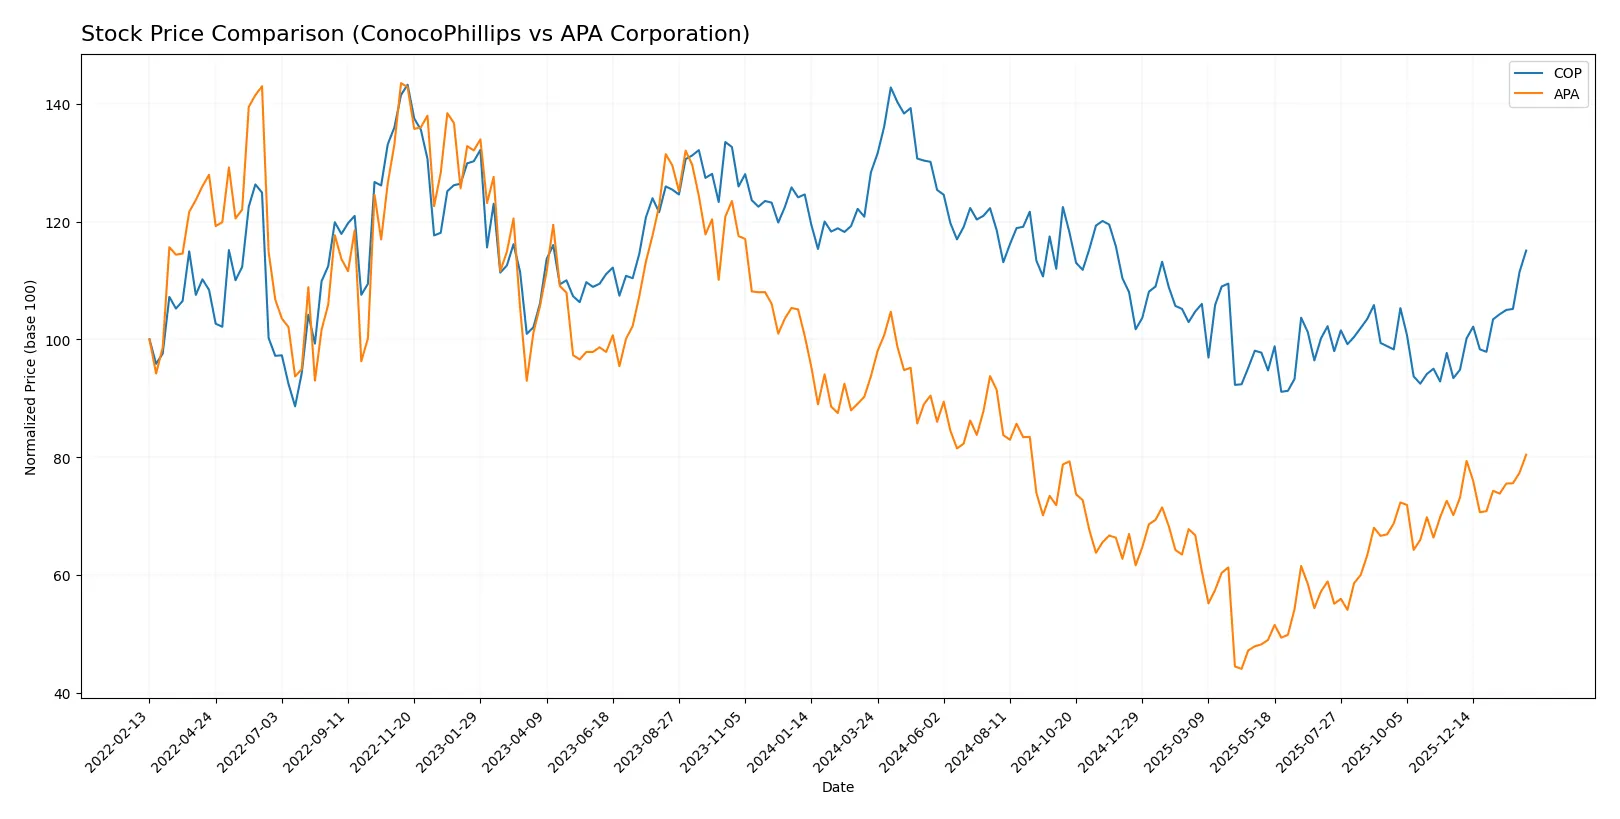
Trend Comparison
ConocoPhillips’ stock shows a bearish trend with a -10.35% decline over 12 months, despite accelerating downward momentum and a recent 23.18% rebound from late 2025 to early 2026.
APA Corporation’s stock also follows a bearish trend, falling -14.19% over the past year with accelerating losses; however, it posted a smaller recent rebound of 14.66% in the same period.
Comparing both, ConocoPhillips delivered the highest market performance recently, with a stronger price recovery and higher buyer dominance than APA Corporation.
Target Prices
Analysts present a clear consensus on target prices for ConocoPhillips and APA Corporation.
| Company | Target Low | Target High | Consensus |
|---|---|---|---|
| ConocoPhillips | 98 | 133 | 116.07 |
| APA Corporation | 21 | 40 | 27.31 |
The target consensus for ConocoPhillips suggests a 7.8% upside from the current price of 107.62 USD. APA Corporation’s consensus aligns closely with its current price of 27.46 USD, indicating limited near-term upside.

Don’t Let Luck Decide Your Entry Point
Optimize your entry points with our advanced ProRealTime indicators. You’ll get efficient buy signals with precise price targets for maximum performance. Start outperforming now!
How do institutions grade them?
ConocoPhillips Grades
The table below summarizes recent grades from major financial institutions for ConocoPhillips:
| Grading Company | Action | New Grade | Date |
|---|---|---|---|
| Wells Fargo | Maintain | Overweight | 2026-02-06 |
| Piper Sandler | Maintain | Overweight | 2026-02-06 |
| BMO Capital | Maintain | Outperform | 2026-02-06 |
| Susquehanna | Maintain | Positive | 2026-01-26 |
| Morgan Stanley | Maintain | Overweight | 2026-01-23 |
| JP Morgan | Downgrade | Neutral | 2026-01-20 |
| B of A Securities | Downgrade | Underperform | 2026-01-16 |
| JP Morgan | Maintain | Overweight | 2026-01-13 |
| Wells Fargo | Upgrade | Overweight | 2026-01-12 |
| Piper Sandler | Maintain | Overweight | 2026-01-08 |
APA Corporation Grades
Recent institutional grades for APA Corporation are listed below:
| Grading Company | Action | New Grade | Date |
|---|---|---|---|
| RBC Capital | Maintain | Sector Perform | 2026-01-26 |
| Morgan Stanley | Maintain | Underweight | 2026-01-23 |
| Barclays | Downgrade | Underweight | 2026-01-21 |
| Bernstein | Maintain | Market Perform | 2026-01-05 |
| Mizuho | Maintain | Underperform | 2025-12-12 |
| UBS | Maintain | Neutral | 2025-12-12 |
| Johnson Rice | Upgrade | Accumulate | 2025-12-05 |
| Citigroup | Maintain | Neutral | 2025-11-26 |
| Goldman Sachs | Maintain | Sell | 2025-11-21 |
| Piper Sandler | Maintain | Neutral | 2025-11-18 |
Which company has the best grades?
ConocoPhillips consistently holds predominantly positive grades, including multiple Overweight and Outperform ratings. APA Corporation features more mixed grades, with several Underweight and Neutral ratings. These disparities influence investor perception of relative strength and risk profiles.
Risks specific to each company
The following categories identify critical pressure points and systemic threats facing ConocoPhillips and APA Corporation in the 2026 market environment:
1. Market & Competition
ConocoPhillips
- Large market cap and diversified portfolio bolster competitive positioning.
APA Corporation
- Smaller market cap and more concentrated operations increase vulnerability to competitive shifts.
2. Capital Structure & Debt
ConocoPhillips
- Low debt-to-equity ratio (0.36) indicates strong balance sheet and financial flexibility.
APA Corporation
- High debt-to-equity ratio (1.17) raises financial risk and potential liquidity pressures.
3. Stock Volatility
ConocoPhillips
- Very low beta (0.29) suggests stable stock less sensitive to market swings.
APA Corporation
- Higher beta (0.70) implies greater stock price volatility and risk.
4. Regulatory & Legal
ConocoPhillips
- Global operations increase exposure to diverse regulatory regimes but with established compliance frameworks.
APA Corporation
- International footprint including Egypt and UK adds complexity and potential compliance costs.
5. Supply Chain & Operations
ConocoPhillips
- Broad asset base and diversified production reduce operational supply chain risks.
APA Corporation
- Concentrated regional operations and pipeline ownership expose APA to localized supply disruptions.
6. ESG & Climate Transition
ConocoPhillips
- Larger scale enables more capital allocation towards ESG initiatives and climate transition.
APA Corporation
- Smaller scale may limit resources for ESG investments, increasing transition risk.
7. Geopolitical Exposure
ConocoPhillips
- Operations across North America, Europe, Asia, and Australia diversify geopolitical risk.
APA Corporation
- Exposure to Egypt and offshore Suriname adds geopolitical uncertainty and potential instability.
Which company shows a better risk-adjusted profile?
ConocoPhillips faces its greatest risk in operational efficiency and asset turnover, which are below industry standards. APA Corporation’s most critical risk lies in its high leverage, indicated by a debt-to-equity ratio over three times that of ConocoPhillips. Despite APA’s higher ROIC, ConocoPhillips offers a superior risk-adjusted profile, supported by a safer Altman Z-Score (3.07 vs. 1.52) and lower stock volatility. This stability is crucial in the volatile oil and gas sector, where capital structure resilience and operational scale define long-term survivability.
Final Verdict: Which stock to choose?
ConocoPhillips boasts a superpower in generating strong free cash flow and maintaining a disciplined balance sheet. Its declining ROIC trend warrants vigilance, signaling potential pressure on future profitability. This stock fits well in an Aggressive Growth portfolio seeking value creation amid cyclical risks.
APA Corporation’s moat lies in its rapidly improving ROIC and expanding profitability, suggesting a growing competitive advantage. It carries higher leverage risks than ConocoPhillips but offers better growth potential and margin expansion. APA suits a GARP portfolio aiming for growth with a reasonable margin of safety.
If you prioritize stable free cash flow and value creation with moderate risk, ConocoPhillips outshines as the compelling choice due to its robust cash conversion and financial stability. However, if you seek accelerating profitability and growth upside, APA offers better potential despite its higher leverage and volatility. Both present distinct analytical scenarios depending on your appetite for growth versus stability.
Disclaimer: Investment carries a risk of loss of initial capital. The past performance is not a reliable indicator of future results. Be sure to understand risks before making an investment decision.
Go Further
I encourage you to read the complete analyses of ConocoPhillips and APA Corporation to enhance your investment decisions: