Home > Comparison > Financial Services > AON vs WTW
The strategic rivalry between Aon plc and Willis Towers Watson defines the current trajectory of the global insurance brokerage sector. Aon operates as a comprehensive risk and health solutions provider, leveraging scale and diverse services. Willis Towers Watson focuses on advisory and broking with strong expertise in health and wealth management. This analysis will identify which company offers superior risk-adjusted returns, crucial for portfolio diversification amid evolving industry dynamics.

Table of contents
Companies Overview
Aon plc and Willis Towers Watson stand as titans in the global insurance brokerage market, shaping risk and benefits solutions worldwide.
Aon plc: Global Risk and Health Solutions Leader
Aon plc dominates as a professional services firm specializing in risk, retirement, and health. Its core revenue stems from commercial risk solutions, including retail brokerage and cyber risk consulting. In 2026, Aon’s strategic focus sharpens on integrated health and wealth advisory services, leveraging data-driven consulting to enhance client resilience across global markets.
Willis Towers Watson: Advisory and Broking Innovator
Willis Towers Watson operates as a leading insurance broker and advisory company with broad exposure to health, wealth, and risk segments. It generates revenue through actuarial services, insurance brokerage, and investment consulting. The 2026 strategy emphasizes technology-enabled benefits administration and predictive modeling to optimize client total rewards and risk management.
Strategic Collision: Similarities & Divergences
Both firms pursue diversified insurance brokerage but diverge in their business philosophies. Aon favors integrated, data-centric health and wealth solutions, while Willis Towers Watson focuses on tech-driven advisory and benefits outsourcing. Their primary battleground is expanding global client bases through innovation. This contrast creates distinct investment profiles—Aon as a comprehensive risk partner, Willis Towers Watson as a technology-forward consultant.
Income Statement Comparison
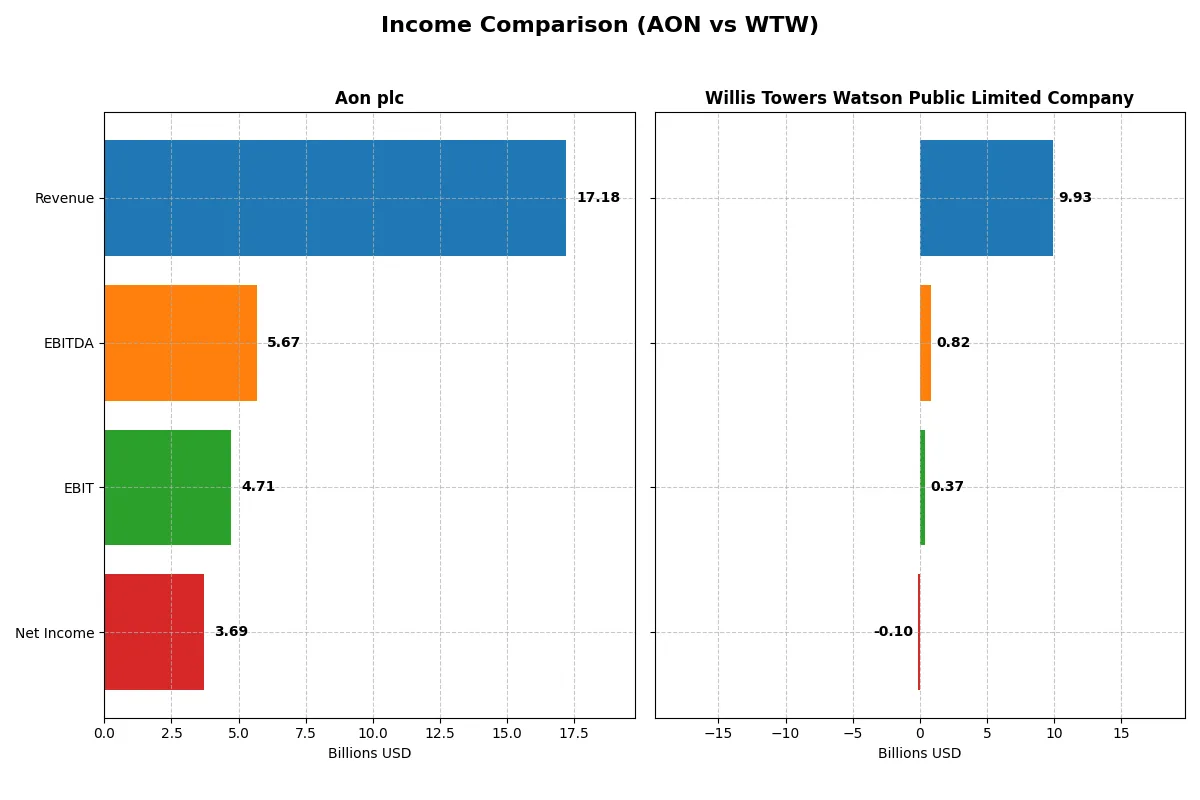
This data dissects the core profitability and scalability of both corporate engines to reveal who dominates the bottom line:
| Metric | Aon plc (AON) | Willis Towers Watson (WTW) |
|---|---|---|
| Revenue | 17.18B | 9.93B |
| Cost of Revenue | 8.99B | 5.50B |
| Operating Expenses | 12.84B | 3.80B |
| Gross Profit | 8.20B | 4.43B |
| EBITDA | 5.68B | 0.82B |
| EBIT | 4.71B | 0.37B |
| Interest Expense | 0.82B | 0.26B |
| Net Income | 3.70B | -0.10B |
| EPS | 17.11 | -0.96 |
| Fiscal Year | 2025 | 2024 |
Income Statement Analysis: The Bottom-Line Duel
This income statement comparison reveals which company runs its business more efficiently and delivers stronger profitability over recent years.
Aon plc Analysis
Aon’s revenue climbed steadily from $12.2B in 2021 to $17.2B in 2025, with net income surging from $1.25B to $3.7B. Gross and net margins remain robust at 47.7% and 21.5%, respectively. In 2025, Aon’s earnings momentum accelerated, supported by a favorable 27.4% EBIT margin and a significant 36% EPS growth, reflecting strong operational leverage.
Willis Towers Watson Public Limited Company Analysis
Willis Towers Watson’s revenue grew modestly from $8.6B in 2020 to $9.93B in 2024. However, net income declined sharply, turning negative at -$98M in 2024 from $1.05B the year before. Despite a stable gross margin near 44.6%, the company’s EBIT margin plunged to 3.7%, signaling deteriorating profitability and operational challenges in the latest year.
Margin Strength vs. Profitability Decline
Aon clearly outperforms Willis Towers Watson on both revenue growth and profitability metrics. Aon’s high and expanding margins underpin its superior bottom-line results. In contrast, Willis Towers Watson faces margin compression and net losses, undermining its earnings quality. For investors, Aon’s profile offers a stronger, more consistent earnings engine compared to Willis Towers Watson’s volatile performance.
Financial Ratios Comparison
These vital ratios act as a diagnostic tool to expose the underlying fiscal health, valuation premiums, and capital efficiency of the companies compared below:
| Ratios | Aon plc (AON) | Willis Towers Watson (WTW) |
|---|---|---|
| ROE | 39.5% | -1.2% |
| ROIC | 13.2% | -3.5% |
| P/E | 20.6 | -326.0 |
| P/B | 8.15 | 4.02 |
| Current Ratio | 1.11 | 1.20 |
| Quick Ratio | 1.11 | 1.20 |
| D/E (Debt-to-Equity) | 1.77 | 0.75 |
| Debt-to-Assets | 32.6% | 21.4% |
| Interest Coverage | -5.78 | 2.38 |
| Asset Turnover | 0.34 | 0.36 |
| Fixed Asset Turnover | 12.5 | 8.66 |
| Payout Ratio | 17.0% | -361.2% |
| Dividend Yield | 0.83% | 1.11% |
| Fiscal Year | 2025 | 2024 |
Efficiency & Valuation Duel: The Vital Signs
Ratios act as a company’s DNA, exposing hidden risks and operational strengths that shape investor confidence and portfolio decisions.
Aon plc
Aon shows strong profitability with a 39.5% ROE and solid 21.5% net margin, indicating efficient capital use. Its P/E of 20.6 suggests a fairly valued stock, though an 8.15 P/B ratio signals some overvaluation. Dividend yield remains low at 0.83%, hinting at reinvestment in growth rather than generous payouts.
Willis Towers Watson Public Limited Company
Willis Towers Watson suffers from negative profitability metrics, including a -1.2% ROE and -1.0% net margin, reflecting operational challenges. Its valuation metrics, such as a negative P/E and a 4.02 P/B, appear stretched amid weak returns. The 1.11% dividend yield offers modest shareholder income despite profitability struggles.
Premium Valuation vs. Operational Safety
Aon delivers superior profitability and operational efficiency with balanced valuation, while Willis Towers Watson faces profitability headwinds and valuation inconsistencies. Investors prioritizing stable returns and capital efficiency may prefer Aon, whereas those seeking turnaround opportunities might consider Willis Towers Watson’s riskier profile.
Which one offers the Superior Shareholder Reward?
I see Aon and Willis Towers Watson (WTW) pursue distinct shareholder reward strategies in 2026. Aon yields a modest 0.83% dividend with a conservative 17% payout, sustaining payouts comfortably with free cash flow coverage near 92%. It complements dividends with measured buybacks, balancing capital return and reinvestment. In contrast, WTW offers a higher 1.11% dividend yield but posts negative net margins in 2024, signaling weak earnings. Its payout ratio is negative due to losses, indicating dividend sustainability risks despite an active buyback program. Historically, Aon’s disciplined dividend and buyback blend aligns better with steady free cash flow and earnings margins, presenting a more reliable total return profile than WTW’s riskier distribution. I conclude Aon offers the superior shareholder reward in 2026, favoring long-term value and capital allocation prudence.
Comparative Score Analysis: The Strategic Profile
The radar chart reveals the fundamental DNA and trade-offs of Aon plc and Willis Towers Watson, highlighting their financial strengths and valuation contrasts:
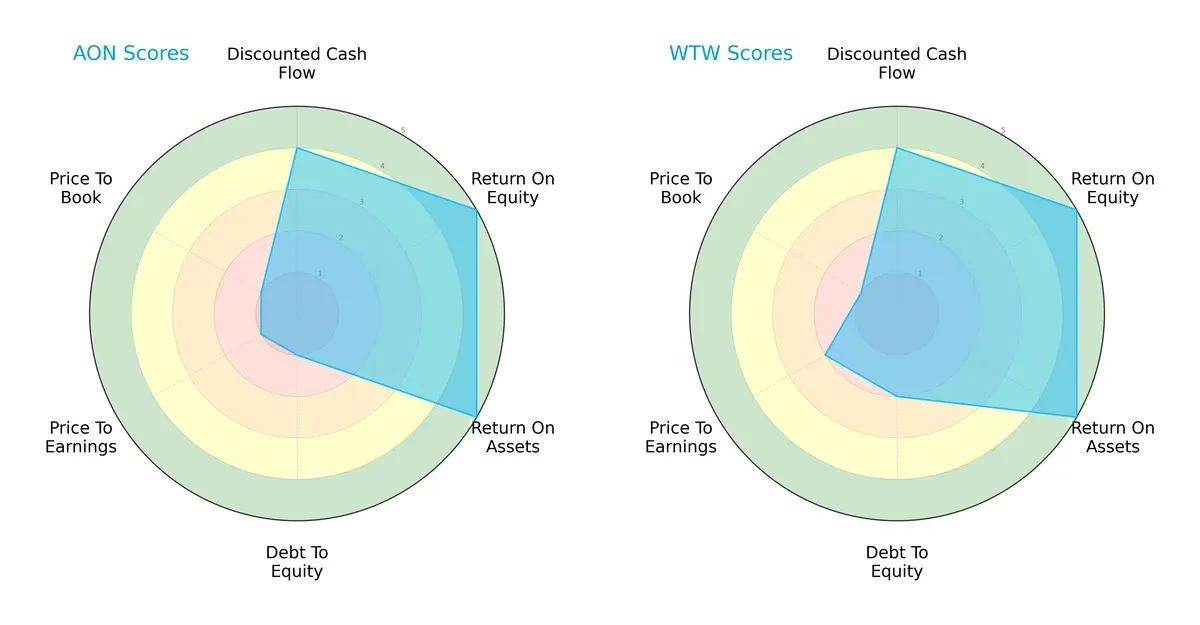
Both firms share strong operational efficiency with top ROE and ROA scores of 5, reflecting superior asset and equity utilization. They tie on DCF at 4, signaling similar cash flow prospects. However, Willis Towers Watson maintains a more conservative balance sheet with a debt-to-equity score of 2 versus Aon’s weak 1. On valuation metrics, both score poorly, but Willis edges Aon slightly on P/E at 2 compared to 1, indicating marginally better relative pricing. Overall, Willis Towers Watson presents a more balanced profile, while Aon relies heavily on operational efficiency but carries higher financial risk and valuation concerns.
Bankruptcy Risk: Solvency Showdown
Aon’s Altman Z-Score of 1.79 narrowly surpasses Willis Towers Watson’s 1.68, placing both in the distress zone:
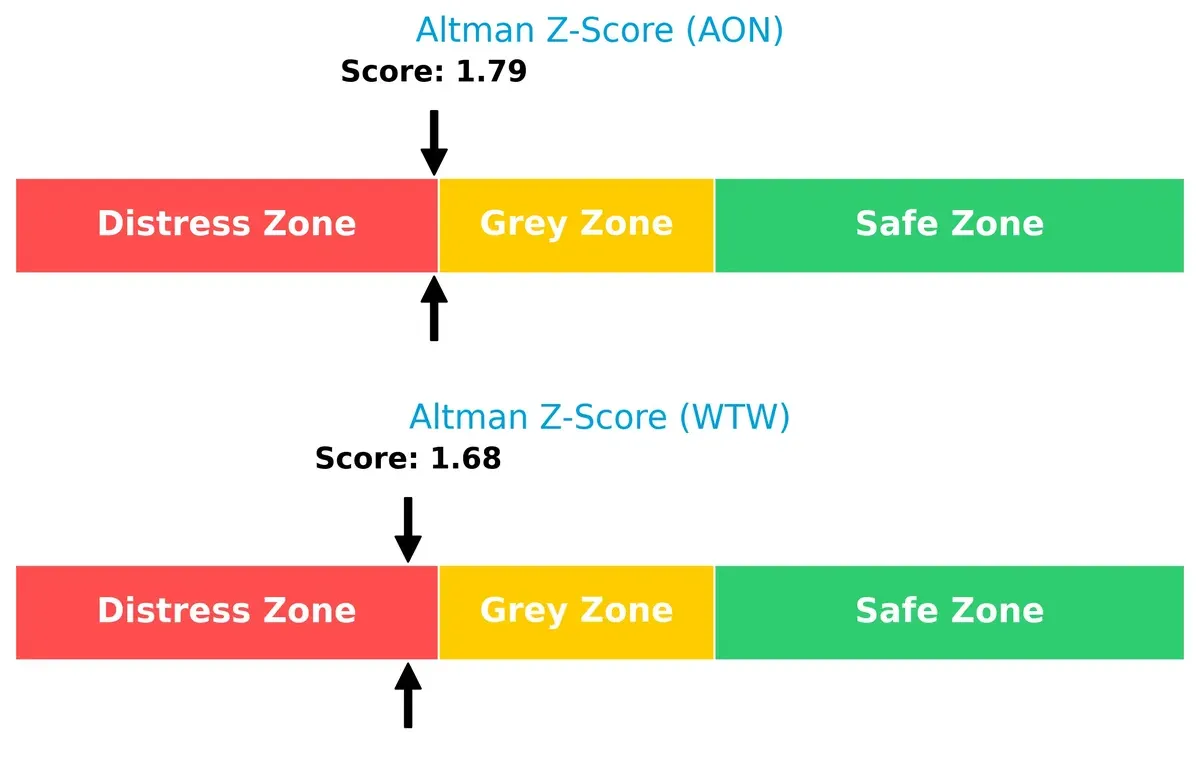
This suggests both companies face elevated bankruptcy risk in the current cycle. Historically, firms in this range require close monitoring of leverage and liquidity to avoid solvency crises.
Financial Health: Quality of Operations
Aon’s Piotroski F-Score of 8 outperforms Willis Towers Watson’s 6, signaling superior internal financial health and operational quality:
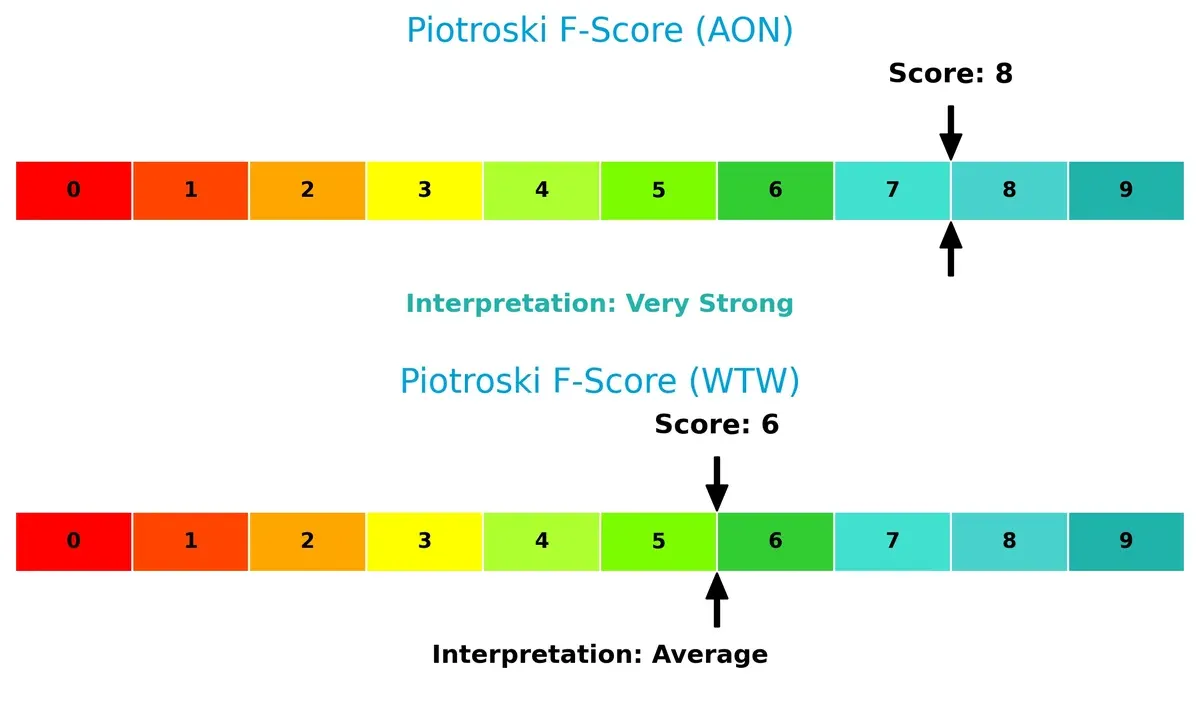
Aon demonstrates strong profitability, liquidity, and efficiency metrics, while Willis shows some red flags internally. This points to Aon as the financially stronger operator despite its balance sheet vulnerabilities.
How are the two companies positioned?
This section dissects the operational DNA of Aon and WTW by comparing their revenue distribution and internal dynamics. The goal is to confront their economic moats to uncover which model delivers the most resilient competitive edge today.
Revenue Segmentation: The Strategic Mix
This visual comparison dissects how Aon plc and Willis Towers Watson diversify their income streams and where their primary sector bets lie:
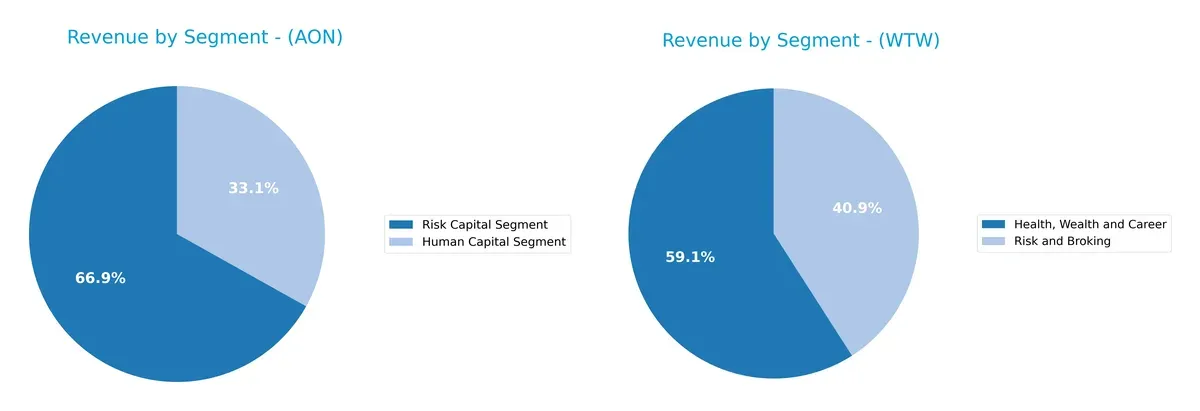
Aon’s 2024 revenue pivots heavily on the Risk Capital Segment at $10.5B, dwarfing its Human Capital Segment at $5.2B. Willis Towers Watson shows a more balanced split: $5.8B from Health, Wealth and Career and $4.1B from Risk and Broking. Aon’s concentration suggests strong dominance in risk solutions, posing concentration risk but reinforcing ecosystem lock-in. WTW’s diversified mix spreads exposure, cushioning against sector-specific downturns while leveraging human capital expertise.
Strengths and Weaknesses Comparison
This table compares the Strengths and Weaknesses of Aon plc and Willis Towers Watson Public Limited Company:
Aon Strengths
- Strong profitability with net margin at 21.51% and ROE at 39.51%
- Favorable ROIC at 13.18% exceeding WACC at 6.86%
- Diversified revenue streams across multiple segments
- Solid global presence with significant US and EMEA revenues
WTW Strengths
- Favorable WACC at 6.23% supporting capital efficiency
- Positive PE ratio despite losses indicates growth potential
- Favorable debt to assets ratio at 21.43% for financial stability
- Diversified revenue in Health, Wealth, Career, and Risk Broking
- Strong quick ratio at 1.2 signals liquidity
Aon Weaknesses
- High debt to equity ratio at 1.77 raises leverage concerns
- Negative interest coverage of -5.78 signals risk in debt servicing
- Unfavorable asset turnover at 0.34 suggests low asset efficiency
- High price-to-book ratio at 8.15 may imply overvaluation
- Low dividend yield at 0.83% might deter income-focused investors
WTW Weaknesses
- Negative profitability metrics with net margin at -0.99% and ROE at -1.23%
- Negative ROIC at -3.49% indicates value destruction
- Unfavorable interest coverage at 1.4 may constrain debt flexibility
- Unfavorable price-to-book at 4.02 could reflect market skepticism
- Unfavorable asset turnover at 0.36 shows inefficiency
Aon’s strengths lie in robust profitability and solid global diversification but face risks from leverage and asset use inefficiencies. WTW struggles with profitability and return metrics despite liquidity and capital structure advantages, highlighting strategic challenges ahead.
The Moat Duel: Analyzing Competitive Defensibility
A structural moat is the only defense long-term profits have against competition’s relentless erosion. Let’s dissect the protective barriers of Aon plc and Willis Towers Watson:
Aon plc: Wide Economic Moat via Superior Capital Efficiency
Aon’s moat stems from its high ROIC exceeding WACC by 6.3%, signaling efficient capital use and value creation. Sustained margin strength and 32.5% ROIC growth underpin durable profitability. Expansion into new risk consulting markets in 2026 should deepen this advantage.
Willis Towers Watson: Struggling Moat with Declining Capital Returns
WTW’s moat is fragile, marked by a negative ROIC spread of -9.7% versus WACC and a steep downward ROIC trend. Unlike Aon, WTW struggles to convert capital into profits, reflected in shrinking margins and net losses. Potential lies in tech-driven services, but disruption risks loom large.
Moat Strength Showdown: Capital Efficiency vs. Capital Drain
Aon’s wider, growing moat outclasses WTW’s shrinking competitive edge. Aon’s superior capital allocation and consistent profitability better defend market share against competitive threats in 2026 and beyond.
Which stock offers better returns?
Over the past 12 months, Aon plc and Willis Towers Watson have shown distinct bullish trends with decelerating momentum, reflecting notable price gains and dynamic trading volumes.
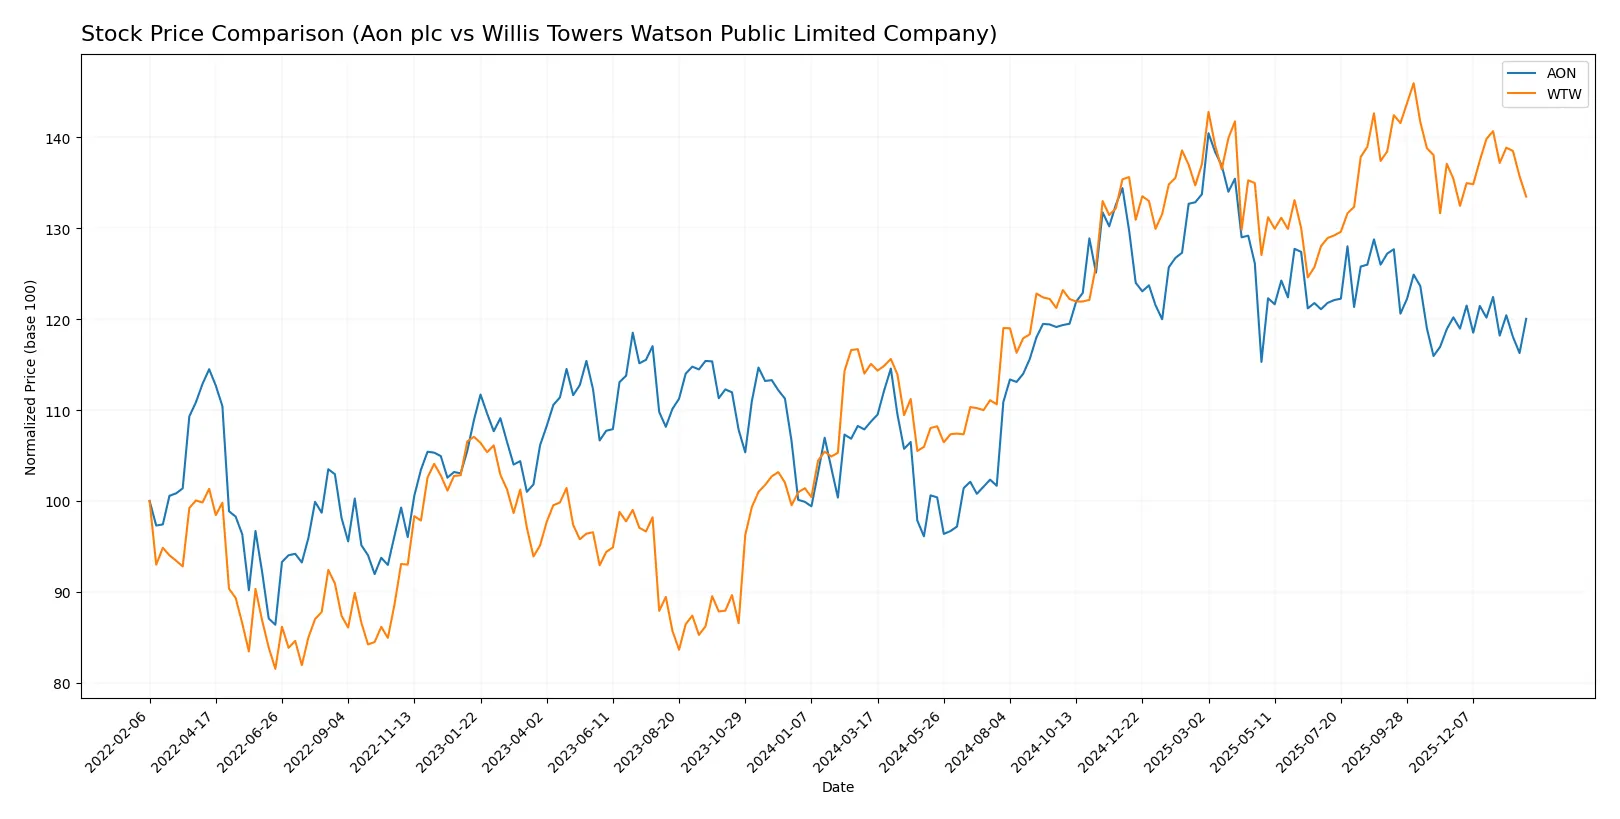
Trend Comparison
Aon plc’s stock rose 10.38% over the last year, marking a bullish trend with deceleration. The price ranged between 280 and 409, showing moderate volatility (29.63 std deviation).
Willis Towers Watson’s shares increased 15.99% in 12 months, also bullish but decelerating. The price fluctuated from 251 to 347, with lower volatility than Aon (26.11 std deviation).
WTW outperformed AON with a higher 12-month return (15.99% vs. 10.38%). Both stocks slowed recently but maintained positive overall trends.
Target Prices
Analysts set a clear target consensus for Aon plc and Willis Towers Watson, indicating potential upside from current levels.
| Company | Target Low | Target High | Consensus |
|---|---|---|---|
| Aon plc | 381 | 448 | 403.75 |
| Willis Towers Watson PLC | 318 | 398 | 367.22 |
The consensus targets for both companies exceed their current prices, signaling analyst optimism. Aon’s target consensus is about 15% above its current price of 350 USD; Willis Towers Watson shows a roughly 16% upside from 317 USD.

Don’t Let Luck Decide Your Entry Point
Optimize your entry points with our advanced ProRealTime indicators. You’ll get efficient buy signals with precise price targets for maximum performance. Start outperforming now!
How do institutions grade them?
This section compares the latest institutional grades assigned to Aon plc and Willis Towers Watson Public Limited Company:
Aon plc Grades
The following table summarizes recent grades assigned to Aon plc by major financial institutions.
| Grading Company | Action | New Grade | Date |
|---|---|---|---|
| Cantor Fitzgerald | maintain | Overweight | 2026-01-14 |
| Wells Fargo | maintain | Overweight | 2026-01-13 |
| Barclays | maintain | Equal Weight | 2026-01-08 |
| JP Morgan | maintain | Overweight | 2026-01-07 |
| Keefe, Bruyette & Woods | maintain | Outperform | 2026-01-06 |
| Barclays | downgrade | Equal Weight | 2025-11-20 |
| UBS | maintain | Neutral | 2025-11-10 |
| Keefe, Bruyette & Woods | maintain | Outperform | 2025-11-04 |
| TD Cowen | maintain | Buy | 2025-11-03 |
| Evercore ISI Group | maintain | Outperform | 2025-11-03 |
Willis Towers Watson Public Limited Company Grades
This table details recent institutional grades for Willis Towers Watson Public Limited Company.
| Grading Company | Action | New Grade | Date |
|---|---|---|---|
| Cantor Fitzgerald | maintain | Neutral | 2026-01-14 |
| Wells Fargo | maintain | Overweight | 2026-01-13 |
| Barclays | maintain | Underweight | 2026-01-08 |
| Evercore ISI Group | maintain | Outperform | 2026-01-07 |
| Keefe, Bruyette & Woods | maintain | Outperform | 2026-01-06 |
| Keefe, Bruyette & Woods | maintain | Outperform | 2025-12-12 |
| Wells Fargo | maintain | Overweight | 2025-12-12 |
| Barclays | maintain | Underweight | 2025-11-20 |
| TD Cowen | maintain | Buy | 2025-11-10 |
| Keefe, Bruyette & Woods | maintain | Outperform | 2025-11-04 |
Which company has the best grades?
Aon plc generally receives stronger grades, including multiple Overweight and Outperform ratings. Willis Towers Watson shows more mixed signals, with some Underweight grades from Barclays. Better grades may indicate higher institutional confidence in Aon’s near-term prospects, potentially influencing investor sentiment.
Risks specific to each company
The following categories identify the critical pressure points and systemic threats facing both firms in the 2026 market environment:
1. Market & Competition
Aon plc
- Strong market position with 21.5% net margin and 39.5% ROE supports competitive moat.
Willis Towers Watson Public Limited Company
- Negative net margin (-0.99%) and ROE (-1.23%) indicate operational challenges amid fierce competition.
2. Capital Structure & Debt
Aon plc
- High debt-to-equity ratio (1.77) and negative interest coverage (-5.78) raise financial risk flags.
Willis Towers Watson Public Limited Company
- Moderate leverage (debt-to-equity 0.75), but weak interest coverage (1.4) signals vulnerability.
3. Stock Volatility
Aon plc
- Beta of 0.83 suggests moderate volatility below market average, appealing to risk-conscious investors.
Willis Towers Watson Public Limited Company
- Lower beta (0.64) implies less price volatility, potentially more stable in turbulent markets.
4. Regulatory & Legal
Aon plc
- Global operations expose Aon to complex regulatory regimes but diversified risk advisory mitigates impact.
Willis Towers Watson Public Limited Company
- UK base subjects WTW to Brexit-related regulatory uncertainty and evolving insurance compliance standards.
5. Supply Chain & Operations
Aon plc
- Large workforce (60K) and operational scale require robust management to avoid inefficiencies.
Willis Towers Watson Public Limited Company
- Smaller employee base (49K) may limit operational flexibility but reduces fixed cost burden.
6. ESG & Climate Transition
Aon plc
- Increasing demand for ESG advisory creates growth opportunities but requires ongoing investment.
Willis Towers Watson Public Limited Company
- ESG integration lags peers, risking reputational damage and client attrition in sustainable finance trends.
7. Geopolitical Exposure
Aon plc
- Ireland headquarters and global footprint expose Aon to currency and geopolitical risks, including US-EU tensions.
Willis Towers Watson Public Limited Company
- UK domicile heightens Brexit-related geopolitical uncertainties affecting cross-border service delivery.
Which company shows a better risk-adjusted profile?
Aon’s primary risk lies in its stretched capital structure and weak interest coverage, threatening financial flexibility. WTW’s biggest risk stems from persistent unprofitability and regulatory uncertainties. Despite Aon’s debt concerns, its stronger profitability and market position yield a more favorable risk-adjusted profile. Notably, Aon’s Altman Z-score near distress contrasts with WTW’s deeper distress zone, underscoring WTW’s heightened bankruptcy risk.
Final Verdict: Which stock to choose?
Aon plc’s superpower lies in its durable competitive advantage, consistently generating returns well above its cost of capital. I see it as a cash-generating machine with a proven track record of profitability and growth. Its point of vigilance is the relatively high debt load, which may constrain flexibility. Aon fits best in aggressive growth portfolios seeking long-term value creation.
Willis Towers Watson’s moat centers on its specialized expertise and recurring client relationships, providing steady revenue streams. It exhibits a safer financial profile than Aon, with moderate leverage and a more conservative balance sheet. However, its value destruction signals caution. WTW suits a GARP (Growth at a Reasonable Price) portfolio aiming for stability amid uneven earnings.
If you prioritize enduring profitability and value creation, Aon outshines with its robust ROIC and growth trajectory despite higher leverage. However, if you seek a more conservative exposure with recurring revenue safety, WTW offers better stability but bears significant headwinds. Both present distinct analytical scenarios that align with different investor risk tolerances and return expectations.
Disclaimer: Investment carries a risk of loss of initial capital. The past performance is not a reliable indicator of future results. Be sure to understand risks before making an investment decision.
Go Further
I encourage you to read the complete analyses of Aon plc and Willis Towers Watson Public Limited Company to enhance your investment decisions: