Home > Comparison > Financial Services > MMC vs AON
The strategic rivalry between Marsh & McLennan Companies, Inc. and Aon plc shapes the trajectory of the global insurance brokerage sector. Marsh & McLennan operates as a diversified risk management and consulting powerhouse, while Aon focuses on integrated commercial risk, health, and wealth solutions. This head-to-head pits broad consulting expertise against specialized risk advisory. This analysis aims to identify which business model delivers superior risk-adjusted returns for a diversified portfolio in financial services.

Table of contents
Companies Overview
Marsh & McLennan and Aon lead the global insurance brokerage and risk advisory market with distinct approaches.
Marsh & McLennan Companies, Inc.: Global Risk and Consulting Powerhouse
Marsh & McLennan dominates as a professional services firm specializing in risk management and consulting. It generates revenue through insurance and reinsurance broking, risk advisory, and consulting in health, wealth, and career services. In 2026, the company focuses on integrated risk solutions and expanding consulting services across diverse industries, leveraging its established global footprint.
Aon plc: Comprehensive Risk and Health Solutions Leader
Aon excels in providing commercial risk, health, and wealth advisory services. Its revenue streams include retail brokerage, cyber risk solutions, reinsurance, and strategic consulting on retirement and investment programs. In 2026, Aon prioritizes innovation in health solutions and capital markets advisory, enhancing digital platforms like CoverWallet to solidify market leadership.
Strategic Collision: Similarities & Divergences
Both firms emphasize risk advisory but differ in execution: Marsh & McLennan blends consulting with insurance broking, while Aon integrates reinsurance and health solutions with capital markets expertise. Their primary battleground is corporate risk management. Marsh’s diversified consulting contrasts with Aon’s focused health and capital advisory, shaping distinct investment profiles defined by breadth versus specialization.
Income Statement Comparison
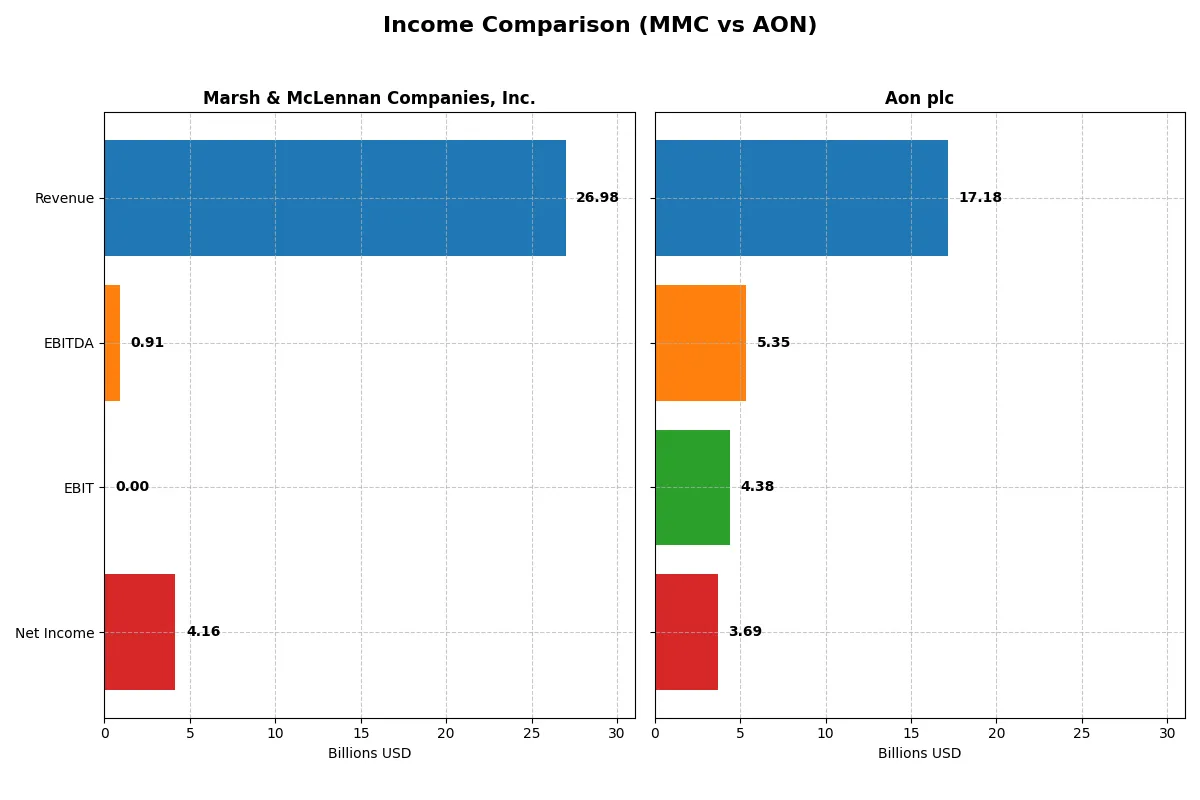
The following data dissects the core profitability and scalability of both corporate engines to reveal who dominates the bottom line:
| Metric | Marsh & McLennan Companies, Inc. (MMC) | Aon plc (AON) |
|---|---|---|
| Revenue | 27B | 17.2B |
| Cost of Revenue | 0 | 9B |
| Operating Expenses | 20.8B | 3.9B |
| Gross Profit | 0 | 8.2B |
| EBITDA | 910M | 5.3B |
| EBIT | 0 | 4.4B |
| Interest Expense | 960M | 815M |
| Net Income | 4.2B | 3.7B |
| EPS | 8.48 | 17.13 |
| Fiscal Year | 2025 | 2025 |
Income Statement Analysis: The Bottom-Line Duel
This income statement comparison exposes which company converts revenue into profit most efficiently, revealing the true financial engine behind each firm.
Marsh & McLennan Companies, Inc. (MMC) Analysis
MMC’s revenue climbed steadily from $19.8B in 2021 to $27B in 2025, with net income rising from $3.14B to $4.16B. Despite solid top-line growth, MMC’s gross and EBIT margins are reported as unfavorable, indicating operational challenges. The 2025 net margin of 15.4% shows decent profitability, yet margin contraction and rising expenses suggest efficiency pressures.
Aon plc (AON) Analysis
Aon’s revenue grew from $12.2B in 2021 to $17.2B in 2025, with net income surging from $1.25B to $3.7B. It maintains strong margin health, boasting a 47.7% gross margin and 21.5% net margin in 2025. Consistent margin expansion and robust EPS growth reflect improving operational leverage and cost control, supporting sustainable momentum.
Margin Resilience vs. Scale Growth
Aon outperforms MMC in margin quality and net income growth, nearly doubling MMC’s net margin and delivering a spectacular 194% net income increase over five years. MMC’s revenue scale is larger, but its margin erosion and expense growth temper earnings quality. For investors prioritizing margin resilience and rapid profitability growth, Aon presents a stronger profile.
Financial Ratios Comparison
These vital ratios act as a diagnostic tool to expose the underlying fiscal health, valuation premiums, and capital efficiency of Marsh & McLennan Companies, Inc. and Aon plc:
| Ratios | Marsh & McLennan (MMC) | Aon plc (AON) |
|---|---|---|
| ROE | 7.18% | 39.51% |
| ROIC | 12.12% | 12.16% |
| P/E | 21.90 | 20.54 |
| P/B | 157.32 | 8.12 |
| Current Ratio | 1.10 | 1.11 |
| Quick Ratio | 1.10 | 1.11 |
| D/E (Debt to Equity) | 37.04 | 1.77 |
| Debt-to-Assets | 36.53% | 32.55% |
| Interest Coverage | 6.48 | 5.33 |
| Asset Turnover | 0.46 | 0.34 |
| Fixed Asset Turnover | 0 | 12.46 |
| Payout Ratio | 40.84% | 17.02% |
| Dividend Yield | 1.87% | 0.83% |
| Fiscal Year | 2025 | 2025 |
Efficiency & Valuation Duel: The Vital Signs
Financial ratios act as the company’s DNA, uncovering hidden risks and operational strengths that shape investor decisions.
Marsh & McLennan Companies, Inc.
Marsh & McLennan shows modest profitability with a return on equity near 7.2%, signaling average shareholder returns. Its valuation metrics, such as an EV-to-sales around 4.07, suggest a moderately priced stock. The company does not offer dividends, implying reinvestment in growth or operational efficiency. However, the high net debt to EBITDA ratio raises caution.
Aon plc
Aon delivers robust profitability with a 39.5% ROE and favorable net margin at 21.5%, indicating strong operational efficiency. Its P/E ratio of 20.5 reflects a fairly valued stock compared to sector peers. While the dividend yield is low at 0.83%, Aon balances shareholder returns with solid free cash flow generation and disciplined capital management.
Operational Strength vs. Valuation Discipline
Aon leads on profitability and operational metrics, offering a more efficient capital return profile. Marsh & McLennan trades at a moderate valuation but carries higher leverage risks. Investors prioritizing growth and efficiency may prefer Aon, while those cautious on debt might consider Marsh & McLennan’s steadier profile.
Which one offers the Superior Shareholder Reward?
I see Marsh & McLennan (MMC) delivers a 1.87% dividend yield with a 41% payout ratio, balancing income and reinvestment. Its buyback program is robust, supporting sustainable shareholder returns. Aon (AON) yields 0.83% with a 17% payout ratio, favoring growth and buybacks. Historically, MMC’s higher yield and balanced payout suggest a stronger total return profile in 2026.
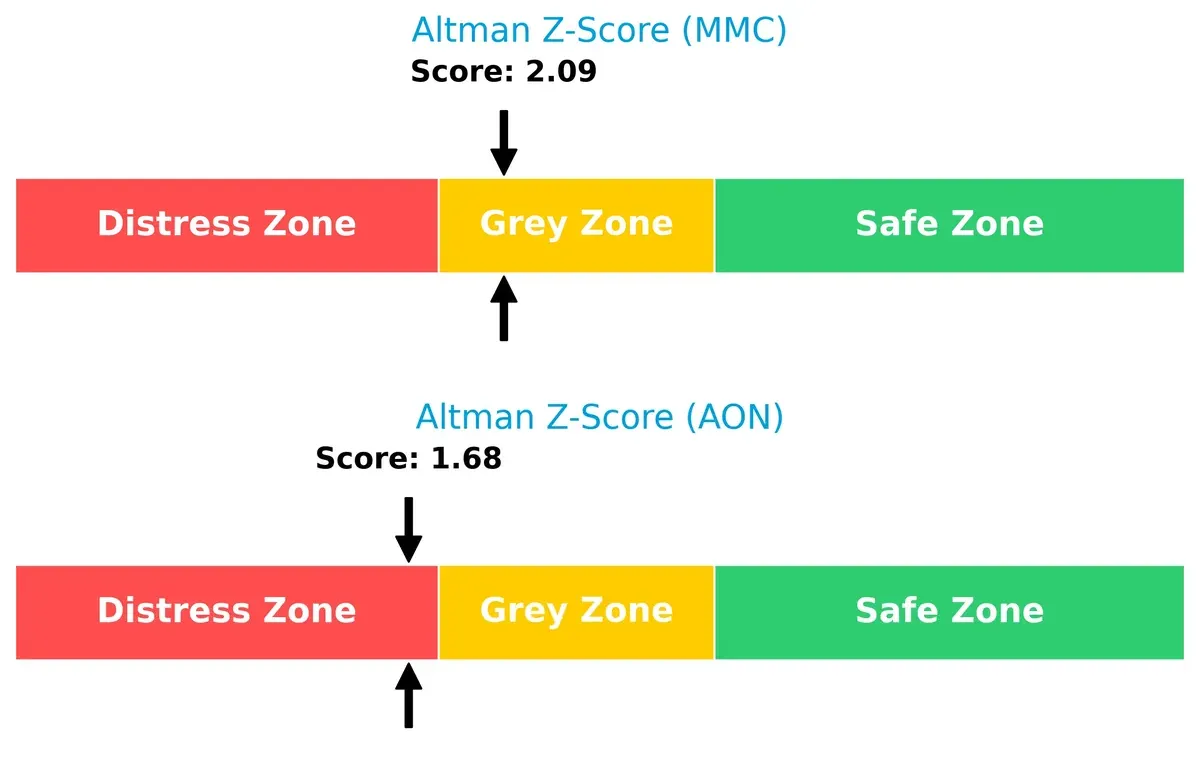
Bankruptcy Risk: Solvency Showdown
I observe a clear Altman Z-Score gap: Marsh & McLennan sits in the grey zone at 2.09, while Aon falls into the distress zone at 1.68. This signals Marsh & McLennan holds a safer solvency position for long-term survival in this cycle:
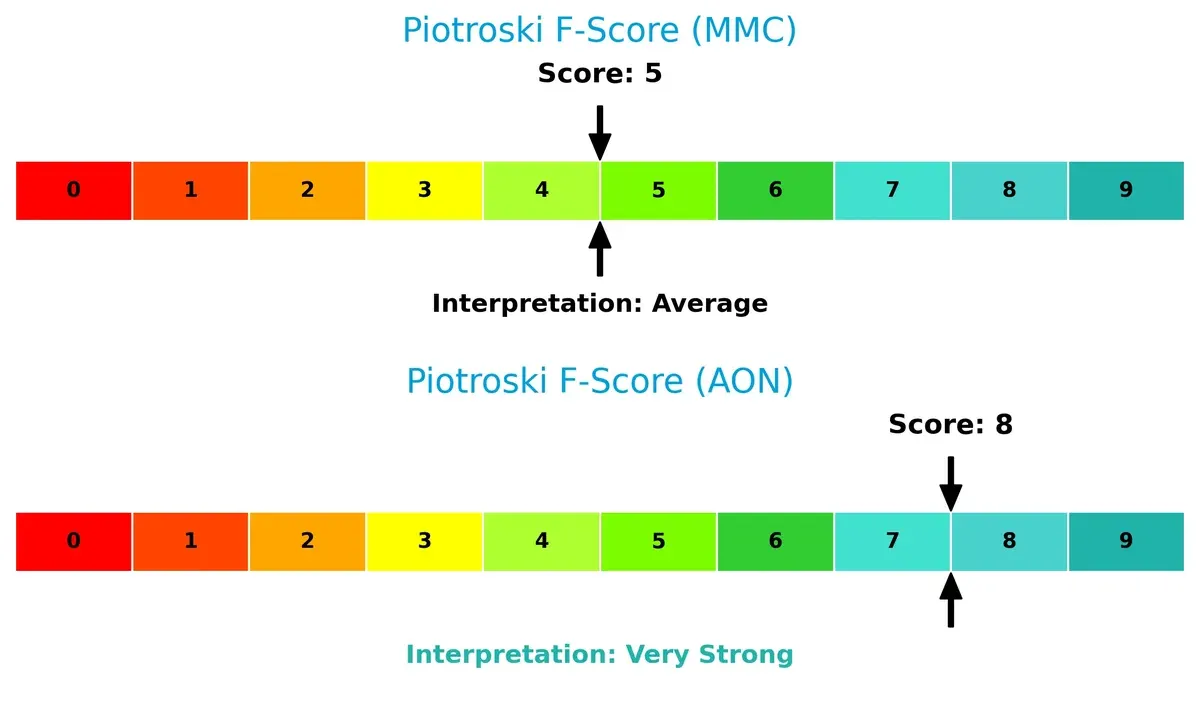
Financial Health: Quality of Operations
Aon excels with a Piotroski F-Score of 8, indicating very strong financial health. Marsh & McLennan’s score of 5 reflects average operational quality, suggesting potential red flags relative to Aon’s robustness:
How are the two companies positioned?
This section dissects MMC and AON’s operational DNA by comparing their revenue distribution and internal dynamics. The goal is to confront their economic moats and reveal which model offers the most resilient, sustainable advantage today.
Revenue Segmentation: The Strategic Mix
This visual comparison dissects how Marsh & McLennan Companies, Inc. and Aon plc diversify their income streams and reveals their primary sector bets:
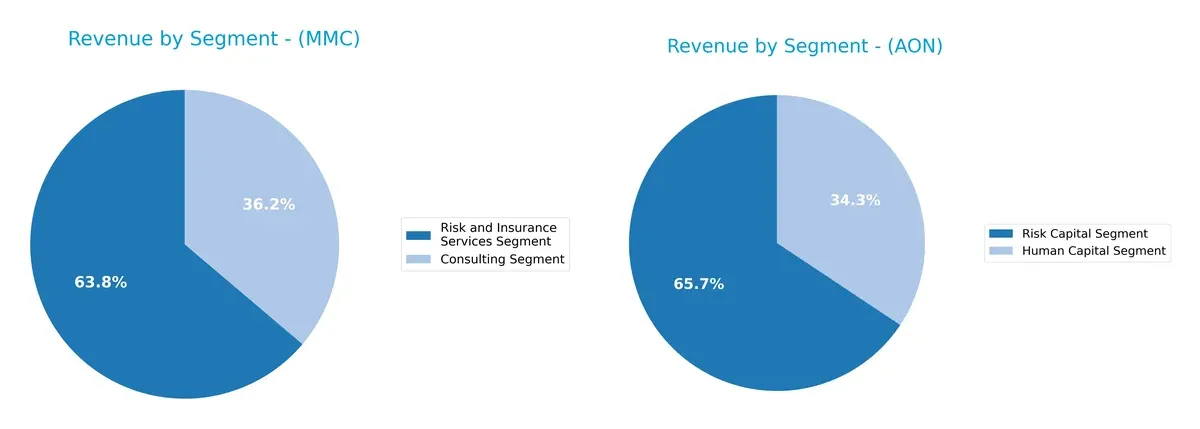
Marsh & McLennan anchors revenue in two dominant segments: $17.3B from Risk and Insurance Services and $9.8B in Consulting. This near-duopoly suggests balanced diversification with moderate concentration risk. Aon, however, pivots around $11.3B in Risk Capital and $5.9B in Human Capital, showing a slightly more concentrated model. Marsh’s split supports ecosystem lock-in, while Aon’s focus signals infrastructure dominance but higher reliance on core verticals.
Strengths and Weaknesses Comparison
This table compares the strengths and weaknesses of Marsh & McLennan Companies, Inc. and Aon plc:
MMC Strengths
- Diversified revenue from Risk and Insurance Services and Consulting segments
- Strong global presence with $13.3B US revenue and $9.9B from other areas
- Consistent revenue growth in key segments over years
AON Strengths
- Favorable profitability metrics with 21.5% net margin and 39.5% ROE
- Balanced segment revenue from Risk Capital and Human Capital
- Solid global footprint with strong US and EMEA revenues
MMC Weaknesses
- Lack of available financial ratios and key metrics limits performance evaluation
- Possible dependence on US market with large revenue concentration
- No explicit innovation or market share data
AON Weaknesses
- Unfavorable price-to-book ratio (8.12) and debt-to-equity (1.77) indicate valuation and leverage concerns
- Moderate current ratio (1.11) suggests limited liquidity cushion
- Asset turnover (0.34) unfavorable, indicating capital efficiency issues
Overall, MMC shows a diversified business model with strong geographic revenue, yet lacks transparent financial ratios. AON demonstrates robust profitability but faces leverage and valuation headwinds. Both companies’ strategies must consider these factors to sustain competitive positioning.
The Moat Duel: Analyzing Competitive Defensibility
A structural moat protects long-term profits from relentless competitive erosion. Without it, market share and margins inevitably decline. Here’s how Marsh & McLennan and Aon stack up:
Marsh & McLennan Companies, Inc.: Intangible Assets and Advisory Expertise
Marsh & McLennan leverages deep industry knowledge and trusted advisory relationships as its moat. This shows in steady net margins near 15%, despite some margin pressure in 2025. Expanding consulting services and global risk solutions could strengthen this moat, but margin volatility signals caution.
Aon plc: Strong Capital Efficiency and Growing ROIC
Aon’s moat centers on its superior capital allocation and scalable risk solutions platform. Its ROIC exceeds WACC by 5.4%, with a 22% ROIC growth trend, signaling durable value creation. Consistent margin expansion and international diversification position Aon to deepen its moat through innovation and acquisitions in 2026.
Advisory Expertise vs. Capital Efficiency: Who Holds the Deeper Moat?
Aon’s robust ROIC growth and margin improvement deliver a wider, more sustainable moat than Marsh & McLennan’s advisory-driven advantage. I see Aon better equipped to defend and expand market share amid intensifying competition.
Which stock offers better returns?
Over the past 12 months, both Marsh & McLennan Companies and Aon saw declining stock prices, with notable peaks and troughs shaping their trading dynamics.
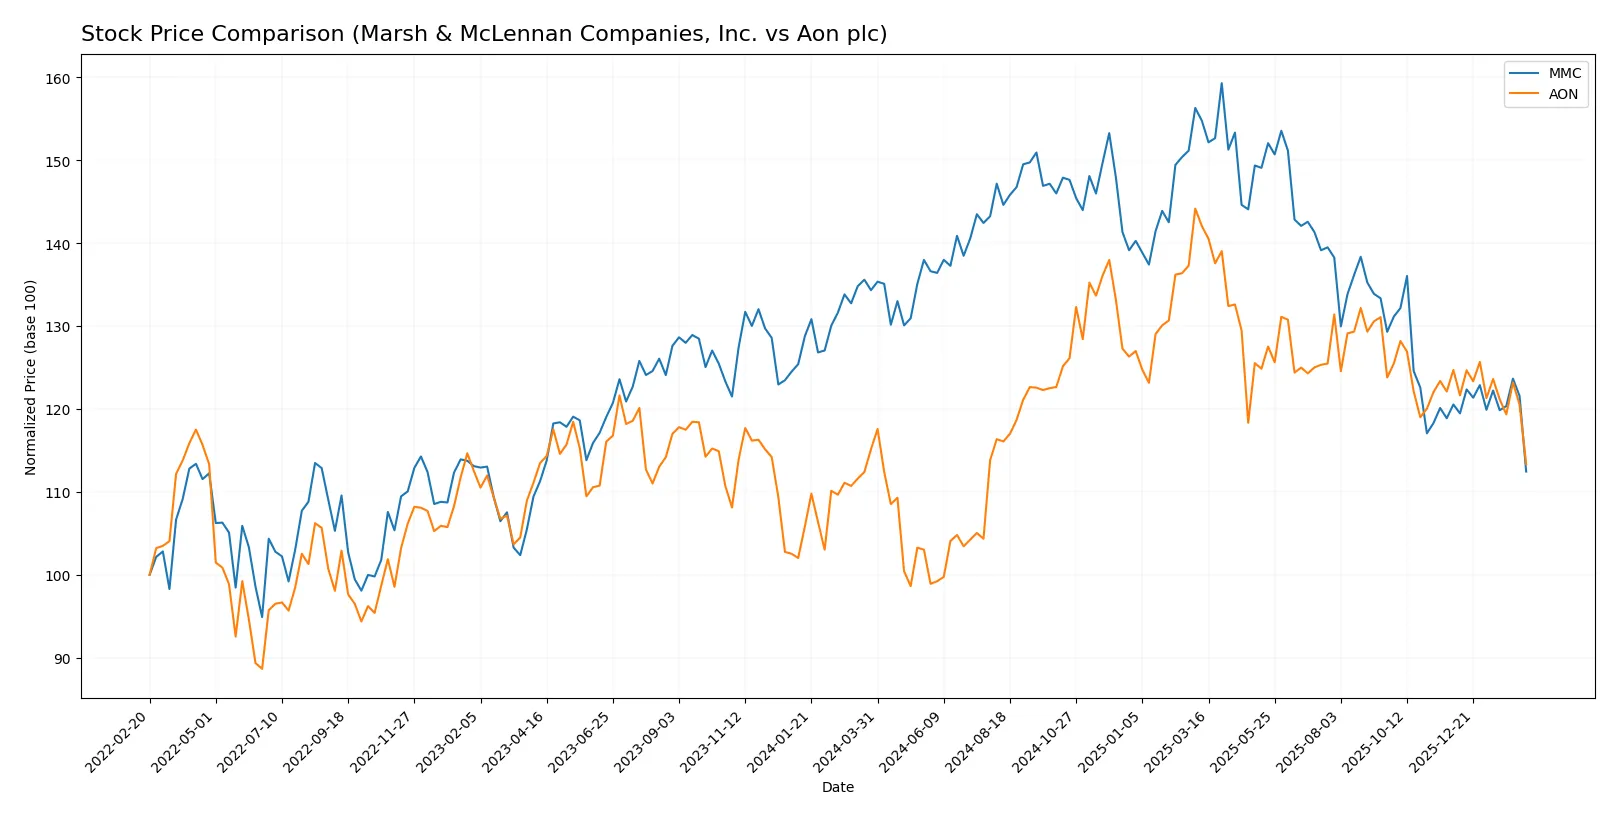
Trend Comparison
Marsh & McLennan Companies’ stock declined 16.28% over the past year, showing a bearish trend with decelerating momentum and a high volatility of 16.46. Recent months reflect continued downward pressure with a -6.71% drop.
Aon’s stock fell 1.56% over the same period, also bearish but closer to neutral territory. Volatility is higher at 29.44, and recent performance worsened with a -9.1% decline and stronger negative slope.
Comparing both, Marsh & McLennan suffered a more significant overall loss, while Aon showed milder annual depreciation but steeper recent decline. Marsh & McLennan’s stock delivered the lower market performance.
Target Prices
Analysts show a clear upside potential for both Marsh & McLennan and Aon plc based on current consensus targets.
| Company | Target Low | Target High | Consensus |
|---|---|---|---|
| Marsh & McLennan Companies, Inc. | 190 | 257 | 211.1 |
| Aon plc | 381 | 443 | 404.8 |
The consensus target prices imply 15%+ upside for Marsh & McLennan and nearly 26% for Aon versus current prices, reflecting strong analyst confidence in growth and valuation.

Don’t Let Luck Decide Your Entry Point
Optimize your entry points with our advanced ProRealTime indicators. You’ll get efficient buy signals with precise price targets for maximum performance. Start outperforming now!
How do institutions grade them?
Marsh & McLennan Companies, Inc. Grades
The table below summarizes recent grades from reputable institutions for Marsh & McLennan Companies, Inc.:
| Grading Company | Action | New Grade | Date |
|---|---|---|---|
| Cantor Fitzgerald | Maintain | Overweight | 2026-01-14 |
| Wells Fargo | Maintain | Equal Weight | 2026-01-13 |
| Barclays | Maintain | Overweight | 2026-01-08 |
| Evercore ISI Group | Maintain | Outperform | 2026-01-07 |
| JP Morgan | Maintain | Overweight | 2026-01-07 |
| Keefe, Bruyette & Woods | Maintain | Market Perform | 2026-01-06 |
| Citigroup | Maintain | Neutral | 2025-12-04 |
| Barclays | Upgrade | Overweight | 2025-11-20 |
| B of A Securities | Downgrade | Underperform | 2025-11-03 |
| TD Cowen | Maintain | Hold | 2025-11-03 |
Aon plc Grades
The table below summarizes recent grades from reputable institutions for Aon plc:
| Grading Company | Action | New Grade | Date |
|---|---|---|---|
| Citigroup | Maintain | Buy | 2026-02-03 |
| Cantor Fitzgerald | Maintain | Overweight | 2026-02-02 |
| Wells Fargo | Maintain | Overweight | 2026-02-02 |
| Cantor Fitzgerald | Maintain | Overweight | 2026-01-14 |
| Wells Fargo | Maintain | Overweight | 2026-01-13 |
| Barclays | Maintain | Equal Weight | 2026-01-08 |
| JP Morgan | Maintain | Overweight | 2026-01-07 |
| Keefe, Bruyette & Woods | Maintain | Outperform | 2026-01-06 |
| Barclays | Downgrade | Equal Weight | 2025-11-20 |
| UBS | Maintain | Neutral | 2025-11-10 |
Which company has the best grades?
Aon plc holds stronger grades overall, including a recent Buy from Citigroup and several Overweight ratings. Marsh & McLennan shows a mixed profile with some downgrades. Investors may view Aon’s grades as a more consistent vote of confidence.
Risks specific to each company
The following categories identify the critical pressure points and systemic threats facing both firms in the 2026 market environment:
1. Market & Competition
Marsh & McLennan Companies, Inc.
- Large market cap and diversified services sustain competitive moat but faces intense pricing pressure in insurance brokerage.
Aon plc
- Strong market position with innovative health and retirement solutions; faces competition from agile fintech and insurtech startups.
2. Capital Structure & Debt
Marsh & McLennan Companies, Inc.
- Data unavailable for detailed capital structure analysis; lack of transparency is a red flag for risk assessment.
Aon plc
- Debt-to-equity ratio at 1.77 signals high leverage, raising financial risk despite adequate interest coverage ratios.
3. Stock Volatility
Marsh & McLennan Companies, Inc.
- Beta of 0.75 indicates lower volatility than market, offering relative stability for investors.
Aon plc
- Beta of 0.81 suggests moderate volatility, slightly higher than MMC but still below market average.
4. Regulatory & Legal
Marsh & McLennan Companies, Inc.
- Operates globally with exposure to diverse regulatory regimes; potential compliance costs could rise.
Aon plc
- International footprint adds regulatory complexity; recent expansions increase exposure to multi-jurisdictional legal risks.
5. Supply Chain & Operations
Marsh & McLennan Companies, Inc.
- Relies on high-quality consulting talent; talent retention pressure amid competitive labor markets.
Aon plc
- Faces operational risks integrating multiple service platforms; maintaining service quality is critical.
6. ESG & Climate Transition
Marsh & McLennan Companies, Inc.
- Increasing client demand for sustainability advisory services presents opportunity but also risk of reputational damage if standards slip.
Aon plc
- Active in climate risk consulting; however, exposure to ESG compliance costs and transition risks remains significant.
7. Geopolitical Exposure
Marsh & McLennan Companies, Inc.
- US-centered operations face moderate geopolitical risks, including regulatory shifts and trade tensions.
Aon plc
- Irish headquarters and global reach expose Aon to Brexit aftermath and EU regulatory changes.
Which company shows a better risk-adjusted profile?
Marsh & McLennan’s opaque capital data and average financial scores place it in a moderate risk zone. Aon’s high leverage and unfavorable valuation metrics amplify financial risks, despite very strong operational scores. I see Aon’s leverage and valuation as the most impactful risks. MMC’s lack of transparency is a concern but its lower stock volatility supports a steadier profile. Given Aon’s distress-zone Altman Z-score and high debt, Marsh & McLennan presents a relatively better risk-adjusted profile in 2026.
Final Verdict: Which stock to choose?
Marsh & McLennan Companies (MMC) excels as a cash-generating powerhouse with solid revenue growth and decent return on capital. Its main point of vigilance lies in fluctuating free cash flow metrics, which could signal cyclical pressures. MMC fits well in aggressive growth portfolios willing to tolerate earnings volatility.
Aon plc’s strategic moat is its strong recurring revenue model supported by a sustainable competitive advantage reflected in a very favorable ROIC over WACC. It offers better earnings quality and stability compared to MMC, making it suitable for GARP investors seeking growth with reasonable safety margins.
If you prioritize aggressive growth with potential for capital appreciation, MMC’s cash flow generation and expansion could be compelling despite some volatility. However, if you seek a durable competitive advantage paired with more consistent profitability and financial stability, Aon offers better stability and a moat that outshines MMC’s cyclical risks. Each stock fits distinct investor profiles, demanding careful alignment with your risk tolerance.
Disclaimer: Investment carries a risk of loss of initial capital. The past performance is not a reliable indicator of future results. Be sure to understand risks before making an investment decision.
Go Further
I encourage you to read the complete analyses of Marsh & McLennan Companies, Inc. and Aon plc to enhance your investment decisions: