Home > Comparison > Financial Services > AON vs ERIE
The strategic rivalry between Aon plc and Erie Indemnity Company shapes the competitive landscape of insurance brokerage. Aon, a global financial services powerhouse, delivers comprehensive risk and health solutions. Erie, a focused U.S.-based managing attorney-in-fact, excels in underwriting and policy services. This head-to-head contrasts scale and diversification against niche operational efficiency. This analysis aims to reveal which trajectory offers a superior risk-adjusted profile for a balanced portfolio.
Table of contents
Companies Overview
Aon plc and Erie Indemnity Company stand as key players in the US and global insurance brokerage markets.
Aon plc: Global Risk and Health Solutions Powerhouse
Aon plc leads as a professional services firm specializing in risk, retirement, and health solutions worldwide. Its core revenue comes from commercial risk brokerage, cyber risk consulting, and health benefits brokerage. In 2026, Aon focuses strategically on expanding integrated risk and health services, enhancing digital platforms like CoverWallet to deepen client engagement.
Erie Indemnity Company: Regional Insurance Management Specialist
Erie Indemnity Company operates primarily in the US as a managing attorney-in-fact for Erie Insurance Exchange policyholders. It generates revenue through underwriting, policy issuance, and agent support services. In 2026, Erie emphasizes sustaining its strong regional presence by refining underwriting efficiency and bolstering agent compensation and support.
Strategic Collision: Similarities & Divergences
Both firms operate in the insurance brokerage sector, yet Aon pursues a global, diversified advisory model while Erie focuses on a regional, client-centric managing agency approach. They compete mainly in risk management and underwriting services. Investors should note Aon’s broad scale and innovation contrast with Erie’s concentrated market niche and operational discipline.
Income Statement Comparison
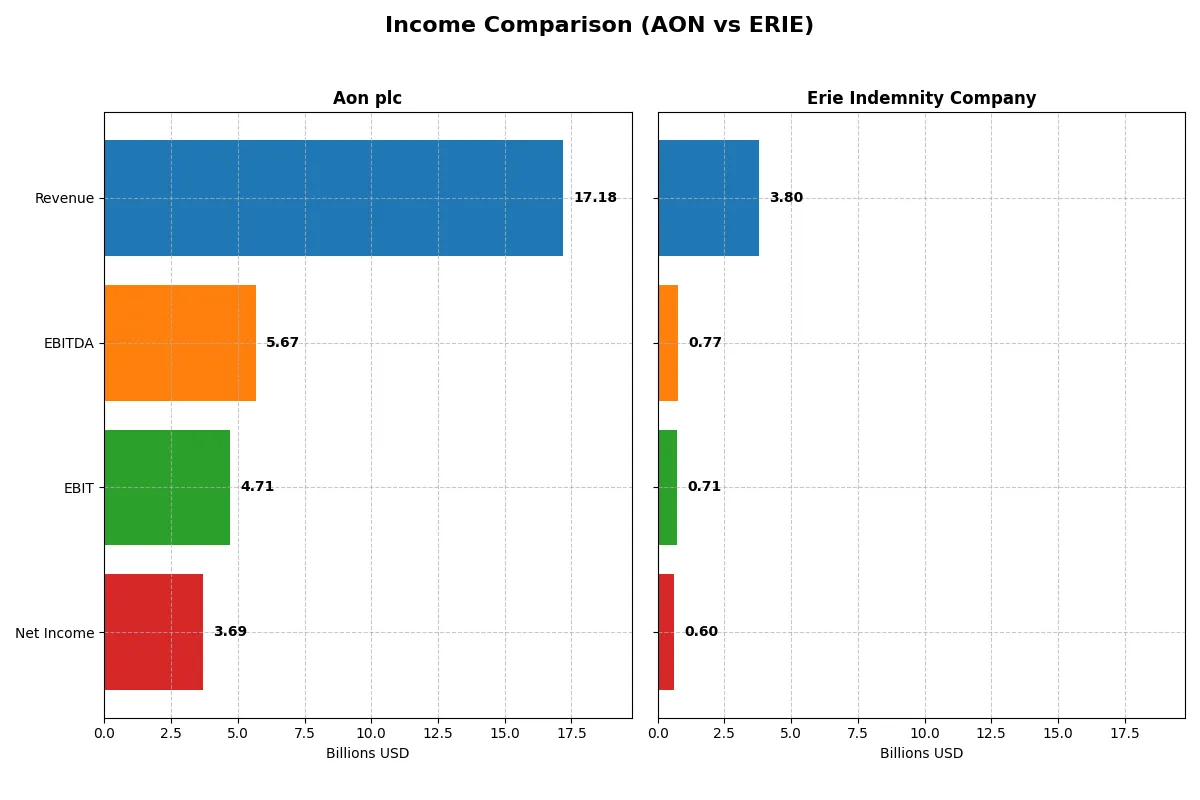
This data dissects the core profitability and scalability of both corporate engines to reveal who dominates the bottom line:
| Metric | Aon plc (AON) | Erie Indemnity Company (ERIE) |
|---|---|---|
| Revenue | 17.2B | 3.8B |
| Cost of Revenue | 8.99B | 3.12B |
| Operating Expenses | 12.8B | 0 |
| Gross Profit | 8.20B | 676M |
| EBITDA | 5.68B | 766M |
| EBIT | 4.71B | 710M |
| Interest Expense | 815M | 0 |
| Net Income | 3.70B | 600M |
| EPS | 17.11 | 12.89 |
| Fiscal Year | 2025 | 2024 |
Income Statement Analysis: The Bottom-Line Duel
This income statement comparison reveals which company operates with superior efficiency and profitability in their core business.
Aon plc Analysis
Aon’s revenue climbed steadily from 12.2B in 2021 to 17.2B in 2025, reflecting solid top-line momentum. Net income surged impressively, nearly tripling to 3.7B in 2025. Gross margin remains robust near 48%, while net margin expanded to 21.5%. The latest year shows strong margin improvement and earnings growth, signaling enhanced operational efficiency.
Erie Indemnity Company Analysis
Erie’s revenue grew from 2.5B in 2020 to 3.8B in 2024, demonstrating consistent growth but on a smaller scale. Net income doubled to 600M in 2024. Gross margin held at a modest 18%, yet net margin improved to 15.8%. The 2024 results highlight solid margin expansion and earnings momentum, supported by favorable operating leverage.
Margin Power vs. Revenue Scale
Aon outstrips Erie with superior scale, higher gross and net margins, and more pronounced earnings growth. Erie delivers steady profitability and margin gains but on a smaller revenue base. For investors, Aon’s blend of robust margin expansion and revenue scale presents a more compelling growth and efficiency profile.
Financial Ratios Comparison
These vital ratios act as a diagnostic tool to expose the underlying fiscal health, valuation premiums, and capital efficiency of the companies analyzed:
| Ratios | Aon plc (AON) | Erie Indemnity Company (ERIE) |
|---|---|---|
| ROE | 39.5% | 30.2% |
| ROIC | 13.2% | 25.6% |
| P/E | 20.6 | 31.7 |
| P/B | 8.15 | 9.58 |
| Current Ratio | 1.11 | 1.43 |
| Quick Ratio | 1.11 | 1.43 |
| D/E (Debt-to-Equity) | 1.77 | 0.0038 |
| Debt-to-Assets | 32.6% | 0.26% |
| Interest Coverage | -5.78 | 0 (not reported) |
| Asset Turnover | 0.34 | 1.31 |
| Fixed Asset Turnover | 12.46 | 7.39 |
| Payout Ratio | 17.0% | 39.6% |
| Dividend Yield | 0.83% | 1.25% |
| Fiscal Year | 2025 | 2024 |
Efficiency & Valuation Duel: The Vital Signs
Financial ratios act as a company’s DNA, revealing hidden risks and operational excellence that shape investor confidence and valuation.
Aon plc
Aon delivers strong profitability with a 39.5% ROE and healthy 21.5% net margin, signaling operational efficiency. Its P/E ratio at 20.6 appears fairly valued, though an 8.15 P/B hints at a stretched balance sheet. The 0.83% dividend yield is modest, reflecting a cautious yet consistent shareholder return amid reinvestment for growth.
Erie Indemnity Company
Erie boasts robust profitability with a 30.2% ROE and a solid 15.8% net margin, supported by an impressive 25.6% ROIC. However, its P/E of 31.7 suggests the stock trades at a premium. Zero debt and strong liquidity underpin financial safety. A 1.25% dividend yield offers steady income, balancing growth with shareholder rewards.
Premium Valuation vs. Operational Safety
Erie offers a superior balance of profitability and financial strength, with fewer red flags and a favorable ratio profile. Aon shows operational efficiency but carries more risk through leverage and valuation metrics. Investors seeking growth with lower risk may prefer Erie’s profile, while Aon appeals to those valuing efficiency amid moderate risk.
Which one offers the Superior Shareholder Reward?
I compare Aon plc and Erie Indemnity Company on dividends and buybacks. Aon yields ~0.83% with a moderate 17% payout, supported by strong free cash flow (14.9/share) and steady buybacks. Erie yields 1.25% but pays nearly 40% of earnings in dividends, limiting buyback capacity despite solid free cash flow (10.5/share). Aon’s balanced approach between dividends and buybacks offers more sustainable total shareholder return in 2026. I favor Aon for superior long-term value and total return potential.
Comparative Score Analysis: The Strategic Profile
The radar chart reveals the fundamental DNA and trade-offs of Aon plc and Erie Indemnity Company, highlighting their financial strengths and valuation challenges:
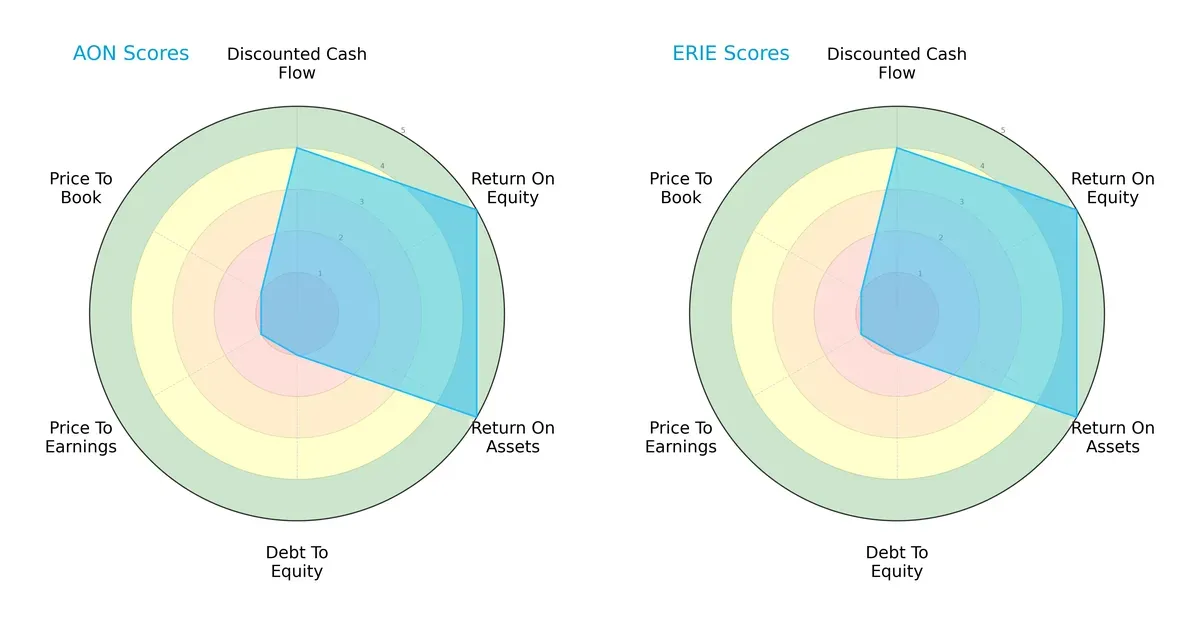
Both firms share identical scores in DCF (4), ROE (5), and ROA (5), indicating strong profitability and cash flow generation. However, both suffer from very unfavorable Debt/Equity (1) and Valuation scores (P/E and P/B at 1), suggesting high leverage and potential overvaluation. Neither company shows a balanced profile; both rely heavily on operational efficiency while facing financial structure risks.
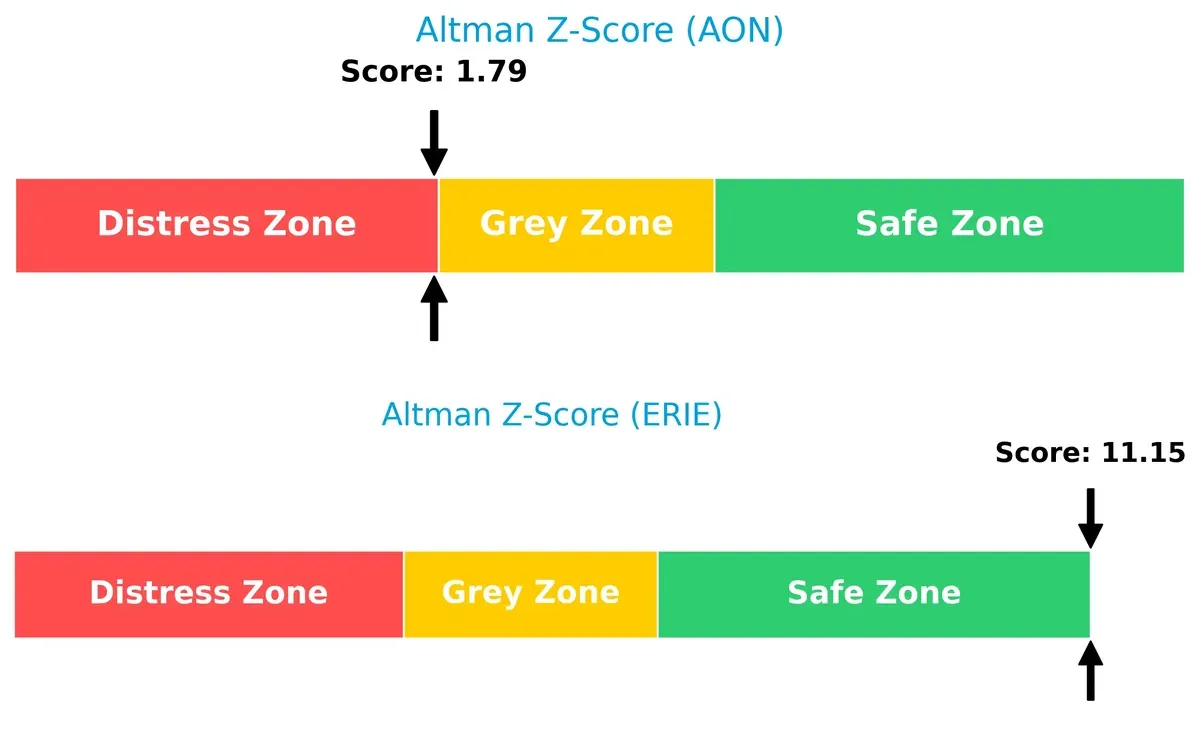
Bankruptcy Risk: Solvency Showdown
Erie Indemnity’s Altman Z-Score of 11.15 far surpasses Aon plc’s 1.79, placing Erie firmly in the safe zone versus Aon’s distress zone, signaling divergent long-term survival prospects:
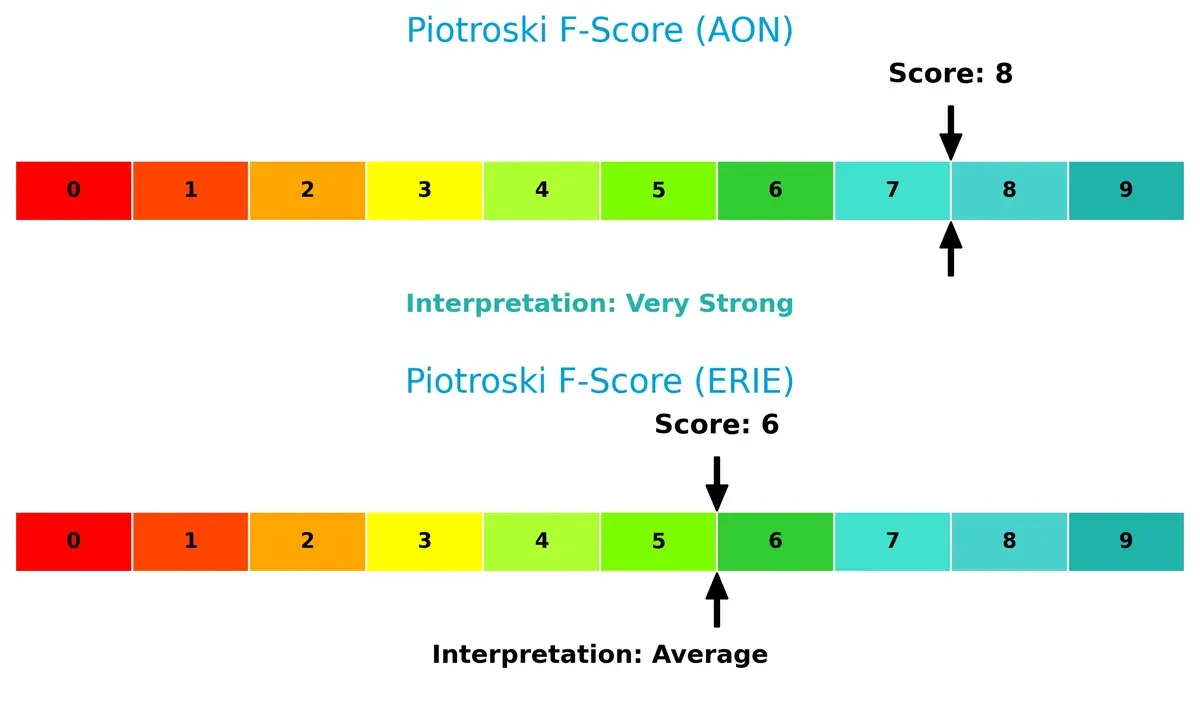
Financial Health: Quality of Operations
Aon plc boasts a very strong Piotroski F-Score of 8, outperforming Erie’s average score of 6, reflecting superior internal financial health and fewer red flags:
How are the two companies positioned?
This section dissects Aon and Erie’s operational DNA by comparing revenue distribution and internal dynamics. The goal is to confront their economic moats to reveal which model offers the most resilient competitive advantage today.
Revenue Segmentation: The Strategic Mix
This visual comparison dissects how Aon plc and Erie Indemnity Company diversify their income streams and reveals where their primary sector bets lie:
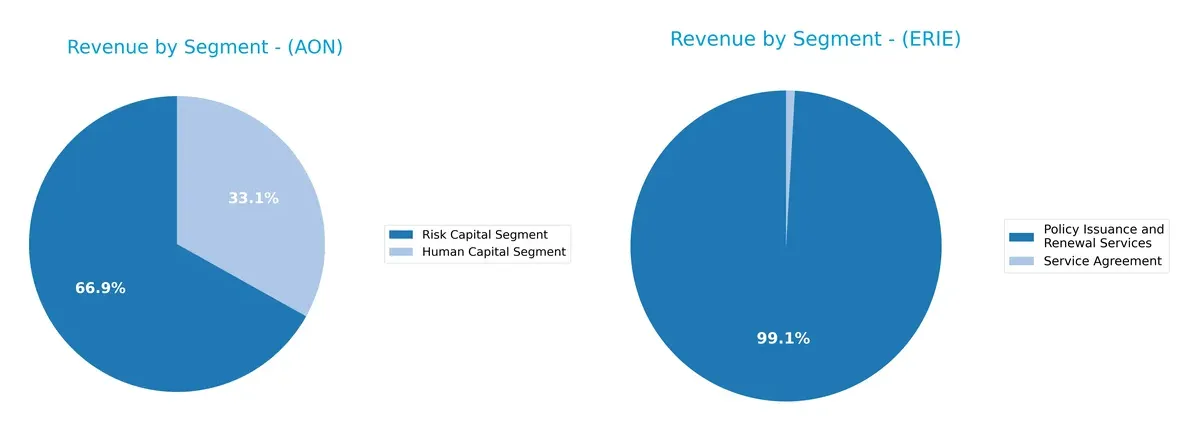
Aon exhibits a broader revenue mix with significant contributions from Commercial Risk Solutions ($7B), Health ($2.4B), Reinsurance ($2.5B), and Wealth Solutions ($1.4B). Erie Indemnity leans heavily on Policy Issuance and Renewal Services ($2.9B), overshadowing its minor Service Agreement segment ($26M). Aon’s diversified segments reduce concentration risk and enable ecosystem lock-in. Erie’s reliance on a single dominant segment signals potential vulnerability to market shifts in policy services.
Strengths and Weaknesses Comparison
This table compares the Strengths and Weaknesses of Aon plc and Erie Indemnity Company:
Aon plc Strengths
- Diversified revenue streams across multiple segments
- Favorable net margin at 21.51% and high ROE of 39.51%
- Global presence with strong revenue in US, UK, EMEA, and Asia Pacific
- Favorable fixed asset turnover of 12.46 indicating efficient asset use
Erie Indemnity Company Strengths
- High ROIC at 25.61% well above WACC at 5.55%
- Favorable low debt levels with D/E at 0 and strong interest coverage
- Strong asset turnover of 1.31 indicating efficient operations
- Favorable profitability with 15.82% net margin and 30.21% ROE
Aon plc Weaknesses
- High debt-to-equity ratio at 1.77 raises leverage concerns
- Unfavorable interest coverage ratio at -5.78 signals risk
- Asset turnover low at 0.34, showing less operational efficiency
- Price-to-book ratio at 8.15 is unfavorable, indicating possible overvaluation
Erie Indemnity Company Weaknesses
- Unfavorable high PE ratio at 31.72 may imply expensive valuation
- Price-to-book ratio also unfavorable at 9.58
- Dividend yield neutral at 1.25%, offering limited income appeal
Overall, Aon demonstrates broad diversification and global scale but faces some financial leverage and operational efficiency challenges. Erie shows strong capital efficiency and low leverage but carries valuation risks. These profiles reflect differing strategic focuses and risk exposures.
The Moat Duel: Analyzing Competitive Defensibility
A structural moat alone protects long-term profits from competitors’ encroachment in this fiercely contested insurance brokerage sector:
Aon plc: Global Scale Network Effects
Aon’s moat stems from vast network effects and diverse global reach. This drives a high ROIC of 6.3% above WACC and margin stability. Expansion in cyber and health solutions in 2026 could deepen this advantage.
Erie Indemnity Company: Focused Operational Efficiency
Erie’s moat relies on superior operational efficiency and underwriting discipline, reflected in a ROIC exceeding WACC by 20% and strong margin growth. Its regional footprint and concentrated service model offer nimble growth potential.
Network Effects vs. Operational Excellence
Erie’s moat is financially wider and trending sharply upward, signaling stronger value creation than Aon’s broader but more incremental gains. Erie appears better equipped to defend and grow market share amid evolving risks.
Which stock offers better returns?
The past year shows divergent trajectories for Aon plc and Erie Indemnity Company. Aon’s price gains decelerated recently, while Erie’s decline slowed but remained steep.
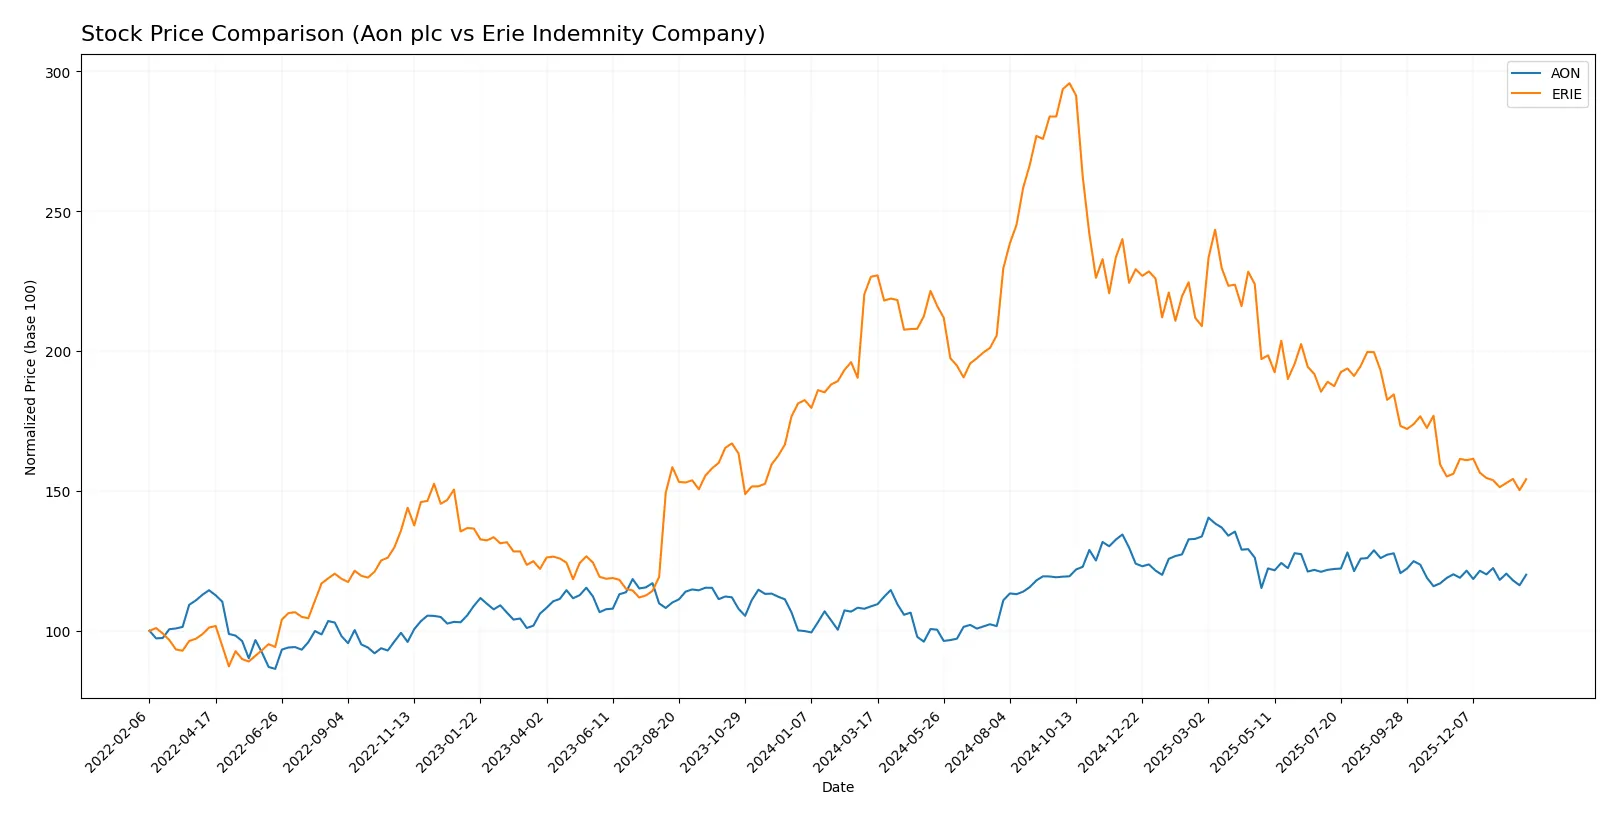
Trend Comparison
Aon’s stock rose 10.38% over the past 12 months, signaling a bullish trend with decelerating momentum. It ranged from a low of 280 to a high of 409, with moderate volatility (std dev 29.63).
Erie’s stock fell 31.95% over the same period, reflecting a bearish trend with deceleration. Price fluctuated widely between 276 and 543, showing elevated volatility (std dev 62.78).
Aon outperformed Erie by a wide margin, delivering positive returns versus Erie’s steep losses, making it the stronger performer during this timeframe.
Target Prices
Analysts set a moderate target consensus for Aon plc, indicating cautious optimism.
| Company | Target Low | Target High | Consensus |
|---|---|---|---|
| Aon plc | 381 | 448 | 403.75 |
Aon’s consensus target price of 403.75 suggests a potential upside of roughly 15.5% from the current 349.64. No verified target price data is available for Erie Indemnity Company.

Don’t Let Luck Decide Your Entry Point
Optimize your entry points with our advanced ProRealTime indicators. You’ll get efficient buy signals with precise price targets for maximum performance. Start outperforming now!
How do institutions grade them?
Below is a summary of recent institutional grades for Aon plc; no reliable grades are available for Erie Indemnity Company.
Aon plc Grades
This table shows Aon plc’s latest ratings from major grading firms:
| Grading Company | Action | New Grade | Date |
|---|---|---|---|
| Cantor Fitzgerald | maintain | Overweight | 2026-01-14 |
| Wells Fargo | maintain | Overweight | 2026-01-13 |
| Barclays | maintain | Equal Weight | 2026-01-08 |
| JP Morgan | maintain | Overweight | 2026-01-07 |
| Keefe, Bruyette & Woods | maintain | Outperform | 2026-01-06 |
| Barclays | downgrade | Equal Weight | 2025-11-20 |
| UBS | maintain | Neutral | 2025-11-10 |
| Keefe, Bruyette & Woods | maintain | Outperform | 2025-11-04 |
| TD Cowen | maintain | Buy | 2025-11-03 |
| Evercore ISI Group | maintain | Outperform | 2025-11-03 |
Which company has the best grades?
Aon plc holds multiple positive ratings such as Overweight and Outperform, reflecting institutional confidence. Erie Indemnity Company has no reported grades. Investors may view Aon’s grades as a sign of favorable market sentiment compared to Erie’s lack of data.
Risks specific to each company
The following categories identify the critical pressure points and systemic threats facing both firms in the 2026 market environment:
1. Market & Competition
Aon plc
- Faces intense competition in global risk and health advisory services, risking margin pressure.
Erie Indemnity Company
- Operates in a more regional market with less direct global competition but limited growth scope.
2. Capital Structure & Debt
Aon plc
- High debt-to-equity ratio (1.77) and negative interest coverage signal financial leverage risks.
Erie Indemnity Company
- Virtually no debt, very strong balance sheet with excellent interest coverage, reducing financial risk.
3. Stock Volatility
Aon plc
- Beta of 0.83 indicates moderate market sensitivity, exposing it to market swings.
Erie Indemnity Company
- Low beta of 0.37 shows defensive stock behavior, less prone to market volatility.
4. Regulatory & Legal
Aon plc
- Global operations expose it to diverse regulatory regimes and compliance risks.
Erie Indemnity Company
- US-focused operations limit regulatory complexity but subject to state insurance laws.
5. Supply Chain & Operations
Aon plc
- Complex global service delivery faces operational strain and integration risks.
Erie Indemnity Company
- Simpler operational model with fewer employees reduces operational complexity.
6. ESG & Climate Transition
Aon plc
- Global footprint increases exposure to ESG expectations and climate-related risks.
Erie Indemnity Company
- Smaller scale and regional focus may mitigate but also limit ESG investment capacity.
7. Geopolitical Exposure
Aon plc
- Significant exposure to geopolitical risks given multinational presence.
Erie Indemnity Company
- Primarily US-based, limiting direct geopolitical risk but sensitive to domestic policy shifts.
Which company shows a better risk-adjusted profile?
Erie Indemnity’s minimal debt and superior interest coverage drastically reduce financial risk. Aon’s leverage and operational complexity increase vulnerability despite strong market presence. Erie’s risk-adjusted profile appears more resilient in 2026’s uncertain environment. The Altman Z-Score divergence is a red flag: Aon teeters in distress, Erie in the safe zone. This signals heightened bankruptcy risk for Aon relative to Erie.
Final Verdict: Which stock to choose?
Aon plc’s superpower lies in its durable competitive advantage, demonstrated by a consistently growing ROIC well above its cost of capital. Its robust profitability and strong income growth position it as a cash machine. The point of vigilance is its elevated debt levels, which could pressure financial flexibility. Aon suits portfolios seeking aggressive growth with a tolerance for leverage risk.
Erie Indemnity Company boasts a strategic moat built on exceptional capital efficiency and a pristine balance sheet with virtually no debt. Its steady returns on invested capital and favorable safety metrics make it a fortress in volatile markets. Relative to Aon, Erie offers a more conservative profile, fitting well within GARP portfolios focused on stable, quality growth at a reasonable price.
If you prioritize aggressive growth powered by a high-return, well-established competitive edge, Aon is the compelling choice due to its superior profitability and cash flow generation. However, if you seek better stability and financial safety with a strong moat, Erie outshines by offering a cleaner balance sheet and consistent capital efficiency. Each appeals to distinct investor avatars, reflecting different risk tolerances and strategic goals.
Disclaimer: Investment carries a risk of loss of initial capital. The past performance is not a reliable indicator of future results. Be sure to understand risks before making an investment decision.
Go Further
I encourage you to read the complete analyses of Aon plc and Erie Indemnity Company to enhance your investment decisions: