Home > Comparison > Financial Services > AON vs BRO
The strategic rivalry between Aon plc and Brown & Brown, Inc. defines the competitive landscape of the insurance brokerage sector. Aon operates as a global professional services powerhouse, delivering risk, retirement, and health solutions with a capital-intensive model. Brown & Brown focuses on diversified retail and wholesale insurance brokerage across North America, emphasizing nimble, service-driven growth. This analysis aims to identify which firm offers the superior risk-adjusted trajectory for a balanced portfolio.

Table of contents
Companies Overview
Aon plc and Brown & Brown, Inc. dominate the insurance brokerage market with distinct scales and strategies.
Aon plc: Global Risk and Health Solutions Leader
Aon plc stands as a global professional services firm specializing in risk, retirement, and health solutions. Its core revenue comes from commercial risk brokerage, reinsurance, and strategic advisory services. In 2026, Aon focuses on expanding its digital capabilities and integrated risk solutions to enhance client value worldwide.
Brown & Brown, Inc.: Diversified Insurance Brokerage Specialist
Brown & Brown operates primarily in the U.S. and select international markets as a multi-segment insurance broker. It generates revenue through retail insurance, national programs, wholesale brokerage, and claims services. The company’s 2026 strategy emphasizes broadening its specialty insurance offerings and strengthening partnerships with independent agents.
Strategic Collision: Similarities & Divergences
Both companies emphasize insurance brokerage but differ in approach: Aon pursues a comprehensive, integrated global platform, while Brown & Brown relies on a decentralized, multi-segment U.S.-focused model. The primary battleground is specialty and commercial insurance markets. Their distinct scales and operational models create unique risk and growth profiles for investors to consider.
Income Statement Comparison
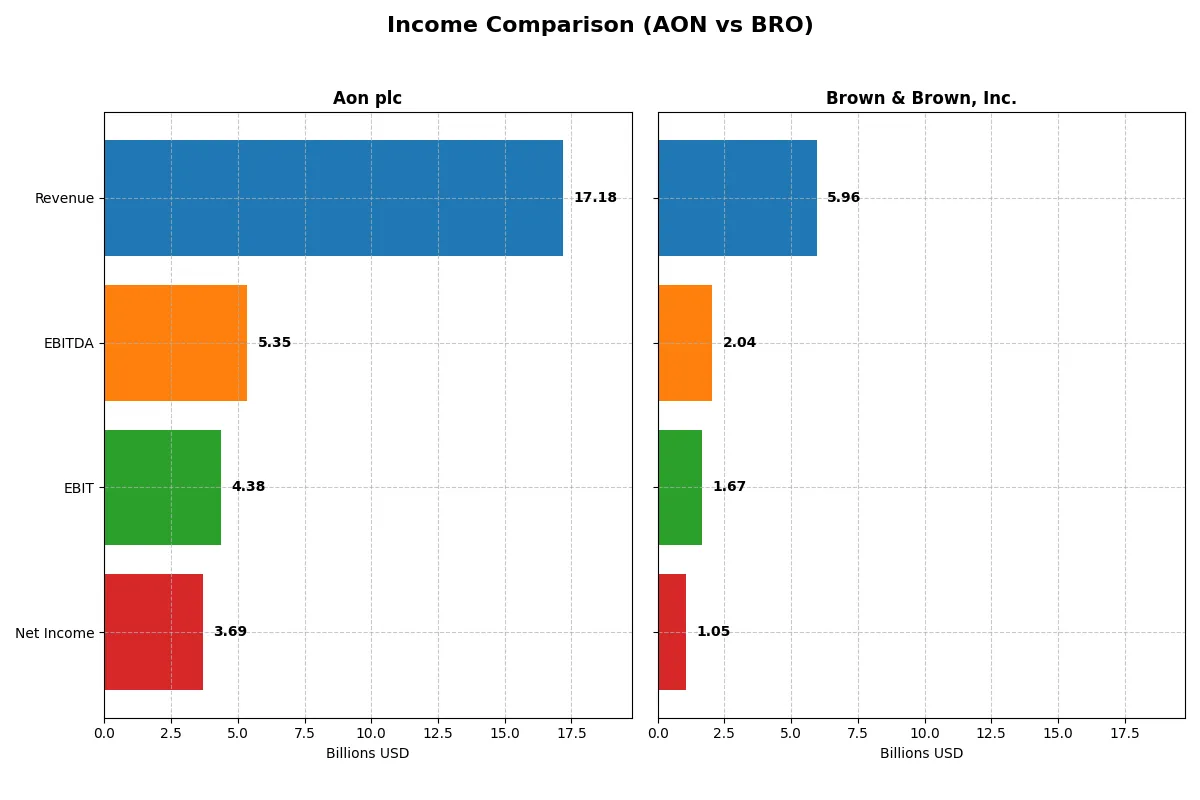
This data dissects the core profitability and scalability of both corporate engines to reveal who dominates the bottom line:
| Metric | Aon plc (AON) | Brown & Brown, Inc. (BRO) |
|---|---|---|
| Revenue | 17.2B | 5.96B |
| Cost of Revenue | 8.99B | 734M |
| Operating Expenses | 3.85B | 3.53B |
| Gross Profit | 8.20B | 5.22B |
| EBITDA | 5.35B | 2.04B |
| EBIT | 4.38B | 1.67B |
| Interest Expense | 815M | 297M |
| Net Income | 3.70B | 1.05B |
| EPS | 17.13 | 3.40 |
| Fiscal Year | 2025 | 2025 |
Income Statement Analysis: The Bottom-Line Duel
This income statement comparison reveals the true efficiency and profitability of each company’s business engine over recent years.
Aon plc Analysis
Aon’s revenue climbed steadily from 12.2B in 2021 to 17.2B in 2025, with net income surging from 1.3B to 3.7B. Its gross margin holds firm near 48%, while net margin expanded impressively to 21.5%. The 2025 results show strong operational control and margin expansion, evidencing solid momentum and cost discipline.
Brown & Brown, Inc. Analysis
Brown & Brown nearly doubled revenue from 3B in 2021 to 6B in 2025, with net income rising from 0.57B to 1.05B. The firm boasts an exceptional gross margin above 87%, with an EBIT margin of 28%. However, net margin slipped to 17.7% in 2025 amid rising operating expenses, signaling some margin pressure despite top-line strength.
Margin Excellence vs. Revenue Power
Aon delivers superior net margin growth and consistent profitability improvement, driven by balanced revenue growth and cost efficiency. Brown & Brown leads in gross and EBIT margins but faces net margin compression from higher operating expenses. For investors, Aon’s profile offers a more attractive blend of expanding profits and margin resilience.
Financial Ratios Comparison
These vital ratios act as a diagnostic tool to expose the underlying fiscal health, valuation premiums, and capital efficiency of the following companies:
| Ratios | Aon plc (AON) | Brown & Brown, Inc. (BRO) |
|---|---|---|
| ROE | 39.5% | 8.4% |
| ROIC | 12.2% | 5.9% |
| P/E | 20.5 | 23.4 |
| P/B | 8.12 | 1.97 |
| Current Ratio | 1.11 | 1.04 |
| Quick Ratio | 1.11 | 1.04 |
| D/E | 1.77 | 0.64 |
| Debt-to-Assets | 32.6% | 27.0% |
| Interest Coverage | 5.33 | 5.71 |
| Asset Turnover | 0.34 | 0.20 |
| Fixed Asset Turnover | 12.5 | 9.36 |
| Payout ratio | 17.0% | 18.4% |
| Dividend yield | 0.83% | 0.79% |
| Fiscal Year | 2025 | 2025 |
Efficiency & Valuation Duel: The Vital Signs
Financial ratios serve as a company’s DNA, exposing hidden risks and operational strengths critical for informed investment decisions.
Aon plc
Aon posts a robust 39.5% ROE and a strong 21.5% net margin, signaling high profitability. Its P/E of 20.5 is fairly valued, while a high P/B of 8.1 flags potential overvaluation. The company returns 0.83% in dividends, balancing shareholder rewards with reinvestment in growth and capital efficiency.
Brown & Brown, Inc.
Brown & Brown shows a modest 8.4% ROE and a 17.7% net margin, indicating moderate profitability. The stock trades at a neutral P/E of 23.4 and a reasonable P/B of 1.97, suggesting fair valuation. Dividend yield stands at 0.79%, reflecting cautious shareholder returns amid steady operational focus.
Premium Valuation vs. Operational Safety
Aon delivers exceptional profitability but carries valuation risks with a stretched P/B ratio. Brown & Brown offers a steadier valuation and safer leverage profile but lags in return metrics. Investors seeking growth at a premium may prefer Aon; those favoring valuation discipline might lean toward Brown & Brown.
Which one offers the Superior Shareholder Reward?
I compare Aon plc and Brown & Brown, Inc. on dividend yield, payout ratio, and buyback intensity to gauge shareholder reward. Aon yields ~0.83% with a 17% payout ratio, indicating conservative dividend coverage and robust free cash flow (~0.92 FCF/OCF). Brown & Brown yields slightly less at ~0.79%, with an 18% payout ratio, also backed by strong FCF coverage (~0.95). Both firms sustain dividends well, but Aon’s higher payout and yield edge out slightly. Buyback activity is critical; Aon’s high financial leverage (debt/equity ~1.77) may constrain repurchases, while Brown & Brown operates with moderate leverage (debt/equity ~0.64), enabling more aggressive buybacks. Historically, I’ve observed that firms with balanced leverage and sustainable payouts amplify total return better. In 2026, Brown & Brown’s prudent capital structure and consistent buybacks offer a superior total shareholder return profile despite a marginally lower yield.
Comparative Score Analysis: The Strategic Profile
The radar chart reveals the fundamental DNA and trade-offs of Aon plc and Brown & Brown, Inc., highlighting key financial dimensions and competitive approaches:
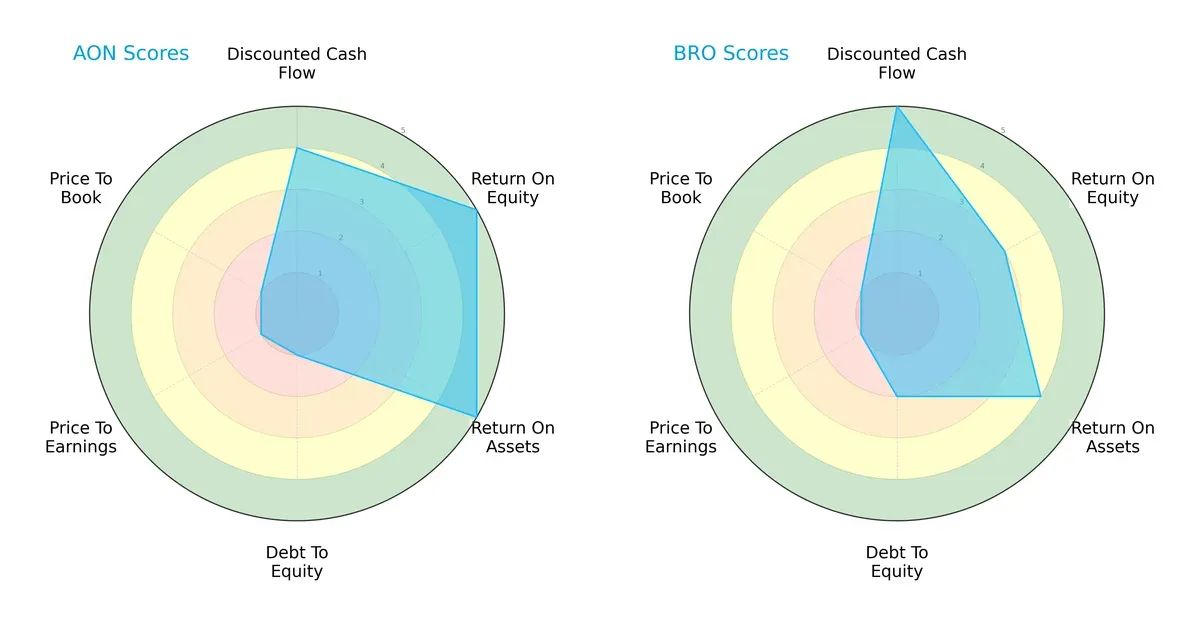
Aon excels in profitability metrics with top ROE and ROA scores (5 each), showcasing operational efficiency. Brown & Brown leads in discounted cash flow (5 vs. 4), indicating stronger future cash flow projections. However, both suffer from poor valuation scores (P/E and P/B at 1), suggesting overvaluation concerns. Aon’s balance sheet risk is higher, reflected by a weaker debt-to-equity score (1 vs. 2). Overall, Aon relies on superior profitability, while Brown & Brown offers a more balanced financial profile.
Bankruptcy Risk: Solvency Showdown
The Altman Z-Scores place both firms in the distress zone, signaling elevated bankruptcy risk in this cycle:
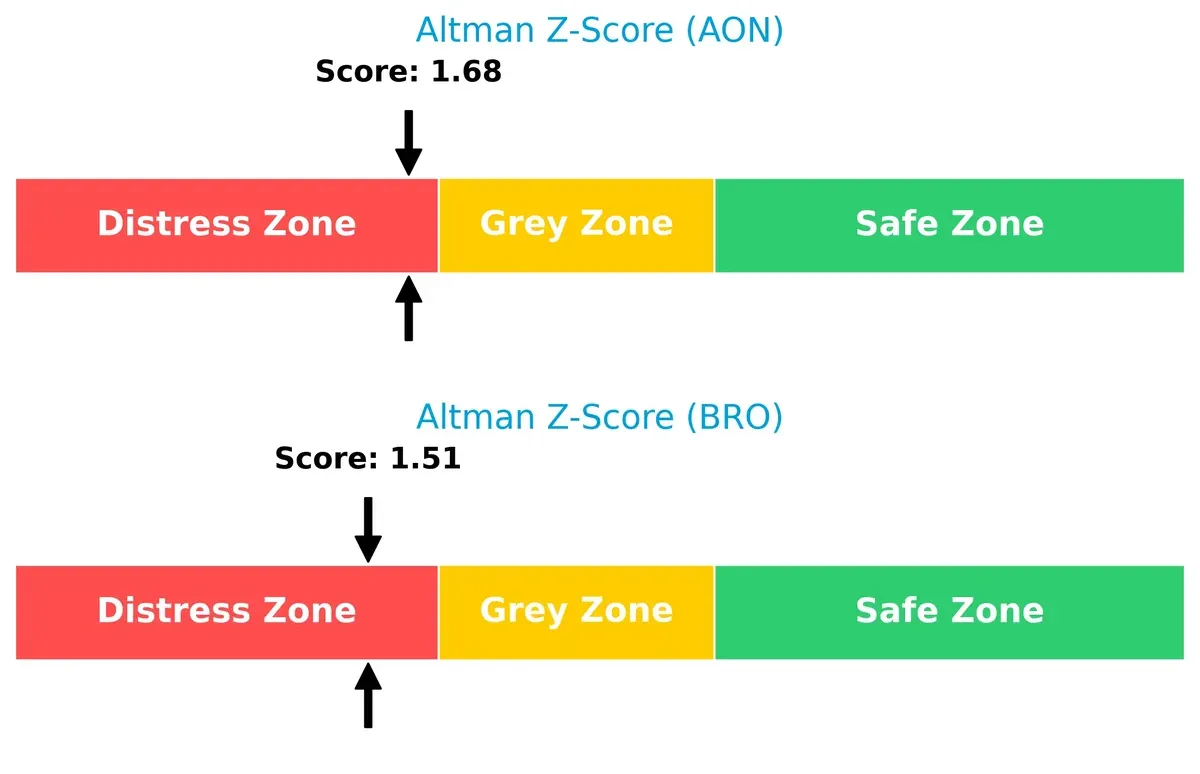
Aon’s score of 1.68 slightly outperforms Brown & Brown’s 1.51, but both remain below the 1.8 threshold. This warns investors to approach with caution, as neither company currently exhibits strong solvency in the face of economic stress.
Financial Health: Quality of Operations
Aon shows a very strong Piotroski F-Score of 8, while Brown & Brown scores a moderate 5, revealing differences in operational quality and financial strength:
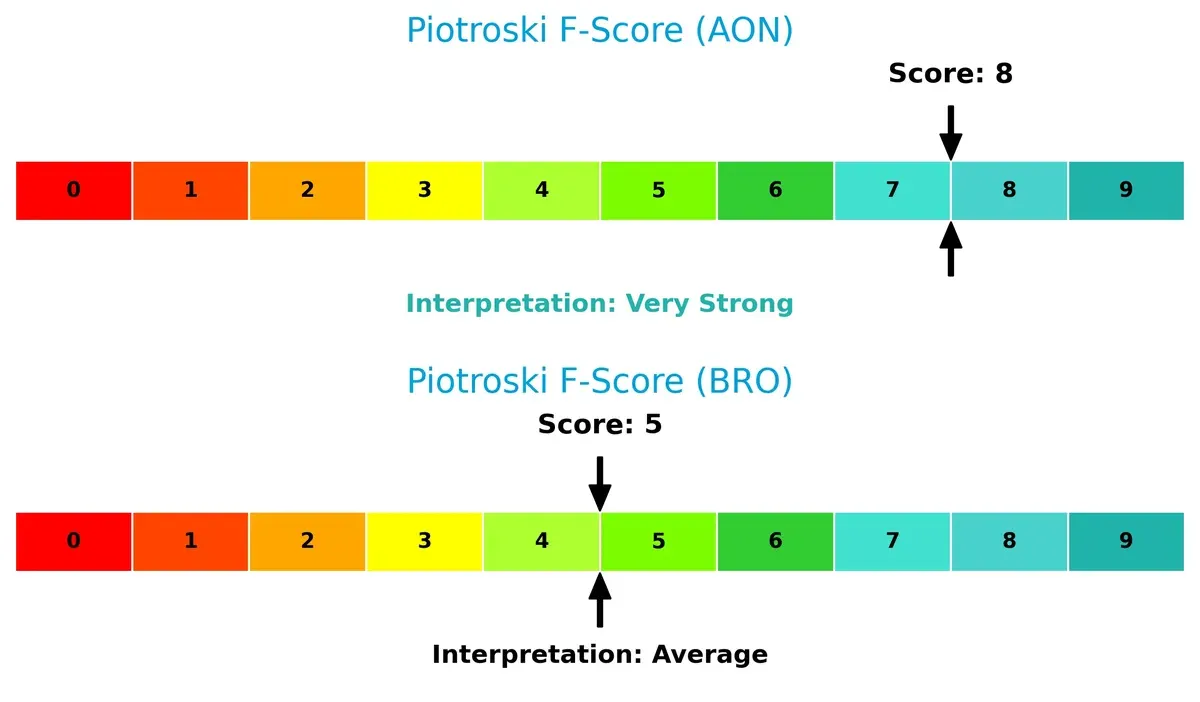
Aon’s high score indicates robust profitability, liquidity, and leverage management, signaling peak financial health. Brown & Brown’s average score suggests potential red flags or operational inefficiencies that investors should monitor closely.
How are the two companies positioned?
This section dissects Aon and Brown & Brown’s operational DNA by analyzing revenue distribution and internal strengths and weaknesses. The goal is to confront their economic moats and reveal which model delivers a more resilient competitive advantage today.
Revenue Segmentation: The Strategic Mix
This visual comparison dissects how Aon plc and Brown & Brown, Inc. diversify income streams and where their primary sector bets lie:
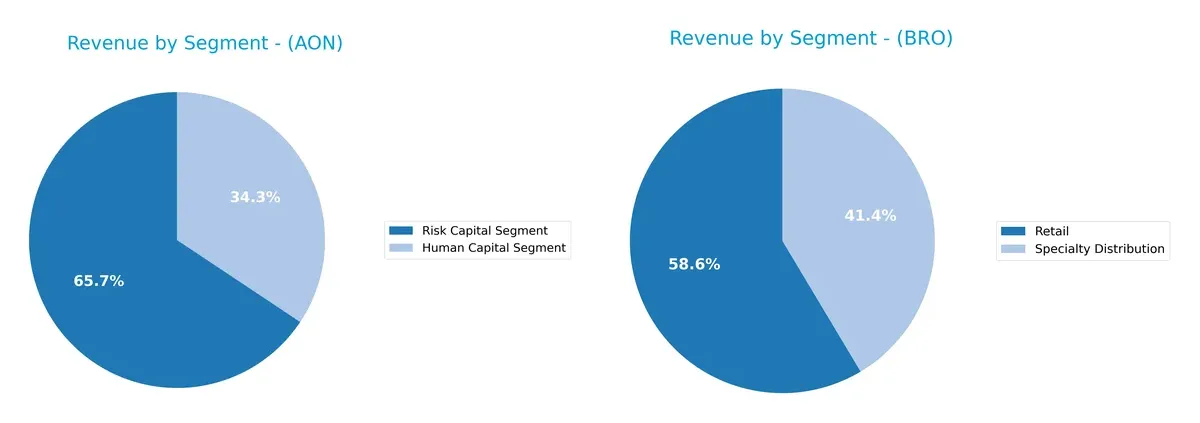
Aon anchors its revenue in two dominant segments: Risk Capital ($11.3B) and Human Capital ($5.9B) in 2025, showing a focused yet balanced portfolio. Brown & Brown relies more evenly on Retail ($3.4B) and Specialty Distribution ($2.4B), reflecting a broader diversification. Aon’s concentration signals strong ecosystem lock-in in risk solutions. Brown & Brown’s spread reduces concentration risk but may lack the infrastructure dominance Aon wields.
Strengths and Weaknesses Comparison
This table compares the strengths and weaknesses of Aon plc and Brown & Brown, Inc.:
Aon plc Strengths
- Strong profitability with 21.5% net margin
- High ROE at 39.5%
- Diversified revenue across multiple segments
- Solid global presence with $8.3B US revenue
- Favorable ROIC vs. WACC spread
- Robust interest coverage ratio
Brown & Brown Strengths
- Favorable net margin at 17.7%
- Lower debt-to-assets ratio at 27%
- Favorable interest coverage ratio
- Steady revenue from Specialty Distribution and Retail
- Neutral valuation multiples
- Geographic focus with $5.1B US revenue
Aon plc Weaknesses
- High debt-equity ratio at 1.77
- Elevated price-to-book at 8.12 signals premium valuation
- Asset turnover low at 0.34
- Dividend yield below 1%
- Moderate current ratio at 1.11
- Some segments less transparent
Brown & Brown Weaknesses
- Low ROE at 8.4%
- Lower ROIC at 5.9% close to WACC
- Asset turnover weak at 0.20
- Dividend yield under 1%
- Limited geographic diversification outside US and UK
- Smaller scale in global markets
Aon demonstrates superior profitability and global diversification, supported by a wide product mix. Brown & Brown shows financial conservatism with lower leverage but weaker returns. Both face challenges in asset efficiency and dividend yield, which may impact capital allocation decisions.
The Moat Duel: Analyzing Competitive Defensibility
A structural moat is the only reliable shield protecting long-term profits from relentless competitive erosion:
Aon plc: Network Effects and Intangible Assets Moat
Aon leverages strong network effects and rich intangible assets, reflected in its 5.4% ROIC premium over WACC and stable 25.5% EBIT margins. Expansion into cyber and global consulting deepens its moat in 2026.
Brown & Brown, Inc.: Cost Advantage with Narrow Moat
Brown & Brown relies on a cost advantage in wholesale brokerage but shows a declining ROIC trend and shrinking margins, signaling a weakening moat. Growth in niche insurance programs offers upside but limited scale impact.
Moat Battle: Sustainable Network Effects vs. Cost-Driven Vulnerability
Aon’s widening ROIC and high-margin business create a deeper, more sustainable moat than Brown & Brown’s contracting returns. Aon stands better poised to defend and grow its market share amid intensifying competition.
Which stock offers better returns?
The past year reveals contrasting price dynamics for Aon plc and Brown & Brown, Inc., with both stocks exhibiting bearish trends but differing in volatility and recent momentum.
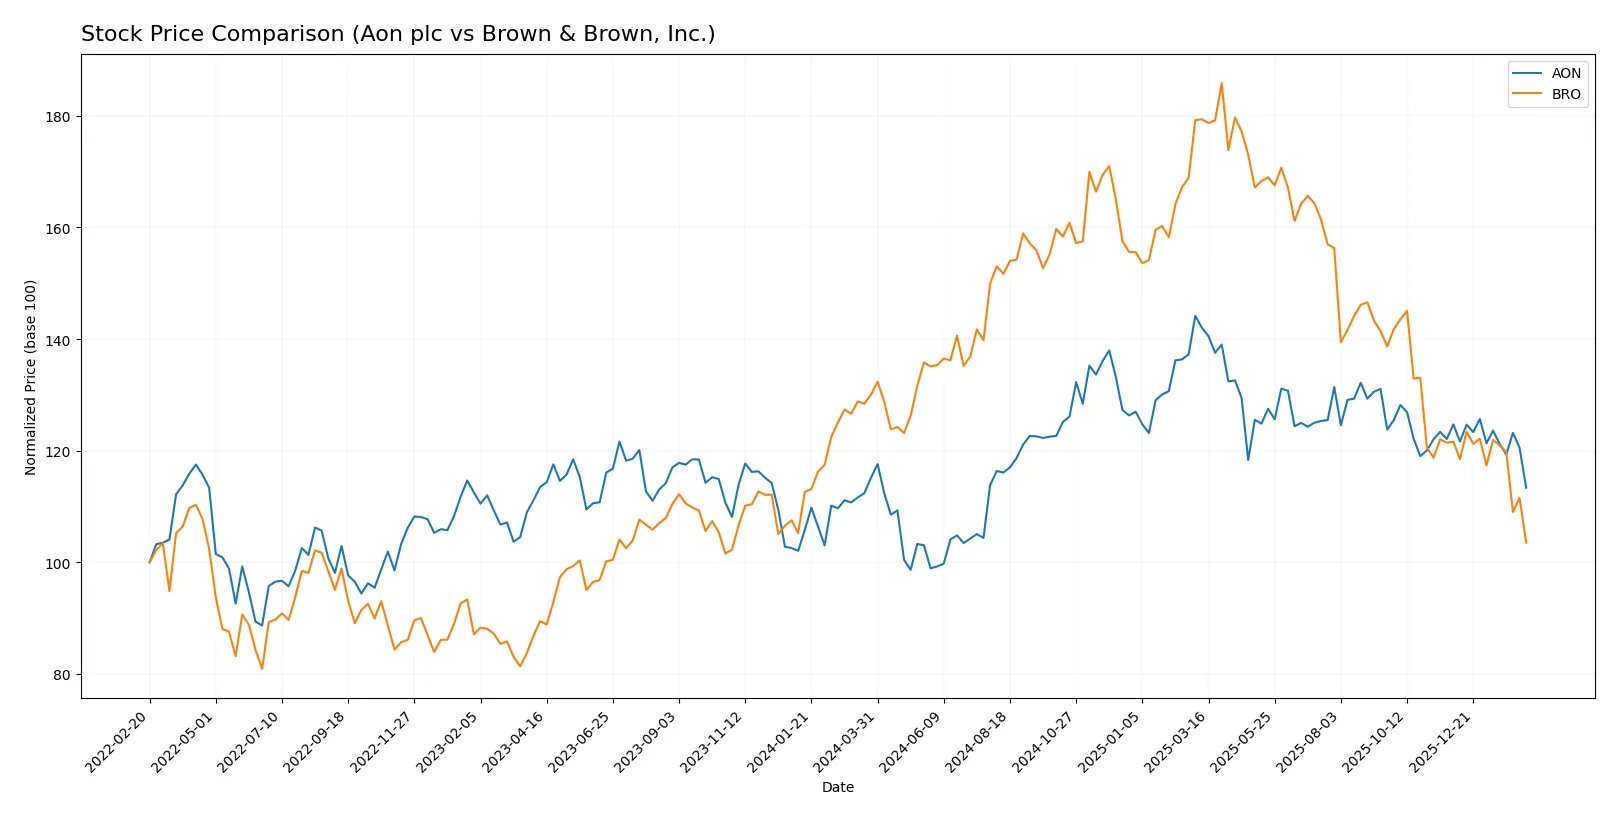
Trend Comparison
Aon plc’s stock declined modestly by 1.56% over the past year, marking a bearish trend with decelerating momentum. Price volatility remains high, fluctuating between 280 and 409.
Brown & Brown’s stock fell sharply by 20.38% in the same period, reflecting a stronger bearish trend with deceleration. The price ranged from a low of 68 to a peak near 123, showing moderate volatility.
Brown & Brown experienced a significantly larger drop than Aon, delivering the weakest market performance of the two over the past year.
Target Prices
Analysts present a bullish consensus on Aon plc and Brown & Brown, Inc., signaling solid upside potential.
| Company | Target Low | Target High | Consensus |
|---|---|---|---|
| Aon plc | 381 | 443 | 404.8 |
| Brown & Brown, Inc. | 88 | 89 | 88.5 |
Aon’s consensus target exceeds its current price of 322 by about 26%, indicating strong growth expectations. Brown & Brown’s target at 88.5 suggests a 29% upside from its current 68.5 price, reflecting robust analyst confidence.

Don’t Let Luck Decide Your Entry Point
Optimize your entry points with our advanced ProRealTime indicators. You’ll get efficient buy signals with precise price targets for maximum performance. Start outperforming now!
How do institutions grade them?
The following tables summarize recent institutional grades for Aon plc and Brown & Brown, Inc.:
Aon plc Grades
This table lists the latest grades and actions from major institutional analysts.
| Grading Company | Action | New Grade | Date |
|---|---|---|---|
| Citigroup | Maintain | Buy | 2026-02-03 |
| Cantor Fitzgerald | Maintain | Overweight | 2026-02-02 |
| Wells Fargo | Maintain | Overweight | 2026-02-02 |
| Cantor Fitzgerald | Maintain | Overweight | 2026-01-14 |
| Wells Fargo | Maintain | Overweight | 2026-01-13 |
| Barclays | Maintain | Equal Weight | 2026-01-08 |
| JP Morgan | Maintain | Overweight | 2026-01-07 |
| Keefe, Bruyette & Woods | Maintain | Outperform | 2026-01-06 |
| Barclays | Downgrade | Equal Weight | 2025-11-20 |
| UBS | Maintain | Neutral | 2025-11-10 |
Brown & Brown, Inc. Grades
This table presents recent institutional grades and rating changes for Brown & Brown.
| Grading Company | Action | New Grade | Date |
|---|---|---|---|
| UBS | Maintain | Neutral | 2026-01-29 |
| Keefe, Bruyette & Woods | Upgrade | Market Perform | 2026-01-29 |
| Morgan Stanley | Maintain | Equal Weight | 2026-01-29 |
| BMO Capital | Maintain | Market Perform | 2026-01-29 |
| Mizuho | Maintain | Neutral | 2026-01-28 |
| Jefferies | Maintain | Hold | 2026-01-28 |
| Citigroup | Downgrade | Neutral | 2026-01-28 |
| Wells Fargo | Maintain | Equal Weight | 2026-01-28 |
| Truist Securities | Maintain | Buy | 2026-01-28 |
| B of A Securities | Maintain | Neutral | 2026-01-27 |
Which company has the best grades?
Aon plc consistently holds stronger grades, including multiple “Buy,” “Overweight,” and “Outperform” ratings. Brown & Brown mostly receives neutral or market perform grades, with fewer buy recommendations. This suggests Aon is viewed more favorably by analysts, which could influence investor confidence and valuation.
Risks specific to each company
The following categories identify the critical pressure points and systemic threats facing both firms in the 2026 market environment:
1. Market & Competition
Aon plc
- Dominates global risk and health consulting with strong brand and scale advantages.
Brown & Brown, Inc.
- Focuses on U.S. and select international markets with diversified insurance segments but smaller scale.
2. Capital Structure & Debt
Aon plc
- Debt-to-equity ratio of 1.77 signals high leverage and financial risk.
Brown & Brown, Inc.
- More conservative leverage with debt-to-equity at 0.64, strengthening balance sheet resilience.
3. Stock Volatility
Aon plc
- Beta at 0.814 suggests moderate sensitivity to market swings.
Brown & Brown, Inc.
- Slightly lower beta of 0.786 implies marginally less stock volatility.
4. Regulatory & Legal
Aon plc
- Global footprint exposes it to complex regulatory regimes and compliance costs.
Brown & Brown, Inc.
- Primarily U.S.-focused, facing more concentrated but familiar regulatory challenges.
5. Supply Chain & Operations
Aon plc
- Large scale operations benefit from diversified service offerings but increase complexity risk.
Brown & Brown, Inc.
- Operational efficiency benefits from focused segments but less diversified risk exposure.
6. ESG & Climate Transition
Aon plc
- Increasing ESG commitments required due to global operations and investor scrutiny.
Brown & Brown, Inc.
- ESG pressures growing but currently less exposed due to smaller international presence.
7. Geopolitical Exposure
Aon plc
- Significant exposure to global geopolitical risks given multinational operations.
Brown & Brown, Inc.
- Limited geopolitical risk due to concentrated U.S. and select regional markets.
Which company shows a better risk-adjusted profile?
Aon’s highest risk is its elevated leverage, which threatens financial stability despite strong operational performance. Brown & Brown’s key risk is limited scale and growth prospects in a competitive market. Brown & Brown’s conservative capital structure offers a safer risk-adjusted profile. Notably, Aon’s Altman Z-score places it in the distress zone, reinforcing concerns about its debt.
Final Verdict: Which stock to choose?
Aon plc’s superpower lies in its robust value creation and growing profitability, signaling a durable competitive advantage. Its point of vigilance is the relatively high leverage, which could strain financial flexibility in volatile markets. Aon suits portfolios aiming for aggressive growth with a focus on sustained value creation.
Brown & Brown, Inc. benefits from a strategic moat in its recurring revenue streams and efficient capital management. It offers a safer profile than Aon, with lower leverage and steadier cash flow generation. This makes Brown & Brown a fit for investors seeking growth at a reasonable price with enhanced stability.
If you prioritize sustainable competitive advantage and strong profitability growth, Aon outshines with its superior ROIC and expanding margins. However, if you seek a more conservative growth approach with less financial risk, Brown & Brown offers better stability despite its weaker moat. Both present distinct scenarios depending on your risk appetite and investment horizon.
Disclaimer: Investment carries a risk of loss of initial capital. The past performance is not a reliable indicator of future results. Be sure to understand risks before making an investment decision.
Go Further
I encourage you to read the complete analyses of Aon plc and Brown & Brown, Inc. to enhance your investment decisions: