Home > Comparison > Financial Services > AON vs AJG
The strategic rivalry between Aon plc and Arthur J. Gallagher & Co. underpins the dynamics of the insurance brokerage sector. Aon, a global professional services leader, emphasizes risk, retirement, and health solutions worldwide. In contrast, Arthur J. Gallagher operates as a diversified insurance broker with strong risk management and claims administration capabilities. This analysis will assess which company’s operational model delivers superior risk-adjusted returns for a diversified portfolio in 2026.

Table of contents
Companies Overview
Aon plc and Arthur J. Gallagher & Co. stand as influential leaders in the global insurance brokerage market.
Aon plc: Global Risk and Health Solutions Leader
Aon plc dominates as a professional services firm specializing in commercial risk, health, and retirement solutions. It generates revenue through retail brokerage, global risk consulting, reinsurance, and strategic advisory services. In 2026, Aon sharpened its focus on expanding cyber risk and health benefits platforms, aiming to integrate advanced analytics into client offerings.
Arthur J. Gallagher & Co.: Diversified Insurance Brokerage Powerhouse
Arthur J. Gallagher & Co. excels as a broad insurance broker with strong footholds in retail and wholesale markets. Its core income derives from brokerage, consulting, claims settlement, and risk management services across multiple continents. In 2026, the company emphasized growth through specialized insurance placements and enhancing claims administration efficiency.
Strategic Collision: Similarities & Divergences
Both firms operate within insurance brokerage but diverge in approach: Aon pursues an integrated, analytics-driven model while Gallagher focuses on diversified brokerage and claims services. Their primary competition centers on capturing commercial and specialty insurance clients globally. Investors should note Aon’s tech-forward scalability versus Gallagher’s operational breadth and strong regional networks.
Income Statement Comparison
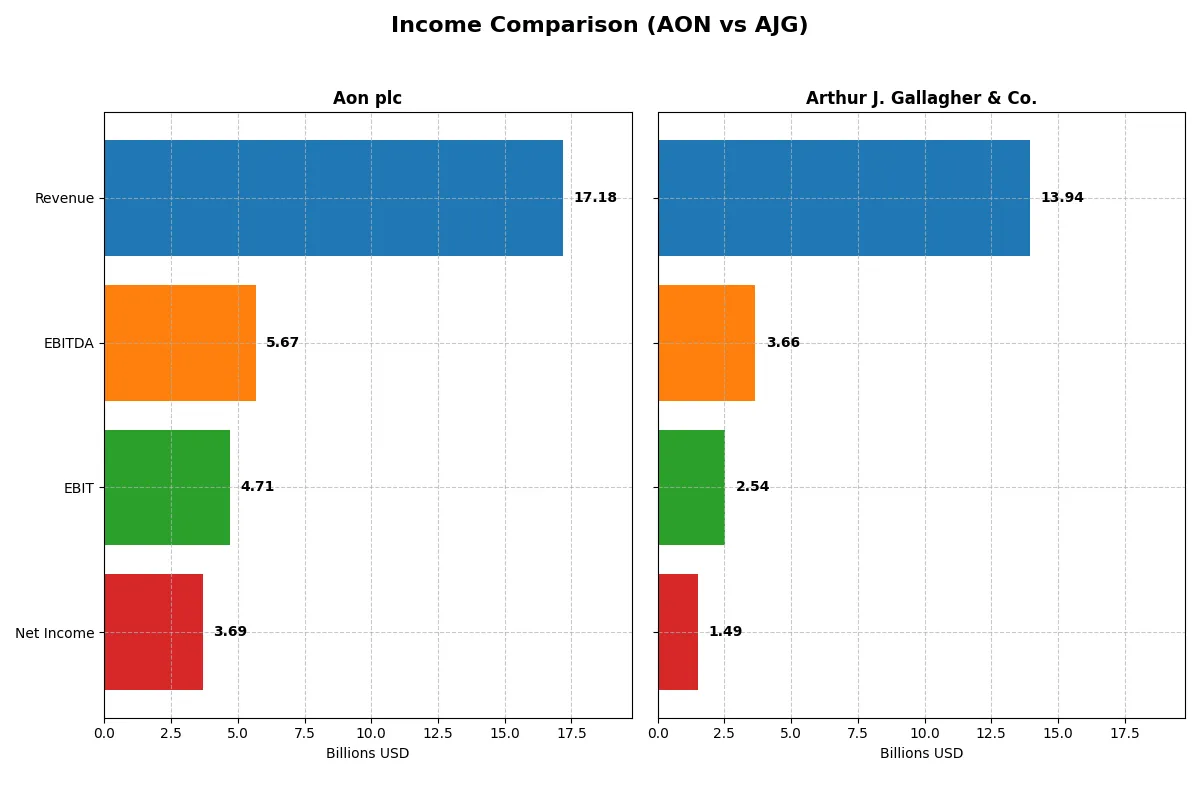
This data dissects the core profitability and scalability of both corporate engines to reveal who dominates the bottom line:
| Metric | Aon plc (AON) | Arthur J. Gallagher & Co. (AJG) |
|---|---|---|
| Revenue | 17.2B | 13.9B |
| Cost of Revenue | 8.99B | 6.31B |
| Operating Expenses | 12.8B | 5.08B |
| Gross Profit | 8.20B | 7.63B |
| EBITDA | 5.68B | 3.66B |
| EBIT | 4.71B | 2.54B |
| Interest Expense | 815M | 639M |
| Net Income | 3.70B | 1.49B |
| EPS | 17.11 | 5.83 |
| Fiscal Year | 2025 | 2025 |
Income Statement Analysis: The Bottom-Line Duel
This income statement comparison reveals which company drives superior profitability and operational efficiency in a competitive landscape.
Aon plc Analysis
Aon’s revenue surged from $12.2B in 2021 to $17.2B in 2025, reflecting strong top-line momentum. Net income more than doubled, reaching $3.7B in 2025. Gross margin stays robust at 47.7%, while net margin expanded impressively to 21.5%. The 2025 figures highlight Aon’s efficient cost control and accelerating earnings per share growth.
Arthur J. Gallagher & Co. Analysis
Arthur J. Gallagher’s revenue rose 70% from $8.2B in 2021 to $13.9B in 2025, showing rapid expansion. However, net income growth was more modest at 65%, reaching $1.5B. The company boasts a stronger gross margin of 54.7% but trails with a lower net margin of 10.7%. Recent earnings per share declined, signaling margin pressure despite top-line gains.
Margin Power vs. Revenue Scale
Aon leads with superior net margin and earnings growth, demonstrating stronger profitability and operational discipline. Gallagher excels in gross margin and revenue growth but struggles to convert sales into bottom-line profits as effectively. For investors prioritizing sustainable earnings and margin expansion, Aon’s profile offers clearer fundamental strength.
Financial Ratios Comparison
These vital ratios act as a diagnostic tool to expose the underlying fiscal health, valuation premiums, and capital efficiency for each company:
| Ratios | Aon plc (AON) | Arthur J. Gallagher & Co. (AJG) |
|---|---|---|
| ROE | 39.5% | 0% |
| ROIC | 13.2% | 0% |
| P/E | 20.6 | 45.1 |
| P/B | 8.15 | 0 |
| Current Ratio | 1.11 | 0 |
| Quick Ratio | 1.11 | 0 |
| D/E (Debt-to-Equity) | 1.77 | 0 |
| Debt-to-Assets | 32.6% | 0 |
| Interest Coverage | -5.78 | 3.99 |
| Asset Turnover | 0.34 | 0 |
| Fixed Asset Turnover | 12.5 | 0 |
| Payout Ratio | 17.0% | 45.3% |
| Dividend Yield | 0.83% | 1.00% |
| Fiscal Year | 2025 | 2025 |
Efficiency & Valuation Duel: The Vital Signs
Financial ratios act as a company’s DNA, unveiling hidden risks and operational excellence within its performance and valuation framework.
Aon plc
Aon demonstrates strong profitability with a 39.5% ROE and a robust 21.5% net margin, signaling operational efficiency. Its P/E ratio of 20.6 appears fairly valued, though a high P/B at 8.15 signals some premium pricing. The company delivers modest 0.83% dividends, supporting shareholders while balancing growth and capital allocation.
Arthur J. Gallagher & Co.
Arthur J. Gallagher suffers from weak profitability markers, with zero ROE and ROIC, despite a favorable net margin of 10.7%. Its P/E ratio is stretched at 45.1, suggesting overvaluation. The firm’s dividend yield stands at 1.0%, but underlying financial ratios signal operational challenges and elevated risk levels.
Premium Valuation vs. Operational Safety
Aon offers a better balance of profitability and valuation, reflecting operational strength despite some premium multiples. Conversely, Gallagher’s stretched valuation and lack of profitability pose greater risks. Investors favoring stable returns and efficiency should lean toward Aon, while risk-tolerant profiles might consider Gallagher’s growth potential.
Which one offers the Superior Shareholder Reward?
I compare Aon plc and Arthur J. Gallagher & Co. on dividend yield, payout ratios, and buyback intensity. Aon delivers a 0.83% dividend yield with a conservative 17% payout ratio and robust 14.9 FCF/share supporting distributions. AJG offers a higher 1.0% yield but with a 45% payout ratio and lower free cash flow visibility. Aon’s consistent buybacks and strong free cash flow coverage suggest a more sustainable shareholder return model. AJG’s higher payout ratio signals riskier distribution amid lower operating margins. I conclude Aon offers the superior total return profile for long-term investors in 2026.
Comparative Score Analysis: The Strategic Profile
The radar chart reveals the fundamental DNA and trade-offs of both firms, highlighting their distinct financial strengths and weaknesses:
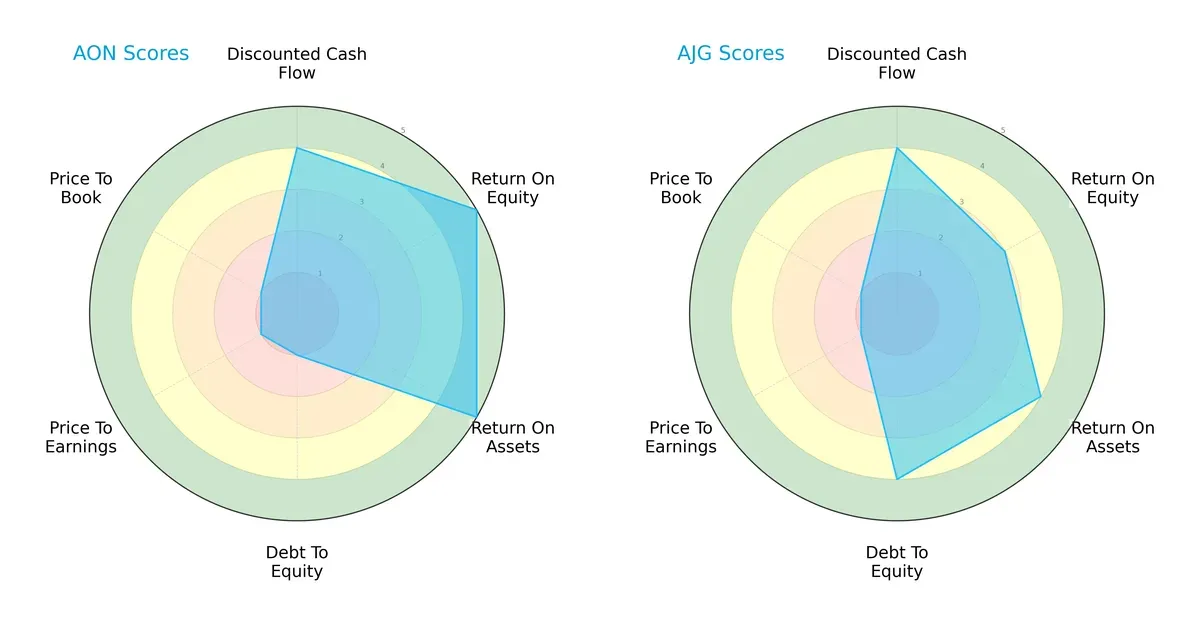
Aon plc excels in profitability metrics with top scores in ROE (5) and ROA (5), signaling superior asset and equity efficiency. Arthur J. Gallagher & Co. shows stronger financial stability with a healthier debt-to-equity score (4). Both share favorable DCF scores (4), but both are poorly rated on valuation metrics (PE and PB at 1). Aon relies on profitability dominance, while Gallagher offers a more balanced risk profile.
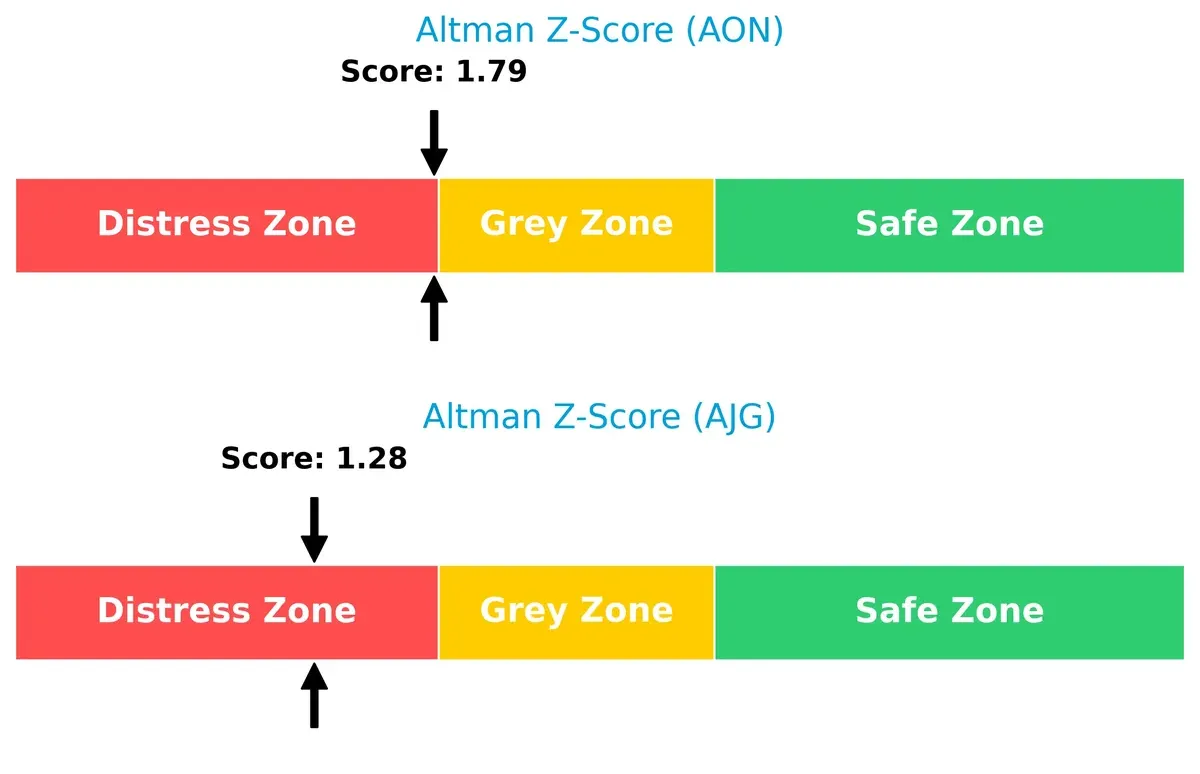
Bankruptcy Risk: Solvency Showdown
Aon’s Altman Z-Score of 1.79 slightly edges out Gallagher’s 1.28, but both reside in the distress zone, signaling elevated bankruptcy risk in this cycle:
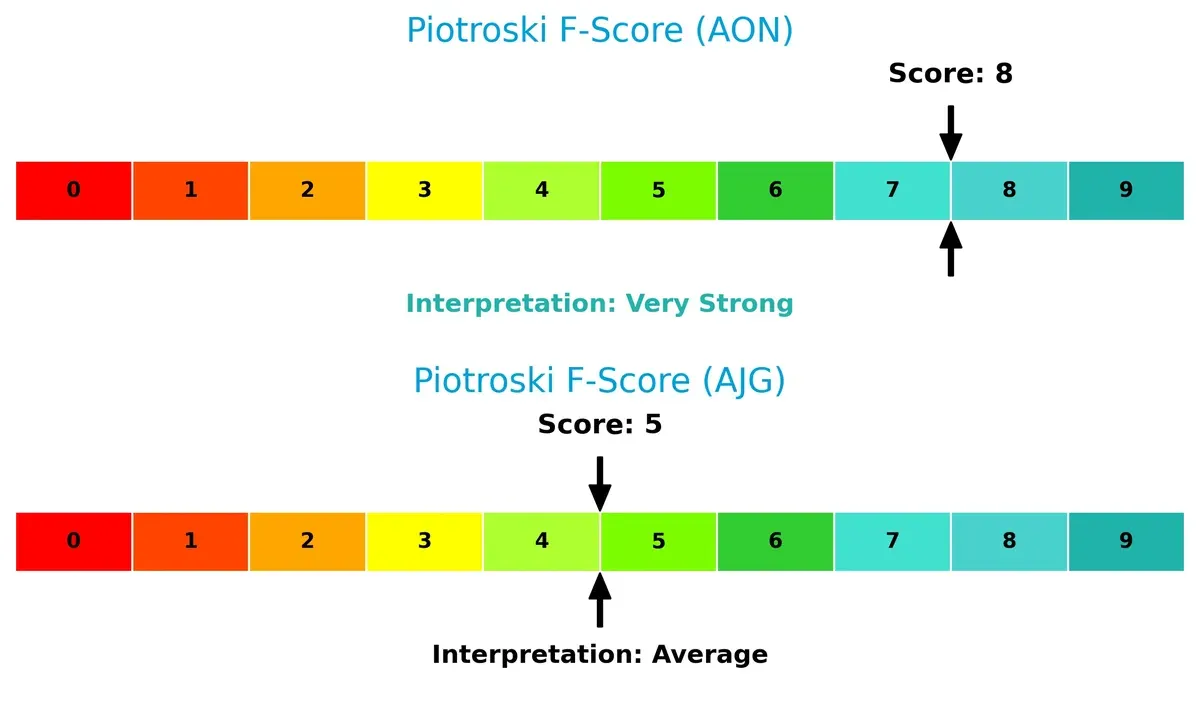
Financial Health: Quality of Operations
Aon’s Piotroski F-Score of 8 suggests robust financial health and operational quality. Gallagher’s score of 5 is average, indicating potential internal weaknesses:
How are the two companies positioned?
This section dissects Aon and Arthur J. Gallagher’s operational DNA by comparing revenue distribution and internal dynamics. The goal is to confront their economic moats, revealing which model offers the most resilient competitive advantage today.
Revenue Segmentation: The Strategic Mix
This visual comparison dissects how Aon plc and Arthur J. Gallagher & Co. diversify their income streams and where their primary sector bets lie:
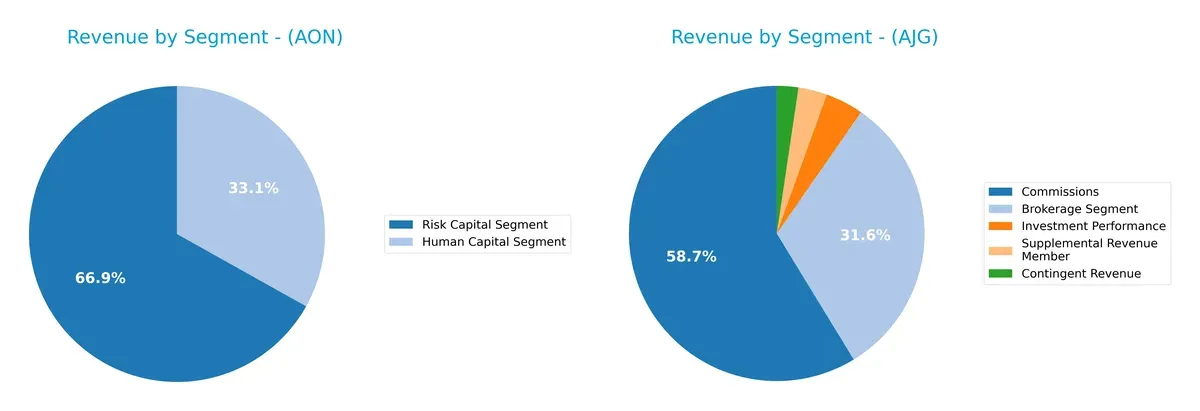
Aon pivots around its Risk Capital Segment with $10.5B, supported by a $5.2B Human Capital Segment, showing moderate diversification. Gallagher relies heavily on Commissions at $6.7B, with Brokerage Segment revenue of $3.6B anchoring its mix. Aon’s broader segment spread reduces concentration risk, while Gallagher’s focus signals strong ecosystem lock-in but higher vulnerability to brokerage market shifts.
Strengths and Weaknesses Comparison
This table compares the strengths and weaknesses of Aon and Arthur J. Gallagher based on diversification, profitability, financials, innovation, global presence, and market share:
Aon Strengths
- Diverse revenue streams across Risk, Human Capital, Health, and Wealth segments
- Strong profitability with 21.51% net margin and 39.51% ROE
- Favorable ROIC above WACC at 13.18% vs 6.87%
- Solid global footprint with significant US, UK, and EMEA presence
- High fixed asset turnover at 12.46 indicates operational efficiency
Arthur J. Gallagher Strengths
- Diversified brokerage and risk management revenues with commissions and investment income
- Favorable balance sheet metrics with low debt-to-equity and debt-to-assets ratios
- Presence in key markets including US, UK, Canada, Australia, and New Zealand
- Dividend yield at 1.0% offers moderate income support
Aon Weaknesses
- Elevated debt-to-equity ratio at 1.77 signals higher leverage risk
- Negative interest coverage at -5.78 is a significant red flag for debt servicing
- Unfavorable price-to-book ratio at 8.15 may indicate overvaluation
- Asset turnover low at 0.34 suggests less efficient asset use
- Dividend yield below 1% limits shareholder income
Arthur J. Gallagher Weaknesses
- Zero reported ROE and ROIC raise concerns about profitability and capital efficiency
- Unavailable WACC limits cost of capital assessment
- Elevated P/E at 45.1 signals expensive valuation
- Weak current and quick ratios indicate liquidity concerns
- Asset and fixed asset turnover reported as zero suggest operational inefficiencies
Aon leads in profitability and operational efficiency metrics while carrying more financial leverage risks. Arthur J. Gallagher shows a stronger balance sheet and geographic spread but struggles with profitability and valuation concerns. These contrasts affect each company’s strategic focus on growth versus financial stability.
The Moat Duel: Analyzing Competitive Defensibility
A structural moat is the only barrier protecting long-term profits from relentless competition erosion. Let’s dissect how these firms defend their turf:
Aon plc: Intangible Assets Anchoring Durable Value
Aon’s moat stems from its intangible assets and advisory expertise, reflected in a robust 27.4% EBIT margin and a ROIC 6.3% above WACC. Its growing profitability signals a durable competitive advantage. New product expansions in cyber risk and global consulting could deepen this moat in 2026.
Arthur J. Gallagher & Co.: Expansive Network Effects Under Pressure
Gallagher relies on broad brokerage networks and client relationships, delivering a higher gross margin at 54.7% but weaker EBIT margin at 18.2%. Its declining ROIC trend warns of margin pressure. Yet, aggressive international expansion offers potential market disruption in 2026.
Intangible Assets vs. Network Effects: Who Holds the Stronger Moat?
Aon’s rising ROIC and stable margin profile reveal a deeper, more sustainable moat than Gallagher’s strained profitability and shrinking returns. I view Aon as better positioned to defend and grow market share amid intensifying competition.
Which stock offers better returns?
The past year shows Aon plc’s stock rising notably before recent slight decline, while Arthur J. Gallagher & Co. experienced a mild overall drop with accelerating negative momentum.
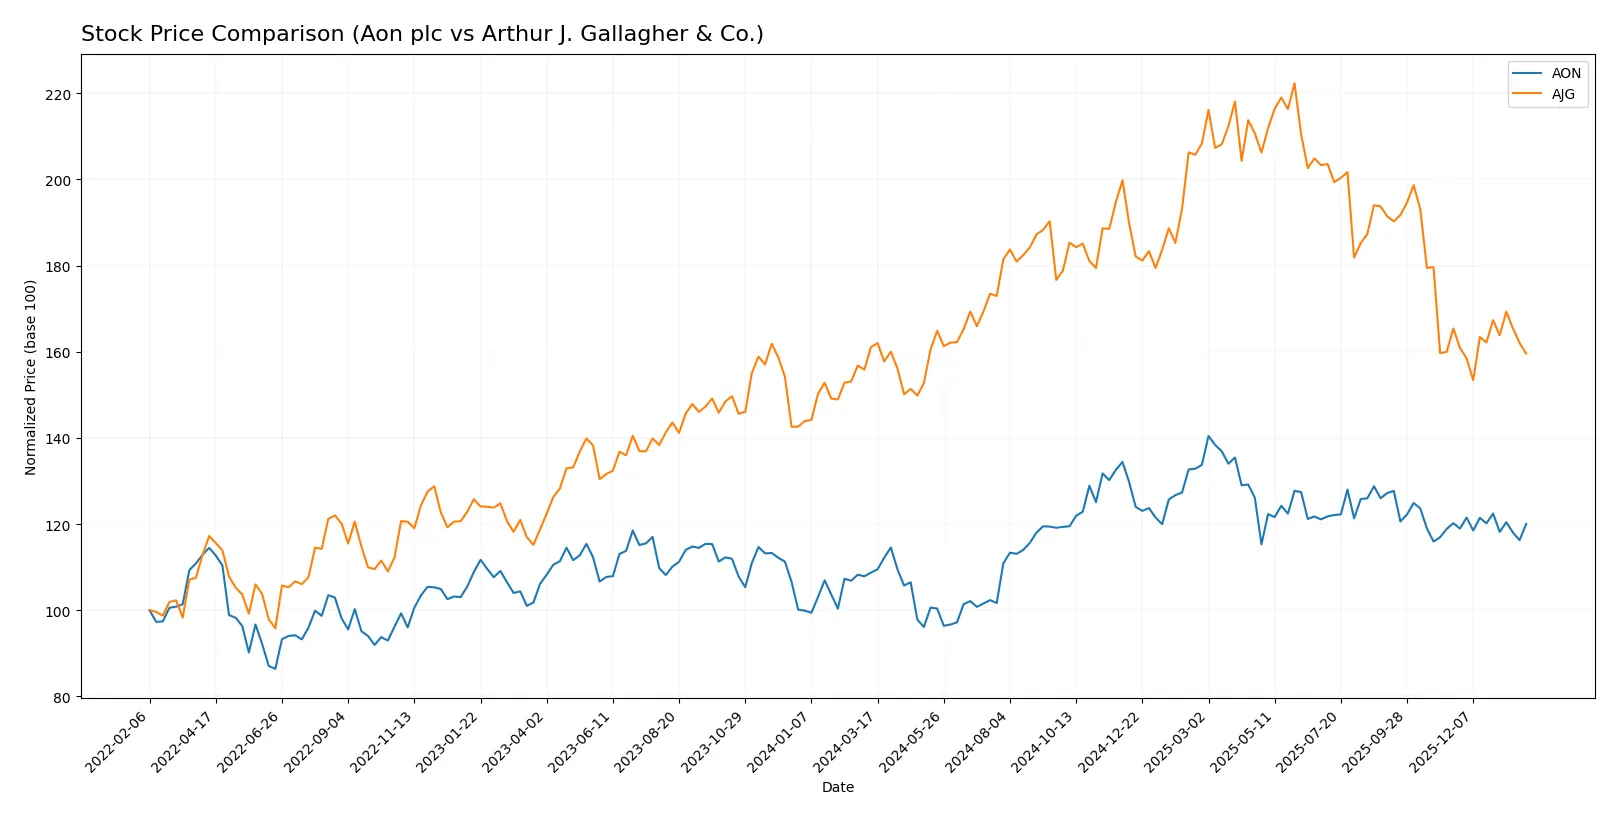
Trend Comparison
Aon plc’s stock gained 10.38% over the last 12 months, marking a bullish trend with decelerating growth and a price range between 280 and 409. Volatility is high at 29.63%.
Arthur J. Gallagher & Co. fell 0.92% over the same period, reflecting a bearish trend with accelerating decline. Its price fluctuated between 234 and 347, with similar volatility near 29.81%.
Comparing both, Aon plc delivered superior market performance with a clear bullish trend, while Arthur J. Gallagher & Co. showed a modest bearish trend and weaker returns.
Target Prices
Analysts present a cautiously optimistic consensus for Aon plc and Arthur J. Gallagher & Co.
| Company | Target Low | Target High | Consensus |
|---|---|---|---|
| Aon plc | 381 | 448 | 403.75 |
| Arthur J. Gallagher & Co. | 247 | 334 | 282.38 |
The consensus targets for Aon and Arthur J. Gallagher exceed their current prices by 15% and 13%, respectively, signaling moderate upside potential in a competitive insurance brokerage sector.

Don’t Let Luck Decide Your Entry Point
Optimize your entry points with our advanced ProRealTime indicators. You’ll get efficient buy signals with precise price targets for maximum performance. Start outperforming now!
How do institutions grade them?
Institutional grades for Aon plc and Arthur J. Gallagher & Co. highlight their current market positioning:
Aon plc Grades
This table lists recent institutional grades for Aon plc from reputable financial firms.
| Grading Company | Action | New Grade | Date |
|---|---|---|---|
| Cantor Fitzgerald | Maintain | Overweight | 2026-01-14 |
| Wells Fargo | Maintain | Overweight | 2026-01-13 |
| Barclays | Maintain | Equal Weight | 2026-01-08 |
| JP Morgan | Maintain | Overweight | 2026-01-07 |
| Keefe, Bruyette & Woods | Maintain | Outperform | 2026-01-06 |
| Barclays | Downgrade | Equal Weight | 2025-11-20 |
| UBS | Maintain | Neutral | 2025-11-10 |
| Keefe, Bruyette & Woods | Maintain | Outperform | 2025-11-04 |
| TD Cowen | Maintain | Buy | 2025-11-03 |
| Evercore ISI Group | Maintain | Outperform | 2025-11-03 |
Arthur J. Gallagher & Co. Grades
Below are the latest grades for Arthur J. Gallagher & Co. from established grading firms.
| Grading Company | Action | New Grade | Date |
|---|---|---|---|
| Piper Sandler | Maintain | Neutral | 2026-01-30 |
| Wells Fargo | Maintain | Overweight | 2026-01-30 |
| Keefe, Bruyette & Woods | Maintain | Market Perform | 2026-01-30 |
| Cantor Fitzgerald | Downgrade | Neutral | 2026-01-14 |
| Wells Fargo | Maintain | Overweight | 2026-01-13 |
| BMO Capital | Downgrade | Market Perform | 2026-01-13 |
| Barclays | Maintain | Underweight | 2026-01-08 |
| Piper Sandler | Downgrade | Neutral | 2026-01-07 |
| Keefe, Bruyette & Woods | Maintain | Market Perform | 2026-01-06 |
| Wells Fargo | Maintain | Overweight | 2025-12-23 |
Which company has the best grades?
Aon plc generally holds stronger grades, including multiple Overweight and Outperform ratings. Arthur J. Gallagher & Co. shows more Neutral and Market Perform grades with some downgrades. Investors may view Aon’s grades as reflecting a more favorable institutional outlook.
Risks specific to each company
The following categories identify the critical pressure points and systemic threats facing both firms in the 2026 market environment:
1. Market & Competition
Aon plc
- Operates globally with diversified commercial risk and health solutions, facing intense competition from large brokers and consulting firms.
Arthur J. Gallagher & Co.
- Focuses on retail and wholesale brokerage with geographic concentration in the US and select countries, exposed to competitive pressures from specialized brokers.
2. Capital Structure & Debt
Aon plc
- Debt-to-equity ratio at 1.77 signals significant leverage; interest coverage is negative at -5.78, indicating potential risk servicing debt.
Arthur J. Gallagher & Co.
- Debt metrics unavailable or zero; interest coverage at 3.97, reflecting moderate ability to cover interest expenses and healthier balance sheet.
3. Stock Volatility
Aon plc
- Beta of 0.835 shows moderate sensitivity to market swings, slightly more volatile than AJG.
Arthur J. Gallagher & Co.
- Beta at 0.675 suggests lower stock volatility and relative stability compared to broader market moves.
4. Regulatory & Legal
Aon plc
- Subject to global insurance and financial regulations, increasing compliance costs and exposure to regulatory changes.
Arthur J. Gallagher & Co.
- Also heavily regulated, particularly in US and UK markets; risks from evolving insurance legislation and compliance requirements.
5. Supply Chain & Operations
Aon plc
- Complex global operations expose Aon to operational risks, including integration of technology platforms and service delivery consistency.
Arthur J. Gallagher & Co.
- Operational focus on brokerage and claims management; risks tied to efficiency of third-party brokers and claims settlement processes.
6. ESG & Climate Transition
Aon plc
- Increasing pressure to align risk and health solutions with ESG standards; climate risk impacts on underwriting and consulting services.
Arthur J. Gallagher & Co.
- Faces ESG challenges in client risk profiles and internal sustainability practices, with evolving expectations from investors and clients.
7. Geopolitical Exposure
Aon plc
- Global footprint exposes it to currency fluctuations, trade tensions, and political instability across multiple regions.
Arthur J. Gallagher & Co.
- Primarily US-based but with international operations; geopolitical risks concentrated in fewer markets, reducing but not eliminating exposure.
Which company shows a better risk-adjusted profile?
Aon’s most impactful risk is its high leverage combined with negative interest coverage, signaling financial strain despite strong operational metrics. Gallagher’s key risk lies in weaker profitability and asset utilization metrics, limiting growth potential. Gallagher’s lower leverage and volatility suggest a better risk-adjusted profile. Notably, Aon’s Altman Z-score at 1.79 places it near distress, while Gallagher’s 1.28 is even more concerning, but Gallagher’s stronger Piotroski score indicates better financial health resilience.
Final Verdict: Which stock to choose?
Aon plc’s superpower lies in its durable economic moat, demonstrated by a growing ROIC well above its WACC. This signals efficient capital allocation and consistent value creation. However, its leverage and interest coverage metrics warrant vigilance. It fits best in an aggressive growth portfolio seeking robust profitability with some risk tolerance.
Arthur J. Gallagher & Co. benefits from a strategic moat rooted in its recurring revenue and strong cash flow quality. It offers a safer balance sheet profile than Aon, highlighted by lower debt levels. This makes it suitable for a GARP (Growth at a Reasonable Price) investor prioritizing stability alongside moderate growth potential.
If you prioritize capital efficiency and value creation, Aon outshines due to its proven ability to deliver superior returns on invested capital. However, if you seek better financial stability and lower leverage risk, Arthur J. Gallagher offers a more conservative profile with steady cash flow. Both have merits, so aligning choice with your risk tolerance is key.
Disclaimer: Investment carries a risk of loss of initial capital. The past performance is not a reliable indicator of future results. Be sure to understand risks before making an investment decision.
Go Further
I encourage you to read the complete analyses of Aon plc and Arthur J. Gallagher & Co. to enhance your investment decisions: