In the competitive world of alcoholic beverages, Anheuser-Busch InBev SA/NV (BUD) and Molson Coors Beverage Company (TAP) stand out as two industry giants. Both companies share a focus on beer production and global market reach, yet differ in scale, innovation strategies, and regional influence. This article will analyze their strengths and risks to help you decide which company is the more compelling investment opportunity in 2026.

Table of contents
Companies Overview
I will begin the comparison between Anheuser-Busch InBev SA/NV and Molson Coors Beverage Company by providing an overview of these two companies and their main differences.
Anheuser-Busch InBev SA/NV Overview
Anheuser-Busch InBev SA/NV is a leading global producer, distributor, and seller of beer, alcoholic beverages, and soft drinks. Headquartered in Leuven, Belgium, the company offers a portfolio of approximately 500 beer brands, including Budweiser, Corona, and Stella Artois. Established in 1366, it holds a significant position in the beverages industry with a large workforce of 144K employees.
Molson Coors Beverage Company Overview
Molson Coors Beverage Company manufactures, markets, and sells beer and malt beverages across multiple regions including the Americas, Europe, and Asia Pacific. Based in Golden, Colorado, the company offers craft, flavored malt, and ready-to-drink beverages. Founded in 1774, it employs around 16.8K people and serves diverse markets under various brands, reflecting its broad geographic reach.
Key similarities and differences
Both companies operate in the alcoholic beverages sector and are listed on the NYSE, focusing on beer and related products. Anheuser-Busch InBev has a far larger market cap and workforce, emphasizing a global portfolio of numerous beer brands. Molson Coors, while smaller in scale, emphasizes a diverse product range including malt beverages and operates primarily in the Americas and select international markets, showing a more regional footprint.
Income Statement Comparison
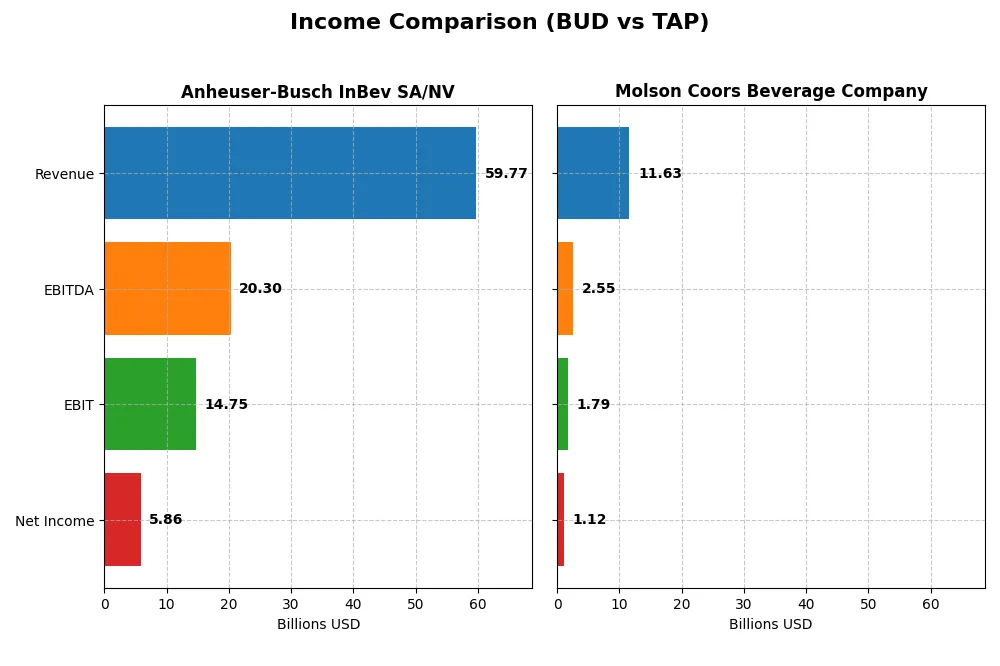
This table provides a side-by-side comparison of key income statement metrics for Anheuser-Busch InBev SA/NV and Molson Coors Beverage Company for the fiscal year 2024.
| Metric | Anheuser-Busch InBev SA/NV | Molson Coors Beverage Company |
|---|---|---|
| Market Cap | 136B | 9.8B |
| Revenue | 59.8B | 11.6B |
| EBITDA | 20.3B | 2.5B |
| EBIT | 14.8B | 1.8B |
| Net Income | 5.9B | 1.1B |
| EPS | 2.92 | 5.38 |
| Fiscal Year | 2024 | 2024 |
Income Statement Interpretations
Anheuser-Busch InBev SA/NV
Anheuser-Busch InBev’s revenue increased steadily from $46.9B in 2020 to $59.8B in 2024, with net income rising sharply from $1.4B to $5.9B in the same period. Margins improved notably, including a gross margin of 55.25% and a net margin near 9.8%. The latest year showed modest revenue growth of 0.65% but favorable EBIT and net margin expansion, reflecting operational efficiency gains.
Molson Coors Beverage Company
Molson Coors’ revenue grew from $9.7B in 2020 to $11.6B in 2024, despite a slight decline of 0.64% in the most recent year. Net income recovered from a loss of $0.95B in 2020 to a profit of $1.12B in 2024. Margins improved, with a gross margin of 38.99% and net margin of 9.65%. The 2024 fiscal year saw a significant EBIT and EPS increase, indicating a strong operational rebound.
Which one has the stronger fundamentals?
Both companies exhibit favorable income statement fundamentals, with Anheuser-Busch InBev showing stronger absolute revenue and net income levels and superior gross and net margins. Molson Coors demonstrates impressive net income recovery and margin improvements from previous losses. While both show growth challenges in revenue recently, their operational efficiencies and margin expansions support solid fundamentals overall.
Financial Ratios Comparison
The table below presents key financial ratios for Anheuser-Busch InBev SA/NV (BUD) and Molson Coors Beverage Company (TAP) for the fiscal year 2024, providing a snapshot of their profitability, liquidity, leverage, efficiency, and dividend metrics.
| Ratios | Anheuser-Busch InBev SA/NV (BUD) | Molson Coors Beverage Company (TAP) |
|---|---|---|
| ROE | 7.48% | 8.57% |
| ROIC | 6.21% | 5.85% |
| P/E | 17.13 | 10.66 |
| P/B | 1.28 | 0.91 |
| Current Ratio | 0.70 | 0.94 |
| Quick Ratio | 0.54 | 0.70 |
| D/E (Debt-to-Equity) | 0.92 | 0.47 |
| Debt-to-Assets | 34.93% | 23.76% |
| Interest Coverage | 3.47 | 6.28 |
| Asset Turnover | 0.29 | 0.45 |
| Fixed Asset Turnover | 2.54 | 2.61 |
| Payout Ratio | 45.56% | 32.89% |
| Dividend Yield | 2.66% | 3.08% |
Interpretation of the Ratios
Anheuser-Busch InBev SA/NV
Anheuser-Busch InBev shows a mixed ratio profile with neutral net margin (9.8%) and ROIC (6.21%), but an unfavorable ROE (7.48%) and weak liquidity indicated by a low current ratio (0.7). Debt levels appear neutral with a debt-to-equity of 0.92. The dividend yield is favorable at 2.66%, supported by a balanced payout strategy, though some cash flow coverage concerns exist.
Molson Coors Beverage Company
Molson Coors exhibits a slightly stronger ratio set with a favorable P/E of 10.66 and a solid dividend yield of 3.08%. Its leverage ratios are favorable, including a debt-to-equity ratio of 0.47 and interest coverage at 6.39. Liquidity remains a concern with a current ratio below 1. The company maintains dividends, supported by steady free cash flow, amidst a neutral to favorable operational return profile.
Which one has the best ratios?
Molson Coors presents a more favorable overall ratio profile with half of its key metrics rated positively, including valuation, leverage, and dividend yield. Anheuser-Busch InBev, though large and stable, faces liquidity challenges and less efficient equity returns, resulting in a slightly unfavorable global assessment. Thus, Molson Coors shows comparatively stronger financial ratio health.
Strategic Positioning
This section compares the strategic positioning of Anheuser-Busch InBev SA/NV (BUD) and Molson Coors Beverage Company (TAP) regarding market position, key segments, and exposure to disruption:
Anheuser-Busch InBev SA/NV
- Leading global beer producer with a large market cap and moderate competitive pressure.
- Broad portfolio of ~500 beer brands and additional services like transportation and advertising.
- No explicit mention of technological disruption exposure in provided data.
Molson Coors Beverage Company
- Smaller market cap, competing mainly in Americas and other select regions with moderate pressure.
- Focused on beer, flavored malt, craft, and ready-to-drink beverages across multiple regions.
- No explicit mention of technological disruption exposure in provided data.
Anheuser-Busch InBev SA/NV vs Molson Coors Beverage Company Positioning
BUD has a highly diversified global brand portfolio and ancillary services, while TAP concentrates on core malt beverages across several regions. BUD’s scale offers broad market coverage, whereas TAP maintains a more defined product focus with fewer employees and smaller market cap.
Which has the best competitive advantage?
Both companies have slightly favorable moat evaluations with growing ROIC trends but currently shed value relative to WACC. Neither demonstrates a clear competitive advantage, though improving profitability suggests potential future gains.
Stock Comparison
The stock prices of Anheuser-Busch InBev SA/NV (BUD) and Molson Coors Beverage Company (TAP) exhibited divergent dynamics over the past 12 months, with notable bullish acceleration for BUD contrasting a bearish accelerated trend for TAP.
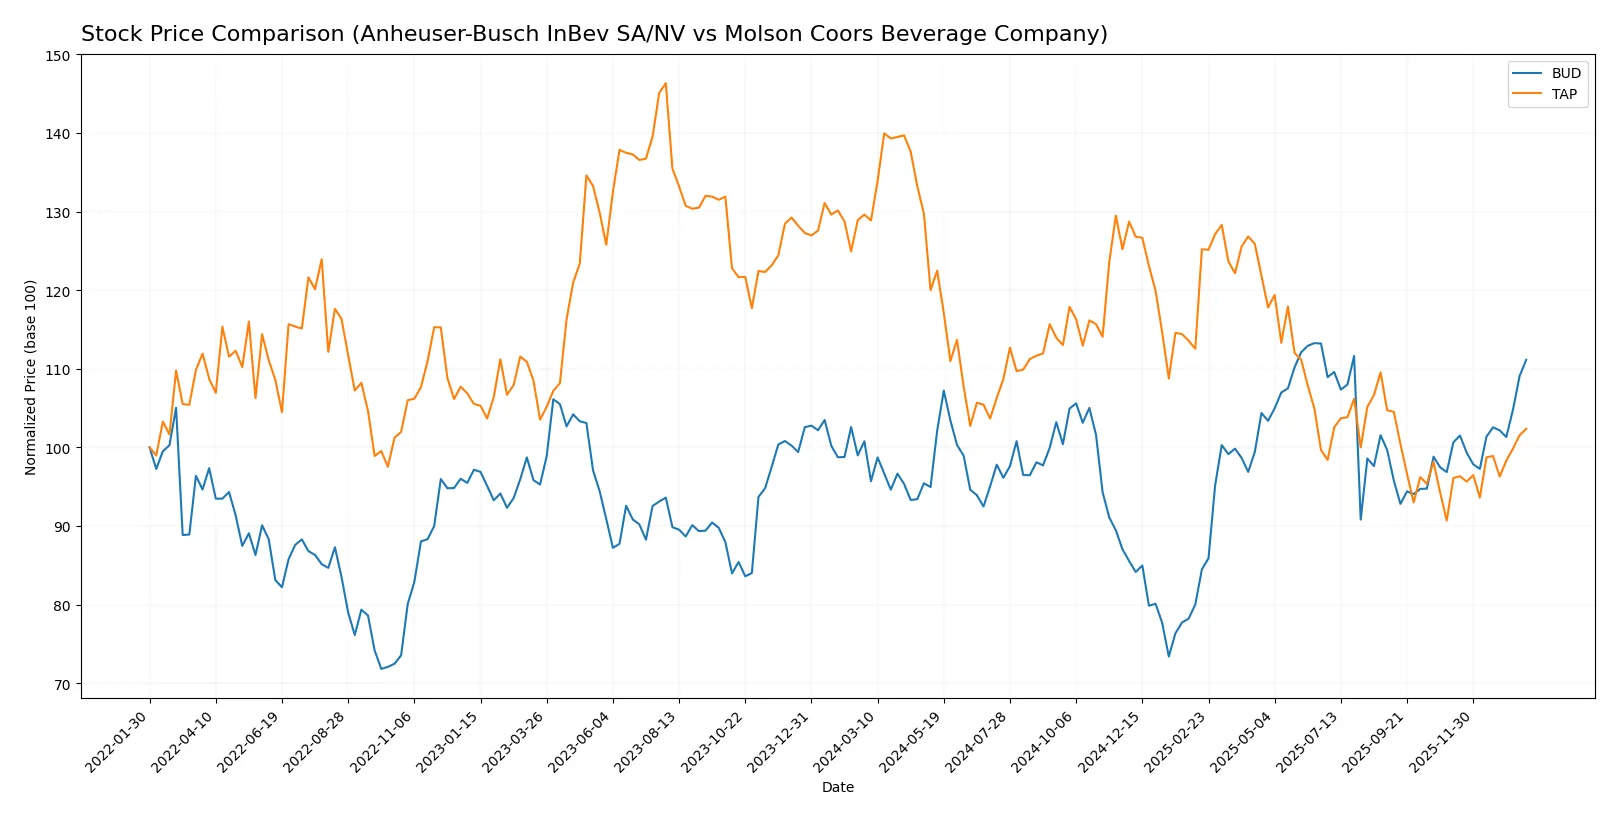
Trend Analysis
Analyzing Anheuser-Busch InBev SA/NV (BUD), the stock showed a bullish trend with a 16.14% price increase over the past year, supported by accelerating momentum and a standard deviation of 5.42. The price ranged from a low of 46.15 to a high of 71.22.
Molson Coors Beverage Company (TAP) experienced a bearish trend, declining 20.57% over the same period with accelerating downward momentum and a volatility measure of 5.89. The stock fluctuated between 43.72 at the low and 67.47 at the high.
Comparing both, BUD delivered the highest market performance with a significant positive price change, while TAP’s stock showed a marked negative return over the past year.
Target Prices
The current target price consensus for these beverage industry leaders reflects moderate upside potential for investors.
| Company | Target High | Target Low | Consensus |
|---|---|---|---|
| Anheuser-Busch InBev SA/NV | 75 | 74 | 74.5 |
| Molson Coors Beverage Company | 65 | 40 | 50.67 |
Analysts expect Anheuser-Busch InBev’s stock to trade slightly above its current price of 69.88 USD, signaling modest growth. Molson Coors shows a wider target range with a consensus above the current price of 49.35 USD, indicating potential appreciation but with more uncertainty.
Analyst Opinions Comparison
This section compares analysts’ ratings and grades for Anheuser-Busch InBev SA/NV (BUD) and Molson Coors Beverage Company (TAP):
Rating Comparison
BUD Rating
- Rating: B, evaluated as Very Favorable by analysts.
- Discounted Cash Flow Score: 4, indicating a Favorable status.
- ROE Score: 3, showing a Moderate efficiency in equity use.
- ROA Score: 3, reflecting Moderate asset utilization.
- Debt To Equity Score: 2, representing Moderate financial risk.
- Overall Score: 3, assessed as Moderate overall financial strength.
TAP Rating
- Rating: B-, also evaluated as Very Favorable by analysts.
- Discounted Cash Flow Score: 5, indicating a Very Favorable status.
- ROE Score: 1, indicating a Very Unfavorable efficiency level.
- ROA Score: 1, reflecting Very Unfavorable asset utilization.
- Debt To Equity Score: 2, also representing Moderate financial risk.
- Overall Score: 2, assessed as Moderate but lower than BUD’s score.
Which one is the best rated?
Based strictly on the data, BUD holds higher overall and efficiency scores (ROE and ROA) compared to TAP, despite TAP’s stronger discounted cash flow score. BUD’s balanced moderate ratings suggest a more consistent financial profile.
Scores Comparison
Here is a comparison of the Altman Z-Score and Piotroski Score for the two companies:
BUD Scores
- Altman Z-Score: 1.96, indicating a grey zone, moderate risk of bankruptcy.
- Piotroski Score: 9, very strong financial health and value.
TAP Scores
- Altman Z-Score: 0.87, indicating distress zone, high bankruptcy risk.
- Piotroski Score: 5, average financial strength and value.
Which company has the best scores?
BUD shows better scores with a grey zone Altman Z-Score and a very strong Piotroski Score of 9, compared to TAP’s distress zone Z-Score and average Piotroski Score of 5.
Grades Comparison
Here is a summary of the latest reliable grades assigned by recognized financial institutions for both companies:
Anheuser-Busch InBev SA/NV Grades
This table lists recent grades from major financial firms for Anheuser-Busch InBev SA/NV:
| Grading Company | Action | New Grade | Date |
|---|---|---|---|
| Goldman Sachs | Upgrade | Buy | 2025-05-12 |
| TD Cowen | Maintain | Hold | 2025-01-08 |
| TD Cowen | Downgrade | Hold | 2024-10-08 |
| Citigroup | Upgrade | Buy | 2024-10-01 |
| Morgan Stanley | Maintain | Overweight | 2024-09-10 |
| Morgan Stanley | Maintain | Overweight | 2024-07-02 |
| TD Cowen | Maintain | Outperform | 2024-03-05 |
| Exane BNP Paribas | Downgrade | Neutral | 2024-01-12 |
| Jefferies | Upgrade | Buy | 2024-01-10 |
| JP Morgan | Maintain | Overweight | 2023-11-29 |
Overall, Anheuser-Busch InBev SA/NV has generally received positive grade revisions recently, with multiple upgrades to “Buy” and consistent “Overweight” and “Outperform” ratings from leading firms.
Molson Coors Beverage Company Grades
This table summarizes recent grades from reputable firms for Molson Coors Beverage Company:
| Grading Company | Action | New Grade | Date |
|---|---|---|---|
| UBS | Maintain | Neutral | 2026-01-14 |
| Piper Sandler | Maintain | Neutral | 2025-11-21 |
| Wells Fargo | Downgrade | Equal Weight | 2025-11-19 |
| Barclays | Maintain | Underweight | 2025-11-06 |
| Wells Fargo | Maintain | Overweight | 2025-11-05 |
| Jefferies | Maintain | Hold | 2025-11-05 |
| Evercore ISI Group | Maintain | Outperform | 2025-11-05 |
| JP Morgan | Maintain | Neutral | 2025-11-05 |
| Roth Capital | Maintain | Buy | 2025-11-05 |
| UBS | Maintain | Neutral | 2025-11-05 |
Molson Coors Beverage Company’s grades show a mixed to neutral stance overall, with several “Neutral” and “Hold” ratings and a few “Buy” and “Outperform” opinions, alongside some downgrades.
Which company has the best grades?
Anheuser-Busch InBev SA/NV holds a stronger consensus with a majority “Buy” rating and multiple recent upgrades, while Molson Coors Beverage Company carries a more cautious “Hold” consensus. This divergence may influence investor perception of growth potential and risk.
Strengths and Weaknesses
The table below summarizes the key strengths and weaknesses of Anheuser-Busch InBev SA/NV (BUD) and Molson Coors Beverage Company (TAP) based on recent financial and strategic data.
| Criterion | Anheuser-Busch InBev SA/NV (BUD) | Molson Coors Beverage Company (TAP) |
|---|---|---|
| Diversification | Moderate product and service mix with growing ancillary revenue streams (transportation, leases, advertising) | Less diversified, focused primarily on beverage products |
| Profitability | Neutral net margin (9.8%), slightly unfavorable ROE (7.48%), neutral ROIC (6.21%) | Neutral net margin (9.65%), slightly unfavorable ROE (8.57%), neutral ROIC (5.85%) |
| Innovation | Slightly Favorable economic moat with growing ROIC trend, indicating improving competitive positioning | Slightly Favorable economic moat with growing ROIC trend, but no strong competitive advantage yet |
| Global presence | Strong global footprint, reflected in asset scale and turnover | More regional focus with comparatively lower debt and asset turnover ratios |
| Market Share | Leading market share with efficient capital use but facing margin pressure | Smaller market share but improving financial leverage and dividend yield |
Key takeaways: Both companies are showing improving profitability trends but still do not demonstrate a strong economic moat. BUD benefits from a more diversified portfolio and global presence, while TAP exhibits better financial leverage and valuation metrics. Caution is advised as neither company currently commands a clear competitive advantage.
Risk Analysis
Below is a comparative table outlining key risks for Anheuser-Busch InBev SA/NV (BUD) and Molson Coors Beverage Company (TAP) as of 2026:
| Metric | Anheuser-Busch InBev SA/NV (BUD) | Molson Coors Beverage Company (TAP) |
|---|---|---|
| Market Risk | Moderate (Beta 0.68; stable global demand but sensitive to consumer trends) | Low (Beta 0.45; more regional exposure, less volatile) |
| Debt level | Moderate (Debt-to-equity ~0.92; neutral rating, interest coverage 3.3) | Low (Debt-to-equity ~0.47; favorable rating, interest coverage 6.4) |
| Regulatory Risk | Moderate (Global operations face varied alcohol regulations and taxation) | Moderate (US-centric with regulatory scrutiny in alcoholic beverages) |
| Operational Risk | Moderate (Large scale with complex supply chain; asset turnover low) | Moderate (Smaller scale but supply chain and production risks persist) |
| Environmental Risk | Moderate (Sustainability initiatives underway but water usage and emissions remain concerns) | Moderate (Focus on sustainability but exposed to environmental regulations) |
| Geopolitical Risk | Moderate (Operations in multiple regions face trade and political risks) | Moderate (Primarily North America but some exposure to global markets) |
The most impactful risks for both companies are their moderate debt levels and regulatory environment challenges. BUD’s higher debt and lower liquidity ratios increase financial risk compared to TAP’s stronger balance sheet. Global regulatory complexities and evolving consumer preferences are key market risks. TAP’s lower beta suggests less market volatility, but its weaker financial distress scores indicate caution. Overall, risk management should prioritize debt control and regulatory compliance.
Which Stock to Choose?
Anheuser-Busch InBev SA/NV (BUD) shows a favorable income statement with strong growth in net income and EPS over 2020-2024, though revenue growth slowed recently. Its financial ratios reveal a slightly unfavorable overall profile, marked by moderate debt and a low current ratio. The company’s rating is very favorable with a moderate overall score, supported by a very strong Piotroski score and a grey zone Altman Z-Score. The MOAT evaluation indicates slightly favorable profitability with growing ROIC.
Molson Coors Beverage Company (TAP) displays a favorable income statement with solid growth in net income and EPS despite a slight recent revenue decline. Its financial ratios are slightly favorable overall, characterized by lower debt and better coverage ratios than BUD. TAP’s rating is also very favorable but with a moderate overall score, an average Piotroski score, and a distress zone Altman Z-Score. The MOAT evaluation is slightly favorable with improving ROIC.
For investors focused on growth and improving profitability, BUD’s strong income growth and financial health indicators might appear more attractive. Conversely, those prioritizing lower leverage and more favorable financial ratios could find TAP’s profile more suitable. Each stock’s outlook could be interpreted differently depending on risk tolerance and investment strategy.
Disclaimer: Investment carries a risk of loss of initial capital. The past performance is not a reliable indicator of future results. Be sure to understand risks before making an investment decision.
Go Further
I encourage you to read the complete analyses of Anheuser-Busch InBev SA/NV and Molson Coors Beverage Company to enhance your investment decisions: