Home > Comparison > Technology > ADI vs SLAB
The strategic rivalry between Analog Devices, Inc. and Silicon Laboratories Inc. shapes the semiconductor industry’s future. Analog Devices operates as a capital-intensive semiconductor giant, delivering integrated circuits across diverse sectors. Silicon Laboratories, a fabless innovator, focuses on high-margin mixed-signal solutions for IoT applications. This analysis contrasts their growth trajectories and capital models to determine which offers a superior risk-adjusted return for diversified portfolios in 2026.
Table of contents
Companies Overview
Analog Devices and Silicon Laboratories both hold pivotal roles in the semiconductor market, shaping technology across industries.
Analog Devices, Inc.: Leading Analog & Mixed-Signal Innovator
Analog Devices dominates the analog, mixed-signal, and digital signal processing semiconductor space. Its core revenue stems from integrated circuits that convert real-world analog signals to digital data and vice versa. In 2026, the company focuses on expanding applications in automotive, industrial, and communications markets, leveraging its broad product portfolio and global sales network.
Silicon Laboratories Inc.: Fabless IoT Semiconductor Specialist
Silicon Laboratories operates as a fabless semiconductor company specializing in analog-intensive mixed-signal solutions. It generates revenue primarily through wireless microcontrollers and sensors for the Internet of Things (IoT). The company’s strategic emphasis in 2026 lies in advancing connected home, industrial automation, and smart infrastructure applications, supported by its direct sales and distributor channels.
Strategic Collision: Similarities & Divergences
Both companies compete in semiconductors but pursue distinct philosophies: Analog Devices offers a broad product ecosystem with manufacturing capabilities, while Silicon Labs focuses on fabless innovation targeting IoT niches. Their battleground lies in mixed-signal solutions, especially for industrial and smart applications. Analog Devices presents a mature, diversified investment profile; Silicon Labs offers higher growth potential but with greater volatility.
Income Statement Comparison
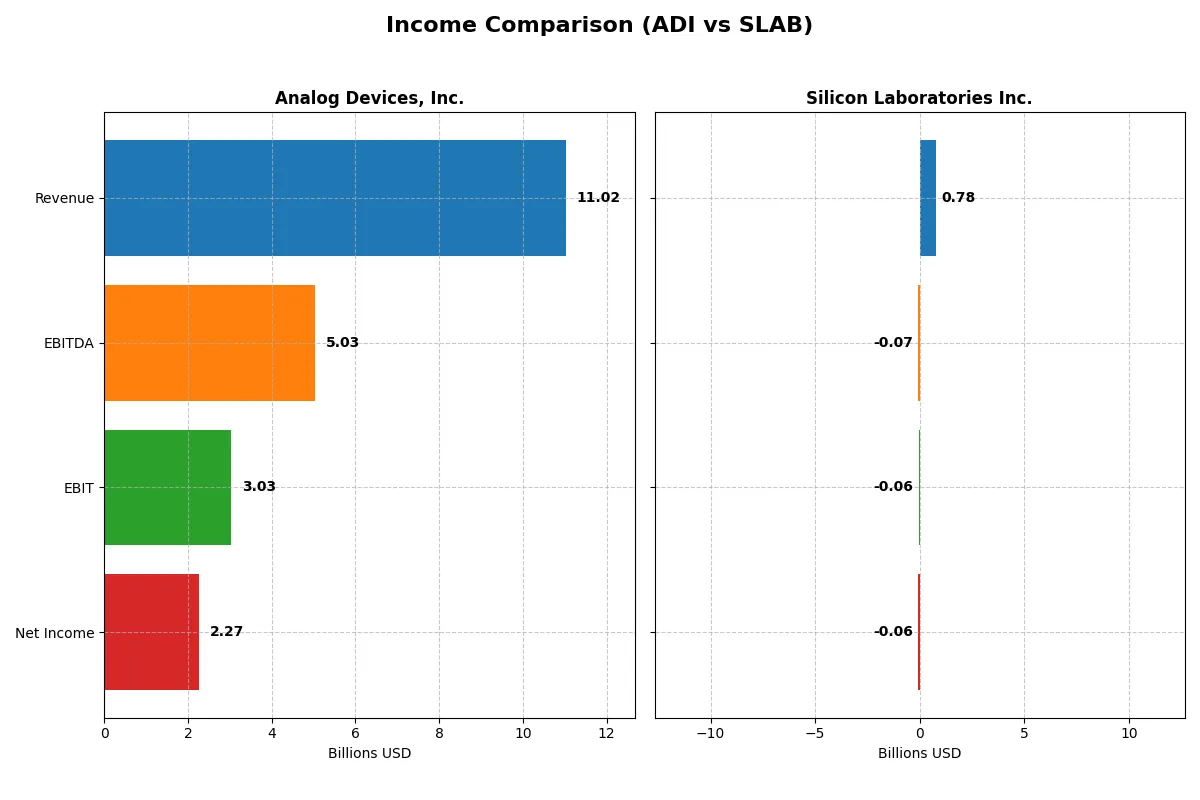
This data dissects the core profitability and scalability of both corporate engines to reveal who dominates the bottom line:
| Metric | Analog Devices, Inc. (ADI) | Silicon Laboratories Inc. (SLAB) |
|---|---|---|
| Revenue | 11.0B | 784.8M |
| Cost of Revenue | 5.0B | 327.8M |
| Operating Expenses | 3.0B | 527.5M |
| Gross Profit | 6.0B | 457.0M |
| EBITDA | 5.0B | -70.5M |
| EBIT | 3.0B | -56.9M |
| Interest Expense | 318M | 975K |
| Net Income | 2.3B | -64.9M |
| EPS | 4.59 | -1.98 |
| Fiscal Year | 2025 | 2025 |
Income Statement Analysis: The Bottom-Line Duel
This income statement comparison reveals which company runs a more efficient and profitable corporate engine through its revenue and net income metrics.
Analog Devices, Inc. Analysis
ADI’s revenue rose steadily from 7.3B in 2021 to 11B in 2025, with net income climbing from 1.4B to 2.3B. Gross margin holds strong above 54%, while net margin improved to 20.6%, signaling healthy cost control and profitability. In 2025, ADI’s 16.9% revenue growth and 18.6% net margin expansion show accelerating operational efficiency.
Silicon Laboratories Inc. Analysis
SLAB’s revenue increased from 721M in 2021 to 785M in 2025, with net income swinging from a 2.1B gain in 2021 (due to discontinued operations) to a 65M loss in 2025. Despite a solid 58% gross margin, the net margin remains negative at -8.3%. The latest year reflects strong top-line growth of 34.3%, but profitability struggles persist.
Margin Power vs. Revenue Scale
ADI delivers consistent revenue and profit growth with robust margins, while SLAB shows faster revenue gains but sustained net losses. ADI’s clear profitability advantage stems from superior margin management and operational leverage. Investors seeking reliable earnings will find ADI’s profile more attractive than SLAB’s volatile bottom line.
Financial Ratios Comparison
These vital ratios act as a diagnostic tool to expose the underlying fiscal health, valuation premiums, and capital efficiency for Analog Devices, Inc. (ADI) and Silicon Laboratories Inc. (SLAB):
| Ratios | Analog Devices, Inc. (ADI) | Silicon Laboratories Inc. (SLAB) |
|---|---|---|
| ROE | 6.7% | -5.9% |
| ROIC | 5.5% | -6.3% |
| P/E | 51.1 | -65.9 |
| P/B | 3.42 | 3.91 |
| Current Ratio | 2.19 | 4.69 |
| Quick Ratio | 1.68 | 4.02 |
| D/E | 0.26 | 0 |
| Debt-to-Assets | 18.1% | 0% |
| Interest Coverage | 9.45 | -72.35 |
| Asset Turnover | 0.23 | 0.62 |
| Fixed Asset Turnover | 3.32 | 6.10 |
| Payout ratio | 84.9% | 0% |
| Dividend yield | 1.66% | 0% |
| Fiscal Year | 2025 | 2025 |
Efficiency & Valuation Duel: The Vital Signs
Ratios act as a company’s DNA, exposing hidden risks and operational strengths that shape investment outcomes.
Analog Devices, Inc.
Analog Devices shows solid net margins at 20.58% but a modest ROE of 6.7%, indicating moderate profitability. Its P/E ratio of 51.05 signals a stretched valuation compared to sector averages. The company balances this with a 1.66% dividend yield and invests heavily in R&D, fueling growth and innovation.
Silicon Laboratories Inc.
Silicon Laboratories suffers negative profitability metrics, including a net margin of -8.27% and ROE of -5.93%, reflecting operational challenges. Its P/E ratio is negative due to losses, but a strong current ratio of 4.69 boosts short-term liquidity. The firm reinvests aggressively in R&D (45% of revenue), foregoing dividends to pursue growth.
Premium Valuation vs. Operational Struggles
Analog Devices offers a more balanced risk-reward profile with positive margins, stable dividends, and moderate growth investment. Silicon Laboratories faces headwinds with negative returns and no dividends but maintains liquidity and growth focus. Conservative investors may prefer Analog Devices, while growth seekers might tolerate Silicon Laboratories’ risk.
Which one offers the Superior Shareholder Reward?
I see Analog Devices, Inc. (ADI) combines a steady 1.66% dividend yield with a high 85% payout ratio supported by strong free cash flow of 8.65/share. ADI also executes meaningful buybacks, enhancing total returns sustainably. Silicon Laboratories Inc. (SLAB) pays no dividends and faces losses, but reinvests heavily in R&D and growth. SLAB’s buybacks are negligible. I conclude ADI offers a more attractive and reliable shareholder reward in 2026.
Comparative Score Analysis: The Strategic Profile
The radar chart reveals the fundamental DNA and trade-offs of Analog Devices, Inc. and Silicon Laboratories Inc.:
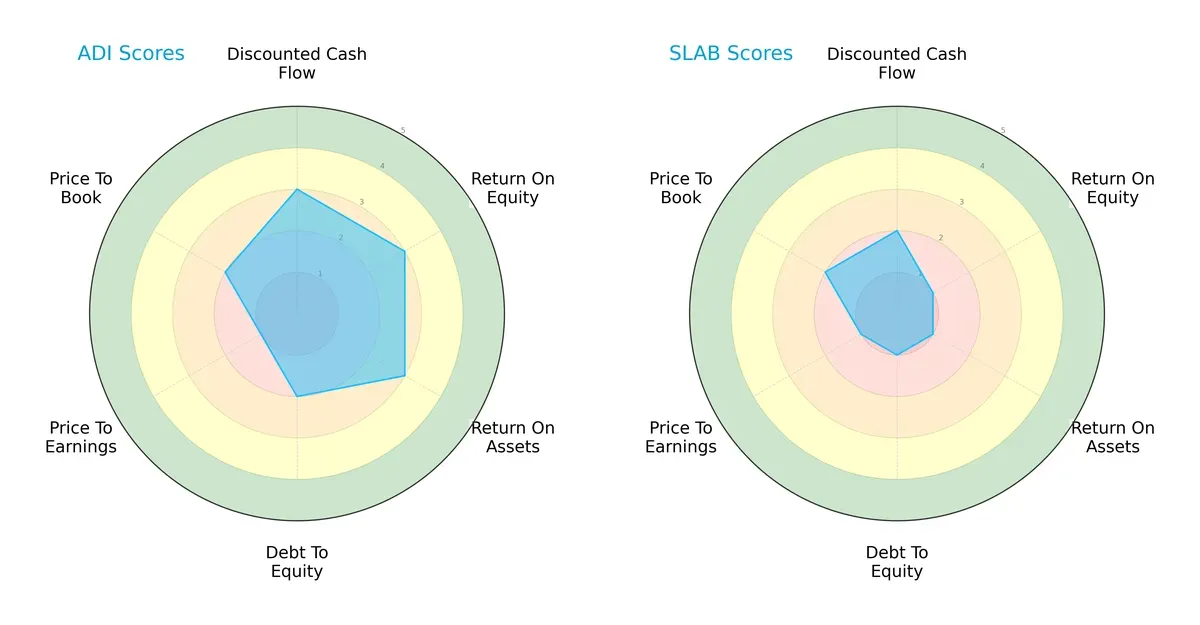
Analog Devices delivers a more balanced profile, scoring moderately on DCF, ROE, ROA, and Debt/Equity. Silicon Laboratories lags with very unfavorable scores on profitability and leverage metrics. ADI leans on operational efficiency, while SLAB struggles with financial stability and valuation, signaling higher risk for investors.
How are the two companies positioned?
This section dissects the operational DNA of ADI and SLAB by comparing their revenue distribution and internal strengths and weaknesses. The goal is to confront their economic moats to reveal which model delivers the most resilient, sustainable competitive advantage today.
Revenue Segmentation: The Strategic Mix
This visual comparison dissects how Analog Devices, Inc. and Silicon Laboratories Inc. diversify their income streams and highlights their primary sector bets:
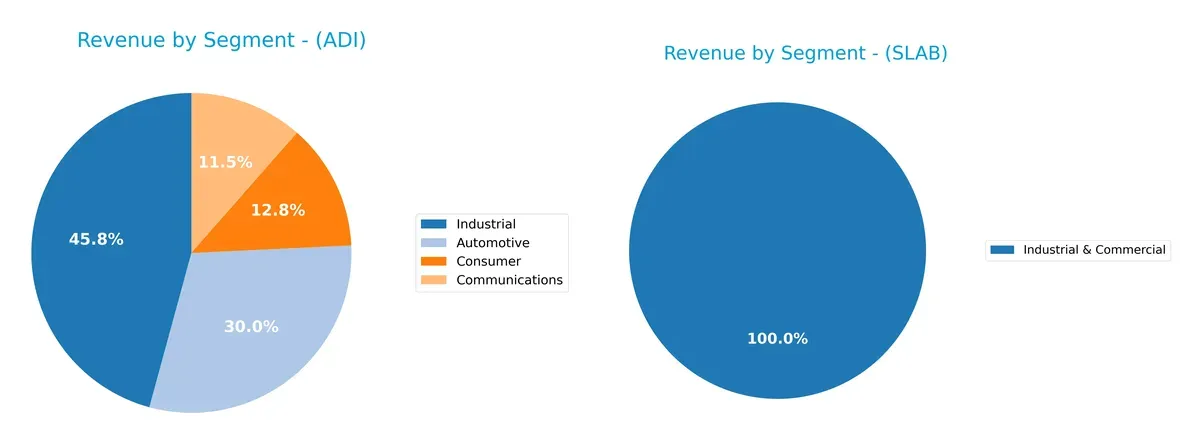
Analog Devices anchors its revenue in Industrial at $4.3B, with substantial contributions from Automotive ($2.8B) and Consumer ($1.2B). This mix reveals a strong industrial and automotive ecosystem lock-in. Silicon Laboratories relies heavily on a single segment, Industrial & Commercial, at $339M, showing less diversification. ADI’s broad sector exposure reduces concentration risk, while SLAB’s focus exposes it to cyclical swings in industrial demand.
Strengths and Weaknesses Comparison
This table compares the strengths and weaknesses of Analog Devices, Inc. (ADI) and Silicon Laboratories Inc. (SLAB):
ADI Strengths
- Diverse revenue streams across Automotive, Communications, Consumer, and Industrial sectors
- Favorable net margin at 20.58%
- Strong current and quick ratios indicating liquidity
- Low debt-to-equity and debt-to-assets ratios
- Significant global presence with large revenues in the US, China, and Europe
- Solid fixed asset turnover
SLAB Strengths
- Favorable fixed asset turnover at 6.1
- Favorable quick ratio and zero debt, indicating strong balance sheet discipline
- Presence in Industrial & Commercial sectors
- Favorable price-to-earnings ratio suggesting undervaluation
- Moderate asset turnover
ADI Weaknesses
- Unfavorable return on equity at 6.7% below cost of capital
- High price-to-earnings and price-to-book ratios
- Unfavorable asset turnover indicating less efficient use of assets
- Neutral ROIC but below WACC at 8.43%
- Limited dividend yield at 1.66%
SLAB Weaknesses
- Negative net margin and returns (ROE, ROIC) indicating unprofitability
- Unfavorable weighted average cost of capital at 11.18%
- Negative interest coverage raising solvency concerns
- Unfavorable current ratio despite strong quick ratio
- Zero dividend yield
- Higher price-to-book ratio than ADI
ADI exhibits broad diversification and solid profitability metrics but faces challenges in capital efficiency and valuation. SLAB struggles with profitability and solvency but maintains a clean balance sheet and attractive valuation metrics. These contrasts highlight different strategic priorities and financial health profiles.
The Moat Duel: Analyzing Competitive Defensibility
A structural moat alone shields long-term profits from relentless competitive erosion in the semiconductor industry:
Analog Devices, Inc. (ADI): Intangible Assets and Engineering Excellence
ADI’s moat stems from deep intangible assets and R&D prowess. This manifests in stable 27% EBIT margins and 20% net margins. Growing ROIC signals improving profitability, yet ROIC remains below WACC. Expansion in industrial and automotive markets in 2026 could deepen its moat.
Silicon Laboratories Inc. (SLAB): Niche IoT Specialization and Innovation
SLAB’s moat relies on specialized mixed-signal solutions for IoT, contrasting ADI’s broader analog portfolio. Despite strong gross margins (58%), SLAB suffers from negative EBIT and net margins. Declining ROIC over recent years signals weakening profitability. Growth in wireless microcontrollers may offer future upside.
Moat Strength Showdown: Intangible Assets vs. Niche Innovation
I find ADI’s broader intangible asset base and improving ROIC craft a deeper moat than SLAB’s niche IoT focus and deteriorating profitability. ADI stands better positioned to defend market share amid intensifying industry competition.
Which stock offers better returns?
The past year shows robust price gains for both Analog Devices, Inc. (ADI) and Silicon Laboratories Inc. (SLAB), with clear acceleration phases and notable highs in their trading ranges.
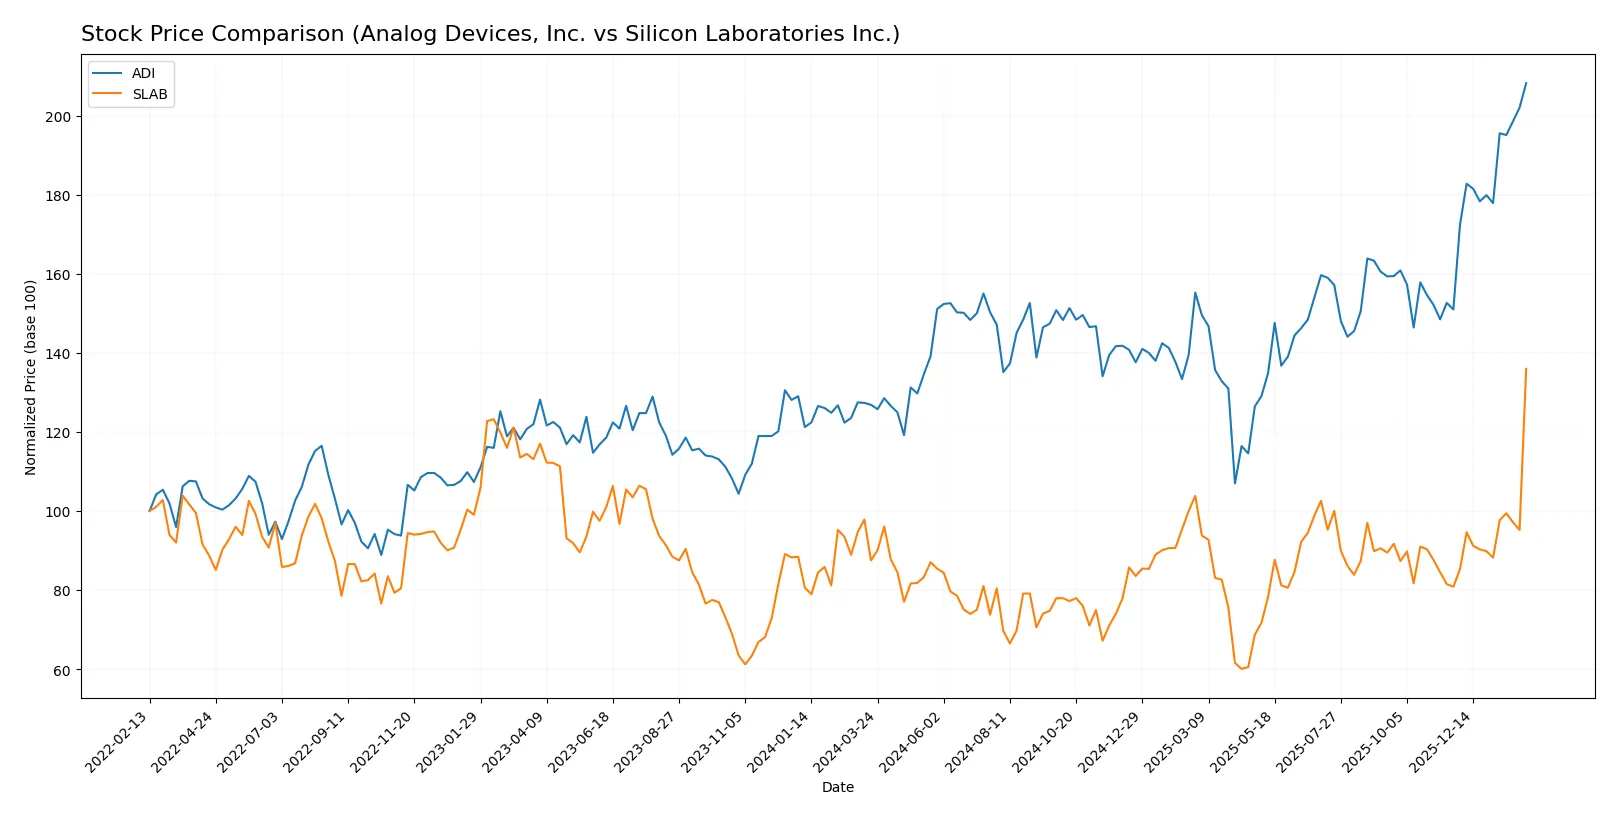
Trend Comparison
Analog Devices, Inc. (ADI) recorded a 64.16% price increase over 12 months, confirming a bullish trend with accelerating momentum and a high volatility level indicated by a 27.77 standard deviation.
Silicon Laboratories Inc. (SLAB) posted a 55.39% rise in stock price during the same period, also bullish and accelerating, but with lower volatility at a 16.05 standard deviation, reflecting steadier gains.
Both stocks show strong upward trends, yet ADI outperforms SLAB in total price appreciation, delivering the highest market return over the past year.
Target Prices
The consensus target prices for Analog Devices, Inc. and Silicon Laboratories Inc. indicate cautious optimism among analysts.
| Company | Target Low | Target High | Consensus |
|---|---|---|---|
| Analog Devices, Inc. | 270 | 375 | 316 |
| Silicon Laboratories Inc. | 130 | 231 | 174 |
Analysts expect Analog Devices to trade slightly below its current price of 320.44, while Silicon Laboratories’ consensus target of 174 suggests some downside risk from the current 203.41.

Don’t Let Luck Decide Your Entry Point
Optimize your entry points with our advanced ProRealTime indicators. You’ll get efficient buy signals with precise price targets for maximum performance. Start outperforming now!
How do institutions grade them?
Analog Devices, Inc. Grades
The following table summarizes recent grades from reputable financial institutions for Analog Devices, Inc.:
| Grading Company | Action | New Grade | Date |
|---|---|---|---|
| Susquehanna | maintain | Positive | 2026-01-22 |
| B of A Securities | maintain | Buy | 2026-01-21 |
| Stifel | maintain | Buy | 2026-01-16 |
| Oppenheimer | maintain | Outperform | 2026-01-16 |
| Citigroup | maintain | Buy | 2026-01-15 |
| Wells Fargo | upgrade | Overweight | 2026-01-15 |
| Keybanc | maintain | Overweight | 2026-01-13 |
| Truist Securities | maintain | Hold | 2025-12-19 |
| UBS | maintain | Buy | 2025-12-08 |
| Evercore ISI Group | maintain | Outperform | 2025-11-26 |
Silicon Laboratories Inc. Grades
The following table summarizes recent grades from reputable financial institutions for Silicon Laboratories Inc.:
| Grading Company | Action | New Grade | Date |
|---|---|---|---|
| Benchmark | downgrade | Hold | 2026-02-04 |
| Keybanc | downgrade | Sector Weight | 2026-02-04 |
| Needham | downgrade | Hold | 2026-02-04 |
| Susquehanna | maintain | Neutral | 2025-08-06 |
| Morgan Stanley | maintain | Equal Weight | 2025-08-06 |
| Barclays | maintain | Equal Weight | 2025-08-05 |
| Susquehanna | maintain | Neutral | 2025-07-22 |
| Stifel | maintain | Buy | 2025-07-18 |
| Keybanc | maintain | Overweight | 2025-07-08 |
| Benchmark | maintain | Buy | 2025-05-27 |
Which company has the best grades?
Analog Devices, Inc. holds stronger and more consistent grades, predominantly Buy and Outperform ratings with recent upgrades. Silicon Laboratories Inc. shows recent downgrades and more Neutral to Hold ratings, which may signal caution for investors.
Risks specific to each company
In the 2026 market environment, critical pressure points and systemic threats confront both Analog Devices, Inc. and Silicon Laboratories Inc. across distinct risk categories:
1. Market & Competition
Analog Devices, Inc.
- Large market cap (157B) supports competitive resilience but faces pricing pressure in semiconductors.
Silicon Laboratories Inc.
- Smaller market cap (6.7B) limits scale; high beta (1.56) signals vulnerability to sector swings.
2. Capital Structure & Debt
Analog Devices, Inc.
- Low debt-to-equity (0.26) and strong interest coverage (9.54) indicate prudent leverage management.
Silicon Laboratories Inc.
- Zero debt but negative interest coverage (-58.4) suggests operational losses impairing financial stability.
3. Stock Volatility
Analog Devices, Inc.
- Beta near 1.03 reflects market-aligned volatility, offering moderate risk exposure.
Silicon Laboratories Inc.
- Elevated beta of 1.56 implies higher stock price volatility and investor risk.
4. Regulatory & Legal
Analog Devices, Inc.
- Global presence exposes ADI to complex regulatory regimes but diversified markets mitigate localized risks.
Silicon Laboratories Inc.
- Fabless model reduces regulatory capital intensity but dependence on international sales exposes SLAB to trade policy risks.
5. Supply Chain & Operations
Analog Devices, Inc.
- Established manufacturing and distribution network supports operational stability amid global supply chain disruptions.
Silicon Laboratories Inc.
- Reliance on external foundries elevates supply chain risk and potential for production delays.
6. ESG & Climate Transition
Analog Devices, Inc.
- Larger scale enables greater ESG investments; no red flags but ongoing transition costs may pressure margins.
Silicon Laboratories Inc.
- Smaller firm may struggle with ESG compliance costs; limited data raises transparency concerns.
7. Geopolitical Exposure
Analog Devices, Inc.
- Broad international footprint subjects ADI to geopolitical tensions, notably US-China trade frictions.
Silicon Laboratories Inc.
- Concentrated exposure in US and China markets increases SLAB’s susceptibility to geopolitical shocks.
Which company shows a better risk-adjusted profile?
Analog Devices’ main risk lies in geopolitical tensions impacting its global supply chain, but its strong capital structure and moderate volatility underpin a robust risk profile. Silicon Laboratories faces severe profitability and financial stability challenges, with negative margins and poor interest coverage amplifying risk. ADI’s Altman Z-score (7.3) and Piotroski (7) confirm financial strength versus SLAB’s weaker scores. The market’s recent surge in SLAB’s stock price (+49%) contrasts with its deteriorating fundamentals, raising caution. Overall, ADI presents a more attractive risk-adjusted profile for prudent investors.
Final Verdict: Which stock to choose?
Analog Devices, Inc. (ADI) excels as a cash-generating powerhouse with a robust balance sheet and improving profitability. Its growing returns hint at operational strength, though its premium valuation demands vigilance. ADI suits portfolios seeking steady growth with moderate risk tolerance.
Silicon Laboratories Inc. (SLAB) boasts a strategic moat in niche R&D intensity, fueling rapid top-line expansion. However, it struggles with profitability and value destruction, posing higher risk than ADI. SLAB fits investors with a high risk appetite aiming for turnaround growth.
If you prioritize resilient cash flow and improving profitability, ADI outshines with better financial stability and operational efficiency. However, if you seek aggressive growth fueled by innovation and can tolerate earnings volatility, SLAB offers superior top-line momentum despite profitability challenges.
Disclaimer: Investment carries a risk of loss of initial capital. The past performance is not a reliable indicator of future results. Be sure to understand risks before making an investment decision.
Go Further
I encourage you to read the complete analyses of Analog Devices, Inc. and Silicon Laboratories Inc. to enhance your investment decisions: