In the dynamic semiconductor industry, Analog Devices, Inc. (ADI) and Qnity Electronics, Inc. (Q) stand out with distinct approaches to innovation and market presence. ADI, a seasoned leader in integrated circuits and signal processing, contrasts with Qnity, a recent entrant specializing in advanced electronic materials. This comparison sheds light on their strategies and growth potential, helping you decide which company aligns best with your investment goals.

Table of contents
Companies Overview
I will begin the comparison between Analog Devices, Inc. and Qnity Electronics, Inc. by providing an overview of these two companies and their main differences.
Analog Devices, Inc. Overview
Analog Devices, Inc. designs, manufactures, and markets integrated circuits and subsystems leveraging analog, mixed-signal, and digital signal processing technologies. The company serves diverse markets including industrial, automotive, consumer, aerospace, and communications. With a strong presence worldwide, Analog Devices is recognized for its data converters, power management products, amplifiers, and microelectromechanical systems, positioning it as a significant player in the semiconductors industry.
Qnity Electronics, Inc. Overview
Qnity Electronics, Inc. specializes in electronic solutions and materials used in semiconductor chip manufacturing and advanced electronic materials. Formerly known as Novus SpinCo 1, Inc., it rebranded in April 2025. Based in Wilmington, Delaware, Qnity operates in the semiconductor sector with a focus on supplying components critical to chip production. The company is relatively new, having gone public in late 2025.
Key similarities and differences
Both companies operate within the semiconductor industry, contributing to technology development with a focus on electronic components. Analog Devices offers a broad portfolio covering integrated circuits and subsystems for multiple applications, while Qnity concentrates on materials and solutions for semiconductor manufacturing. Analog Devices has a long-established market presence and a larger market cap of approximately 149B USD, contrasted with Qnity’s recent IPO and 19.5B USD valuation.
Income Statement Comparison
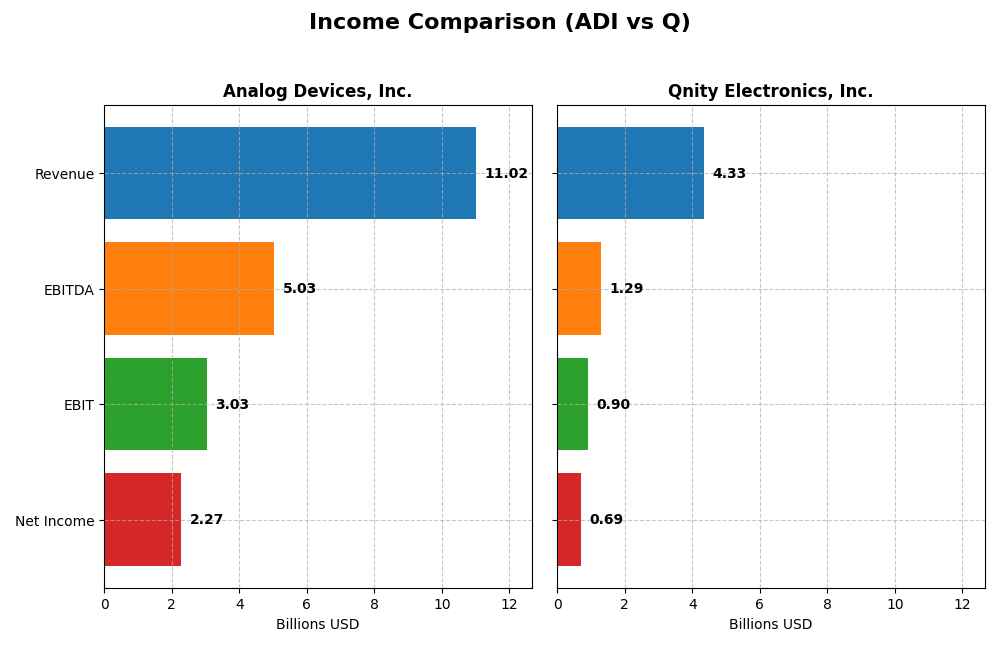
The table below presents a side-by-side comparison of key income statement metrics for Analog Devices, Inc. and Qnity Electronics, Inc. for their most recent fiscal years.
| Metric | Analog Devices, Inc. (ADI) | Qnity Electronics, Inc. (Q) |
|---|---|---|
| Market Cap | 149.4B | 19.5B |
| Revenue | 11.0B | 4.3B |
| EBITDA | 5.03B | 1.29B |
| EBIT | 3.03B | 898M |
| Net Income | 2.27B | 693M |
| EPS | 4.59 | 3.31 |
| Fiscal Year | 2025 | 2024 |
Income Statement Interpretations
Analog Devices, Inc.
Analog Devices, Inc. showed a consistent upward trend in revenue and net income from 2021 to 2025, with revenue rising from $7.3B to $11B and net income increasing from $1.39B to $2.27B. Margins improved, notably the net margin reaching 20.58% in 2025. The most recent year saw a 16.9% revenue growth and an 18.6% net margin expansion, indicating solid operational performance.
Qnity Electronics, Inc.
Qnity Electronics experienced fluctuating revenue between 2022 and 2024, ending at $4.34B, down from $4.76B in 2022, with net income decreasing from $774M to $693M. Margins remain stable but lower than its peer, with a net margin of 15.99% in 2024. The latest year recorded moderate 7.4% revenue growth but favorable increases in net margin and earnings per share, reflecting some efficiency gains.
Which one has the stronger fundamentals?
Analog Devices, Inc. exhibits stronger fundamentals with consistent revenue and net income growth, alongside favorable margin improvements and a robust net margin above 20%. Qnity Electronics, despite recent positive margin growth, shows overall declining revenue and net income over the period. The comprehensive favorable income statement evaluation for Analog Devices contrasts with mixed results for Qnity, highlighting the former’s more stable financial footing.
Financial Ratios Comparison
The table below presents the most recent key financial ratios for Analog Devices, Inc. (ADI) and Qnity Electronics, Inc. (Q) based on their latest fiscal year data.
| Ratios | Analog Devices, Inc. (ADI) | Qnity Electronics, Inc. (Q) |
|---|---|---|
| ROE | 6.7% | 6.5% |
| ROIC | 5.5% | 5.9% |
| P/E | 51.1 | 28.8 |
| P/B | 3.42 | 1.88 |
| Current Ratio | 2.19 | 1.77 |
| Quick Ratio | 1.68 | 1.06 |
| D/E | 0.26 | 0.02 |
| Debt-to-Assets | 18.1% | 1.6% |
| Interest Coverage | 9.45 | 3.03 |
| Asset Turnover | 0.23 | 0.35 |
| Fixed Asset Turnover | 3.32 | 2.59 |
| Payout ratio | 84.9% | 0% |
| Dividend yield | 1.66% | 0% |
Interpretation of the Ratios
Analog Devices, Inc.
Analog Devices shows a mix of strong and weak ratios. Its net margin of 20.58% and current ratio of 2.19 indicate solid profitability and liquidity, while its return on equity (6.7%) and price-to-earnings ratio (51.05) raise concerns. The company maintains a stable dividend yield of 1.66%, supported by consistent payouts, but investors should watch for risks tied to high valuation multiples.
Qnity Electronics, Inc.
Qnity Electronics presents mostly favorable liquidity and leverage ratios, including a low debt-to-assets ratio of 1.56% and a current ratio of 1.77. Despite a reasonable net margin of 15.99%, its dividend yield is zero, reflecting a no-dividend policy likely due to reinvestment or growth focus. Price-to-earnings at 28.8 and asset turnover weaknesses warrant attention.
Which one has the best ratios?
Both companies exhibit slightly favorable overall ratios, but Analog Devices benefits from stronger profitability and liquidity metrics, offset by higher valuation multiples. Qnity Electronics is more conservative in leverage and reinvests earnings, lacking dividend returns. The choice depends on investor priorities between yield, valuation, and growth orientation.
Strategic Positioning
This section compares the strategic positioning of Analog Devices, Inc. and Qnity Electronics, Inc., focusing on market position, key segments, and exposure to technological disruption:
Analog Devices, Inc.
- Large market cap of 149B in semiconductors, facing typical industry competitive pressure.
- Diverse product segments: automotive, industrial, communications, consumer markets drive revenues.
- Positioned in advanced analog and mixed-signal technologies, exposed to innovation in semiconductors.
Qnity Electronics, Inc.
- Smaller market cap of 19.5B, newly public, competing in semiconductor materials sector.
- Focused on electronic solutions and materials for semiconductor chip manufacturing.
- Exposure concentrated in advanced electronic materials, with potential disruption from evolving chip tech.
Analog Devices, Inc. vs Qnity Electronics, Inc. Positioning
Analog Devices benefits from a diversified segment strategy across multiple end markets, providing broader revenue streams. Qnity Electronics maintains a concentrated focus on semiconductor materials, which limits diversification but may allow specialization advantages.
Which has the best competitive advantage?
Based on MOAT evaluation, Analog Devices shows slightly unfavorable moat with value destruction but improving profitability, while Qnity Electronics has a neutral moat with stable profitability and no clear competitive advantage yet.
Stock Comparison
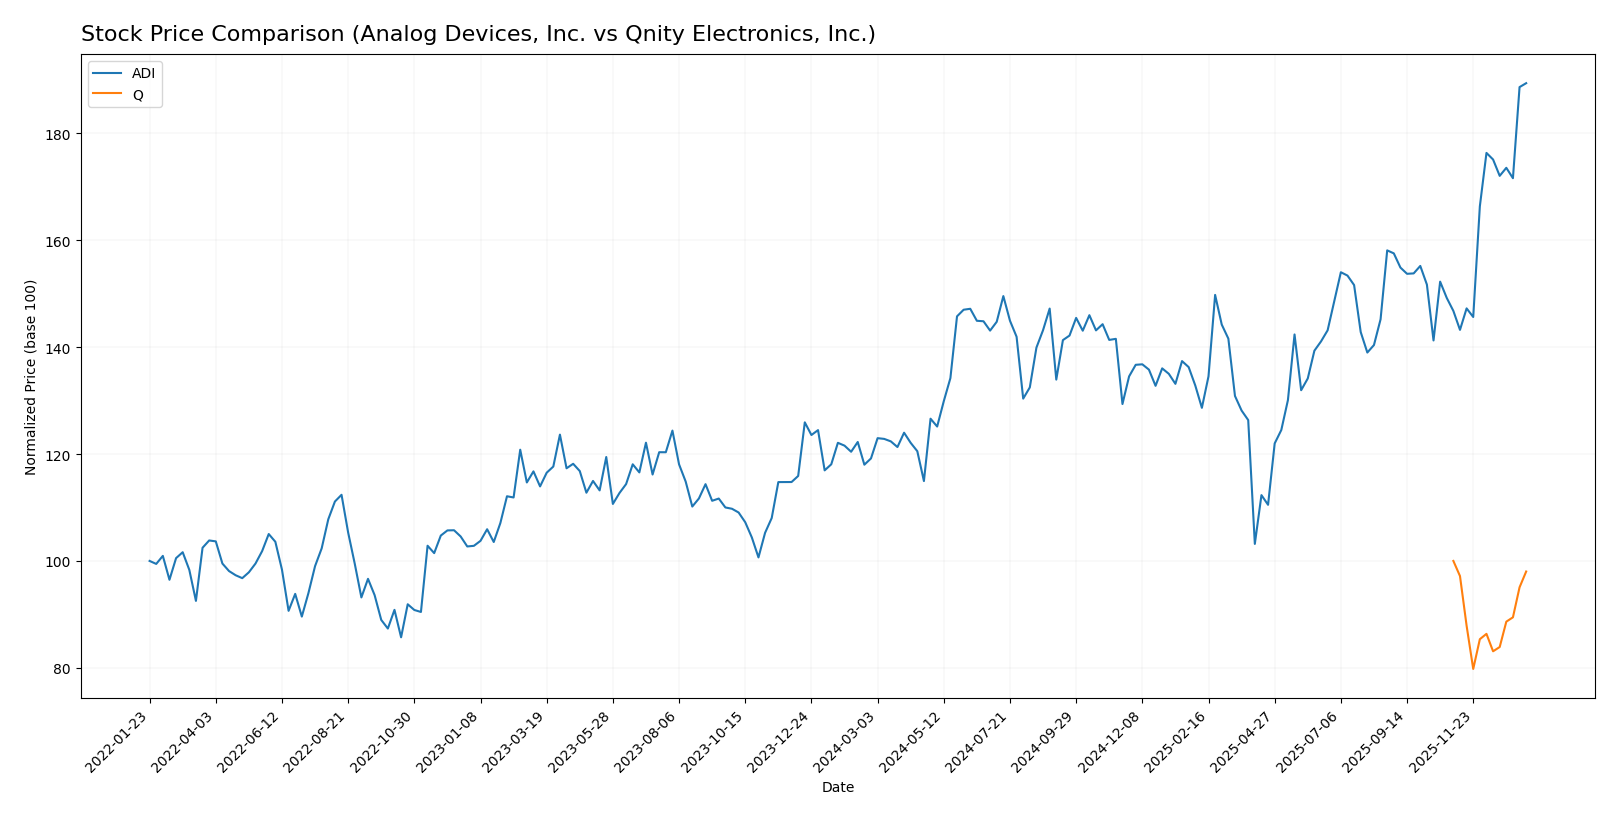
The past year saw Analog Devices, Inc. (ADI) exhibit a strong bullish trend with significant price appreciation and accelerating momentum, while Qnity Electronics, Inc. (Q) maintained a nearly flat, slightly bearish performance with stable trading dynamics.
Trend Analysis
Analog Devices, Inc. (ADI) experienced a 58.91% price increase over the past 12 months, indicating a bullish trend with accelerating momentum and notable volatility (std deviation 24.21). The stock ranged between 164.6 and 302.1.
Qnity Electronics, Inc. (Q) recorded a -1.98% price change over the same period, reflecting a bearish trend with stable acceleration and lower volatility (std deviation 5.94). Its price fluctuated between 75.8 and 95.0.
Comparing both, ADI delivered the highest market performance with a strong bullish trend, while Q showed a marginally bearish trend and less dynamic price movement.
Target Prices
Here is the current consensus on target prices from verified analysts for selected semiconductor companies.
| Company | Target High | Target Low | Consensus |
|---|---|---|---|
| Analog Devices, Inc. | 375 | 270 | 304.73 |
| Qnity Electronics, Inc. | 117 | 92 | 105.89 |
Analysts expect Analog Devices to trade moderately above its current price of $302.1, while Qnity Electronics shows upside potential compared to its current $93.12 price, indicating positive market sentiment for both.
Analyst Opinions Comparison
This section compares analysts’ ratings and grades for Analog Devices, Inc. and Qnity Electronics, Inc.:
Rating Comparison
Analog Devices, Inc. Rating
- Rating: B-, classified as very favorable.
- Discounted Cash Flow Score: 4, favorable rating.
- Return on Equity Score: 3, moderate rating.
- Return on Assets Score: 3, moderate rating.
- Debt To Equity Score: 2, moderate rating.
- Overall Score: 3, moderate rating.
Qnity Electronics, Inc. Rating
- Rating: B+, classified as very favorable.
- Discounted Cash Flow Score: 4, favorable rating.
- Return on Equity Score: 3, moderate rating.
- Return on Assets Score: 4, favorable rating.
- Debt To Equity Score: 3, moderate rating.
- Overall Score: 3, moderate rating.
Which one is the best rated?
Qnity Electronics, Inc. holds a higher overall rating (B+) than Analog Devices, Inc. (B-), with a stronger return on assets and better debt-to-equity score, indicating a slightly more favorable analyst assessment.
Scores Comparison
Here is the comparison of the company scores based on Altman Z-Score and Piotroski Score:
ADI Scores
- Altman Z-Score: 6.99, placing ADI in the safe zone.
- Piotroski Score: 7, indicating strong financial health.
Q Scores
- No data available.
- No data available.
Which company has the best scores?
Based strictly on the provided data, ADI has clearly defined scores showing strong financial health and low bankruptcy risk. No scores are available for Q, so no comparison is possible.
Grades Comparison
Here is a comparison of the recent grades assigned to Analog Devices, Inc. and Qnity Electronics, Inc.:
Analog Devices, Inc. Grades
The table below shows the latest grades from multiple reputable grading companies for Analog Devices, Inc.:
| Grading Company | Action | New Grade | Date |
|---|---|---|---|
| Keybanc | Maintain | Overweight | 2026-01-13 |
| Truist Securities | Maintain | Hold | 2025-12-19 |
| UBS | Maintain | Buy | 2025-12-08 |
| Wells Fargo | Maintain | Equal Weight | 2025-11-26 |
| B of A Securities | Maintain | Buy | 2025-11-26 |
| Evercore ISI Group | Maintain | Outperform | 2025-11-26 |
| JP Morgan | Maintain | Overweight | 2025-11-26 |
| Baird | Maintain | Outperform | 2025-11-26 |
| Benchmark | Maintain | Buy | 2025-11-26 |
| Truist Securities | Maintain | Hold | 2025-11-26 |
Overall, Analog Devices, Inc. maintains a predominantly positive outlook with a consensus grading leaning towards Buy and Outperform ratings.
Qnity Electronics, Inc. Grades
The following grades are recent evaluations from recognized grading companies for Qnity Electronics, Inc.:
| Grading Company | Action | New Grade | Date |
|---|---|---|---|
| RBC Capital | Maintain | Outperform | 2025-11-25 |
| Mizuho | Maintain | Outperform | 2025-11-20 |
Qnity Electronics, Inc. shows consistent Outperform ratings, reflected in its consensus Buy rating from a smaller sample of analysts.
Which company has the best grades?
Analog Devices, Inc. has a broader range of analyst coverage with a mix of Buy and Outperform ratings, while Qnity Electronics, Inc. has fewer but consistently Outperform grades. This suggests stronger analyst conviction for Qnity from a smaller panel, whereas Analog Devices enjoys wider but slightly more varied support, impacting investor perception of stability and growth potential differently.
Strengths and Weaknesses
Below is a comparative overview of key strengths and weaknesses for Analog Devices, Inc. (ADI) and Qnity Electronics, Inc. (Q), based on the most recent financial and operational data.
| Criterion | Analog Devices, Inc. (ADI) | Qnity Electronics, Inc. (Q) |
|---|---|---|
| Diversification | Strong diversification with significant revenues from Automotive (2.83B), Industrial (4.31B), Consumer (1.20B), Communications (1.08B) segments | Less diversified, product segmentation data unavailable, likely more concentrated |
| Profitability | Net margin favorable at 20.58%, ROIC neutral at 5.55%, but ROIC below WACC indicating value destruction | Net margin favorable at 15.99%, ROIC neutral at 5.92%, ROIC slightly above WACC indicating stable profitability |
| Innovation | Moderate innovation impact; ROIC trend growing 64.2% over recent years but still shedding value overall | Innovation impact neutral; stable ROIC trend, no clear competitive advantage yet |
| Global presence | Large global footprint supported by diverse industrial and automotive client base | Global presence less clear; financials suggest smaller scale and more regional focus |
| Market Share | Strong in analog and industrial electronics markets with growing revenues in key segments | Market share likely smaller and more niche-focused given limited revenue data |
Key takeaways: Analog Devices shows strong diversification and growing profitability trends but still struggles to create overall value above its cost of capital. Qnity Electronics maintains stable profitability with a slightly favorable moat status but lacks demonstrated competitive advantages and diversification. Both companies require cautious evaluation focusing on risk management before investment.
Risk Analysis
Below is a comparative table of key risks for Analog Devices, Inc. (ADI) and Qnity Electronics, Inc. (Q) based on the most recent data available.
| Metric | Analog Devices, Inc. (ADI) | Qnity Electronics, Inc. (Q) |
|---|---|---|
| Market Risk | Moderate (Beta 1.03) | Low (Beta 0) |
| Debt Level | Low (Debt-to-Equity 0.26) | Very Low (Debt-to-Equity 0.02) |
| Regulatory Risk | Moderate (Global operations) | Moderate (Newly public, regulatory adaptation) |
| Operational Risk | Moderate (24K employees, complex manufacturing) | Moderate (New market entrant, smaller scale) |
| Environmental Risk | Moderate (Semiconductor industry impact) | Moderate (Material supplier, environmental compliance) |
| Geopolitical Risk | Moderate (Global supply chain exposure) | Moderate (US-based, limited global footprint) |
The most impactful risks are market volatility for ADI given its beta near 1 and geopolitical tensions affecting supply chains in semiconductors. Q benefits from very low debt but faces operational risks as a recent IPO with less established market presence. Both companies have moderate regulatory and environmental risks typical for their industry. Careful diversification and monitoring of global trade conditions are advisable.
Which Stock to Choose?
Analog Devices, Inc. (ADI) shows a strong income evolution with 16.9% revenue growth in 2025 and favorable profitability metrics, including a 20.58% net margin. Its financial ratios are slightly favorable overall, supported by low debt and solid liquidity, though some valuation ratios appear unfavorable. The company’s MOAT rating is slightly unfavorable, indicating value destruction despite growing profitability, and it holds a very favorable B- rating.
Qnity Electronics, Inc. (Q) exhibits moderate income growth with a 7.4% revenue increase in 2024 but an overall period decline in net income. Its financial ratios are slightly favorable but with more neutral and unfavorable aspects compared to ADI. The MOAT rating is neutral, suggesting stable profitability without a clear competitive advantage, and it has a very favorable B+ rating.
Investors prioritizing growth and strong income statement performance might find ADI’s profile more appealing, given its higher revenue growth and profitability trends, while those valuing a stable competitive position with moderate financial ratios could view Q as more suitable. The choice may depend on whether an investor prefers growth dynamics or steadier, stable earnings.
Disclaimer: Investment carries a risk of loss of initial capital. The past performance is not a reliable indicator of future results. Be sure to understand risks before making an investment decision.
Go Further
I encourage you to read the complete analyses of Analog Devices, Inc. and Qnity Electronics, Inc. to enhance your investment decisions: