Home > Comparison > Technology > ADI vs NXPI
The strategic rivalry between Analog Devices, Inc. and NXP Semiconductors N.V. shapes the semiconductor industry’s evolution. Analog Devices operates as a specialized, innovation-driven designer of analog and mixed-signal ICs, while NXP focuses on a broader semiconductor portfolio emphasizing microcontrollers and connectivity solutions. This analysis pits Analog Devices’ precision analog expertise against NXP’s diversified chip offerings to identify which firm presents a superior risk-adjusted investment case within the technology sector.

Table of contents
Companies Overview
Analog Devices and NXP Semiconductors represent critical players in the semiconductor industry, driving innovation across diverse technology sectors.
Analog Devices, Inc.: Leader in Analog and Mixed-Signal ICs
Analog Devices dominates the market with its integrated circuits that convert analog signals to digital and back. It earns revenue mainly by supplying high-performance amplifiers, power management ICs, and sensors to automotive, industrial, and communications sectors. In 2026, its strategic focus centers on leveraging signal processing technologies to enhance energy management and connectivity solutions globally.
NXP Semiconductors N.V.: Innovator in Microcontrollers and Connectivity
NXP Semiconductors excels in microcontrollers, communication processors, and wireless connectivity solutions like near-field communication and Bluetooth. Its revenue engine depends on serving automotive, IoT, and industrial markets with advanced semiconductor products. The company emphasized expanding its product portfolio in 2026 to capture growth in mobile and communication infrastructure applications worldwide.
Strategic Collision: Similarities & Divergences
Both firms emphasize semiconductor innovation but differ in approach: Analog Devices prioritizes analog signal precision while NXP focuses on connectivity and digital integration. Their primary battleground lies in automotive and industrial sectors where sensor accuracy meets communication demands. Investors face distinct profiles—Analog Devices offers stability through niche analog expertise, whereas NXP bets on broad exposure to IoT and wireless technologies.
Income Statement Comparison
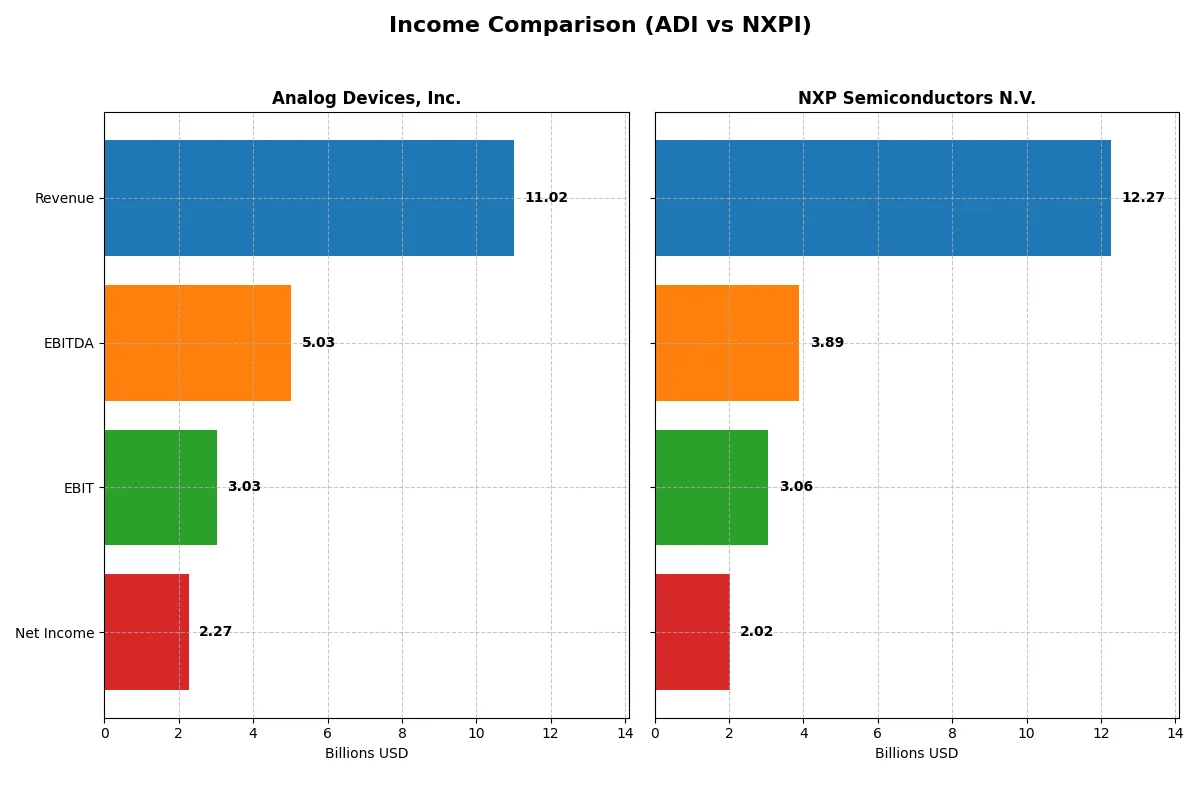
This data dissects the core profitability and scalability of both corporate engines to reveal who dominates the bottom line:
| Metric | Analog Devices, Inc. (ADI) | NXP Semiconductors N.V. (NXPI) |
|---|---|---|
| Revenue | 11.0B | 12.3B |
| Cost of Revenue | 5.0B | 5.6B |
| Operating Expenses | 3.0B | 3.4B |
| Gross Profit | 6.0B | 6.7B |
| EBITDA | 5.0B | 3.9B |
| EBIT | 3.0B | 3.1B |
| Interest Expense | 318M | 384M |
| Net Income | 2.3B | 2.0B |
| EPS | 4.59 | 8.00 |
| Fiscal Year | 2025 | 2025 |
Income Statement Analysis: The Bottom-Line Duel
This income statement comparison reveals which company operates its business most efficiently, converting sales into profit with sustained momentum.
Analog Devices, Inc. Analysis
Analog Devices (ADI) grew revenue by 17% in 2025 to $11B, with net income surging 39% to $2.27B. Its gross margin stands strong at 54.7%, while net margin expanded to 20.6%, signaling robust profitability. ADI’s operating efficiency accelerated sharply, with EBIT rising 44%, reflecting effective cost control and solid earnings momentum.
NXP Semiconductors N.V. Analysis
NXP (NXPI) reported a revenue decline of nearly 3% to $12.3B in 2025, with net income dropping 18% to $2B. Its gross margin holds steady at 54.4%, but net margin contracted to 16.5%, indicating margin pressure. EBIT fell 12%, marking a loss of momentum and highlighting challenges in maintaining expense discipline amid softer top-line growth.
Margin Resilience vs. Top-Line Traction
ADI outpaces NXPI in revenue growth, profitability, and margin expansion, posting a sharper earnings rebound and superior net margin. NXPI’s recent top-line contraction and margin compression weigh on its earnings power. Investors seeking consistent margin resilience and earnings acceleration will find ADI’s profile more attractive in this comparison.
Financial Ratios Comparison
These vital ratios act as a diagnostic tool to expose the underlying fiscal health, valuation premiums, and capital efficiency of the companies compared below:
| Ratios | Analog Devices, Inc. (ADI) | NXP Semiconductors N.V. (NXPI) |
|---|---|---|
| ROE | 6.7% | 20.1% |
| ROIC | 5.5% | 11.0% |
| P/E | 51.1 | 27.1 |
| P/B | 3.42 | 5.45 |
| Current Ratio | 2.19 | 2.05 |
| Quick Ratio | 1.68 | 1.38 |
| D/E | 0.26 | 1.22 |
| Debt-to-Assets | 18.1% | 46.0% |
| Interest Coverage | 9.45 | 8.62 |
| Asset Turnover | 0.23 | 0.46 |
| Fixed Asset Turnover | 3.32 | 4.12 |
| Payout ratio | 84.9% | 50.7% |
| Dividend yield | 1.66% | 1.87% |
| Fiscal Year | 2025 | 2025 |
Efficiency & Valuation Duel: The Vital Signs
Ratios serve as a company’s financial DNA, revealing hidden risks and operational strengths critical to investment decisions.
Analog Devices, Inc.
Analog Devices posts a solid net margin of 20.6% but a modest ROE of 6.7%, indicating moderate profitability. Its P/E ratio of 51.05 signals an expensive valuation, stretched beyond typical sector averages. Shareholders receive a 1.66% dividend yield, reflecting balanced returns amid ongoing R&D investments at 16% of revenue.
NXP Semiconductors N.V.
NXP demonstrates stronger core profitability with a 20.1% ROE and an 11.0% ROIC, showcasing operational efficiency. Its P/E at 27.14 remains high but less stretched than Analog Devices. NXP yields 1.87% in dividends, balancing shareholder payback with a healthy 18% R&D spend supporting growth initiatives.
Premium Valuation vs. Operational Efficiency
Both companies present slightly favorable ratio profiles with half their metrics positive and around 29% unfavorable. Analog Devices’ valuation appears stretched, while NXP offers superior profitability and efficient capital use. Investors prioritizing growth and operational strength may favor NXP, whereas those valuing dividend income with steady R&D might lean toward Analog Devices.
Which one offers the Superior Shareholder Reward?
I observe that Analog Devices (ADI) and NXP Semiconductors (NXPI) both pay dividends with similar yields near 1.6–1.9%. ADI’s payout ratio runs high at ~85%, signaling aggressive dividend returns but limited free cash flow (FCF) coverage. NXPI’s payout ratio is lower, around 30–50%, preserving more FCF for reinvestment or buybacks. Both companies deploy substantial buybacks; however, NXPI’s stronger FCF per share ($9.6B vs. ADI’s $8.7B) and moderate payout suggest a more sustainable model. NXPI’s higher leverage raises risk but supports capital returns. I conclude NXPI offers a superior total return profile in 2026 due to balanced dividends and robust buybacks fueling long-term value.
Comparative Score Analysis: The Strategic Profile
The radar chart reveals the fundamental DNA and trade-offs of Analog Devices, Inc. and NXP Semiconductors N.V., highlighting their financial strengths and valuation nuances:
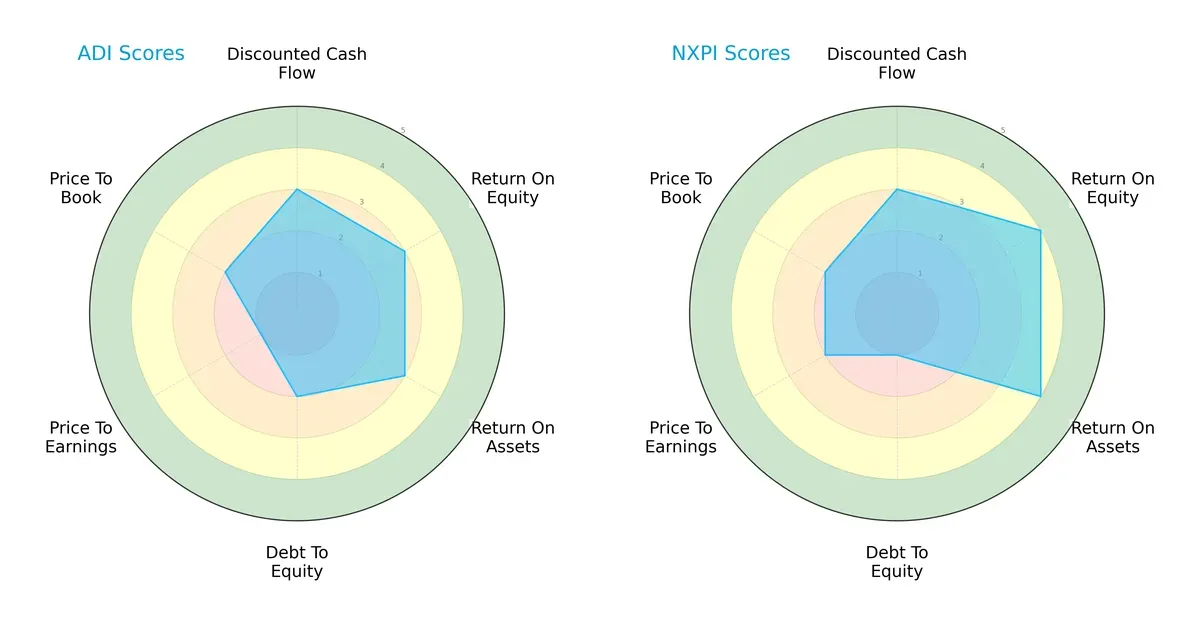
NXP Semiconductors shows stronger profitability with superior ROE (4 vs. 3) and ROA (4 vs. 3) scores, reflecting more efficient asset and equity utilization. Analog Devices holds a moderate debt profile (score 2) versus NXP’s weaker debt-to-equity standing (score 1), signaling higher leverage risk for NXP. Valuation metrics favor NXP slightly in P/E but both match on P/B. Overall, NXP’s profile is more growth-oriented but relies on higher leverage, while Analog Devices offers a more balanced, conservative risk-return mix.
Bankruptcy Risk: Solvency Showdown
The Altman Z-Score difference indicates Analog Devices (7.29) enjoys a much safer solvency position than NXP Semiconductors (3.10), both in the safe zone but with a clear margin:
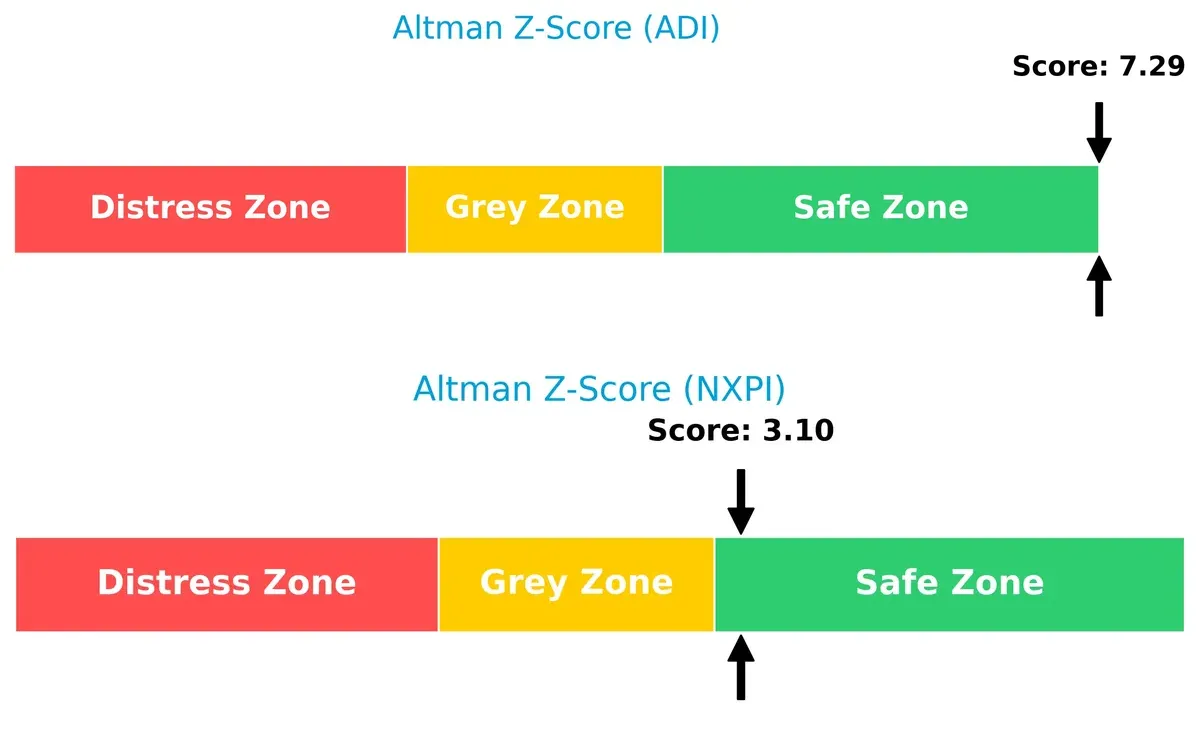
I interpret this as Analog Devices having a more robust buffer against downturns, reflecting stronger financial stability in this late-cycle environment. NXP’s score, while safe, suggests more vulnerability to adverse shocks due to its higher leverage and operational risks.
Financial Health: Quality of Operations
Analog Devices scores a strong 7 on the Piotroski F-Score, indicating solid internal financial health. NXP’s score of 5 is average, signaling some caution:
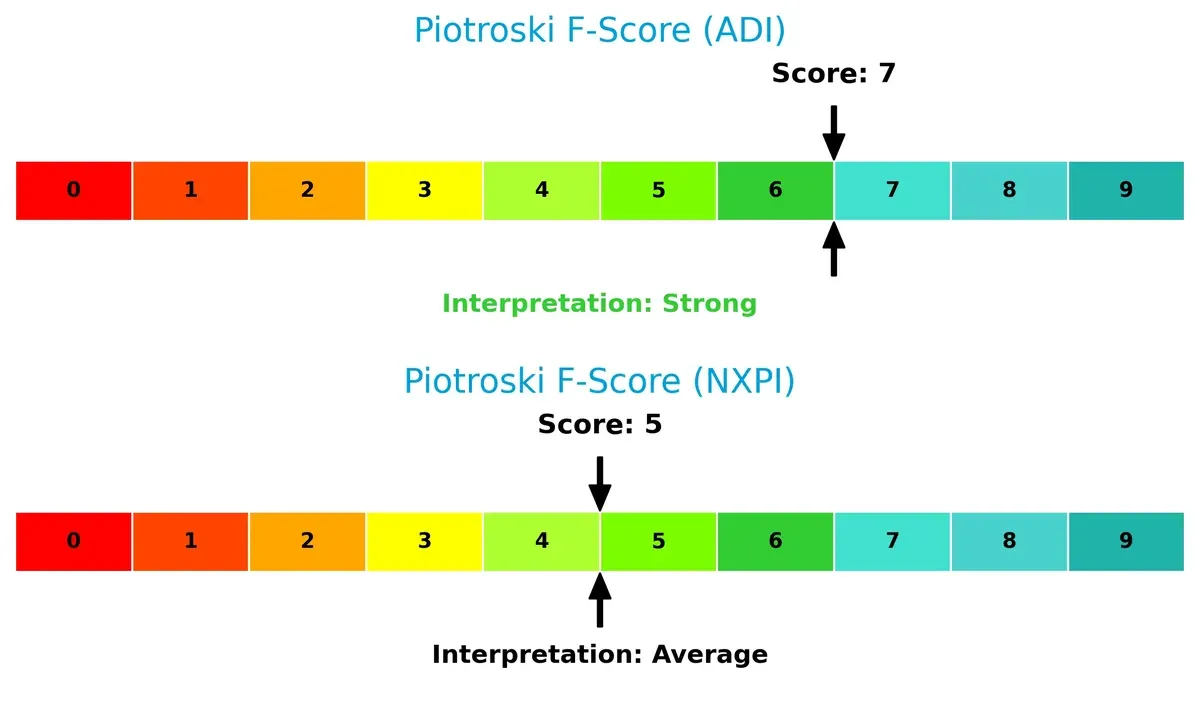
This gap suggests Analog Devices maintains better profitability, liquidity, and efficiency metrics. Investors should note potential red flags in NXP’s operational quality relative to Analog Devices, which could affect resilience in volatile markets.
How are the two companies positioned?
This section dissects ADI and NXPI’s operational DNA by comparing their revenue distribution by segment and internal strengths and weaknesses. The goal is to confront their economic moats to identify which business model offers the most resilient, sustainable advantage in today’s market.
Revenue Segmentation: The Strategic Mix
This visual comparison dissects how Analog Devices, Inc. and NXP Semiconductors N.V. diversify their income streams and where their primary sector bets lie:
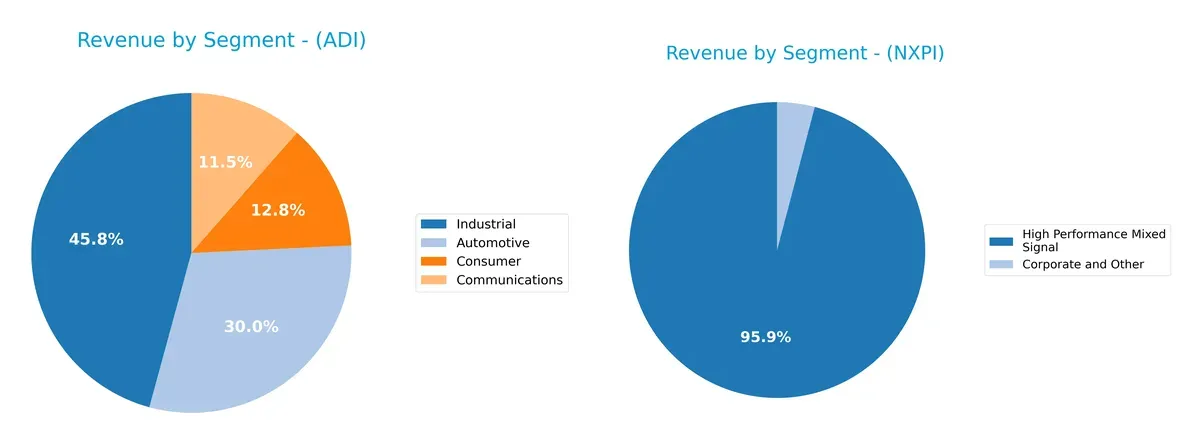
Analog Devices anchors its revenue in Industrial at $4.3B, with significant contributions from Automotive ($2.8B), Consumer ($1.2B), and Communications ($1.1B), reflecting a balanced, diversified portfolio. NXP Semiconductors pivots heavily on High Performance Mixed Signal, generating $9.0B, dwarfing its Corporate and Other segment at $385M. ADI’s multi-sector exposure reduces concentration risk, while NXPI’s reliance on one segment signals ecosystem lock-in but exposes it to sector-specific volatility.
Strengths and Weaknesses Comparison
This table compares the Strengths and Weaknesses of Analog Devices, Inc. (ADI) and NXP Semiconductors N.V. (NXPI):
ADI Strengths
- Diversified revenue across Automotive, Industrial, Communications, and Consumer segments
- Favorable net margin at 20.58%
- Strong liquidity ratios with current ratio 2.19 and quick ratio 1.68
- Low debt-to-equity ratio of 0.26 indicating conservative leverage
- Favorable interest coverage of 9.54
- Global presence with balanced sales in US, China, Europe, Japan
NXPI Strengths
- Strong profitability metrics including ROE 20.1% and ROIC 11.03%
- Favorable net margin at 16.47% and solid liquidity ratios
- Higher fixed asset turnover at 4.12 indicating efficient asset use
- Global footprint with significant sales in China, US, and Europe
- Favorable interest coverage ratio at 7.97
- Revenue concentrated in High Performance Mixed Signal segment
ADI Weaknesses
- Unfavorable ROE at 6.7% below cost of capital
- PE ratio high at 51.05 suggesting overvaluation risk
- Unfavorable price-to-book ratio at 3.42
- Asset turnover low at 0.23 indicating less efficient asset use
- Moderate dividend yield at 1.66%
- Limited innovation insight from data
NXPI Weaknesses
- Unfavorable price-to-book ratio at 5.45 indicating high valuation
- High debt-to-equity ratio of 1.22 increasing financial risk
- Asset turnover at 0.46 remains below ideal efficiency
- PE ratio at 27.14 still relatively high
- Dividend yield neutral at 1.87%
- Revenue less diversified, heavily reliant on one segment
Overall, both companies demonstrate slightly favorable financial profiles with strong liquidity and global sales. ADI shows more diversification but struggles with return on equity and valuation metrics. NXPI excels in profitability and asset efficiency but carries higher financial leverage and valuation risks. These differences shape each firm’s strategic focus on balancing growth, risk, and capital structure.
The Moat Duel: Analyzing Competitive Defensibility
A structural moat alone protects long-term profits from relentless competition and market forces. Let’s dissect the nature of these moats:
Analog Devices, Inc. (ADI): Innovation-Driven Intangible Assets
ADI’s moat centers on its proprietary analog and mixed-signal technology, reflected in stable 54.7% gross margins and rising EBIT margins near 27.5%. Despite shedding value versus WACC, its growing ROIC trend signals improving capital efficiency. Expansion into automotive and industrial IoT markets in 2026 could deepen this intangible asset moat.
NXP Semiconductors N.V. (NXPI): Scale-Enabled Cost Advantage
NXPI leverages scale and diversified product portfolio across automotive and connectivity, shown by solid 54.4% gross margins and 25% EBIT margins. Unlike ADI, NXPI’s ROIC trails WACC with a declining trend, indicating weakening profitability. Market headwinds in 2025 hurt growth, but strategic investments in security controllers may offer a turnaround opportunity.
Moat Quality Faceoff: Intangible Assets vs. Scale Cost Advantage
ADI’s innovation-based intangible asset moat is deeper, supported by margin expansion and ROIC improvement despite value shedding. NXPI’s cost advantage falters under margin pressure and deteriorating capital returns. I find ADI better equipped to defend and grow its market share amid intensifying semiconductor competition.
Which stock offers better returns?
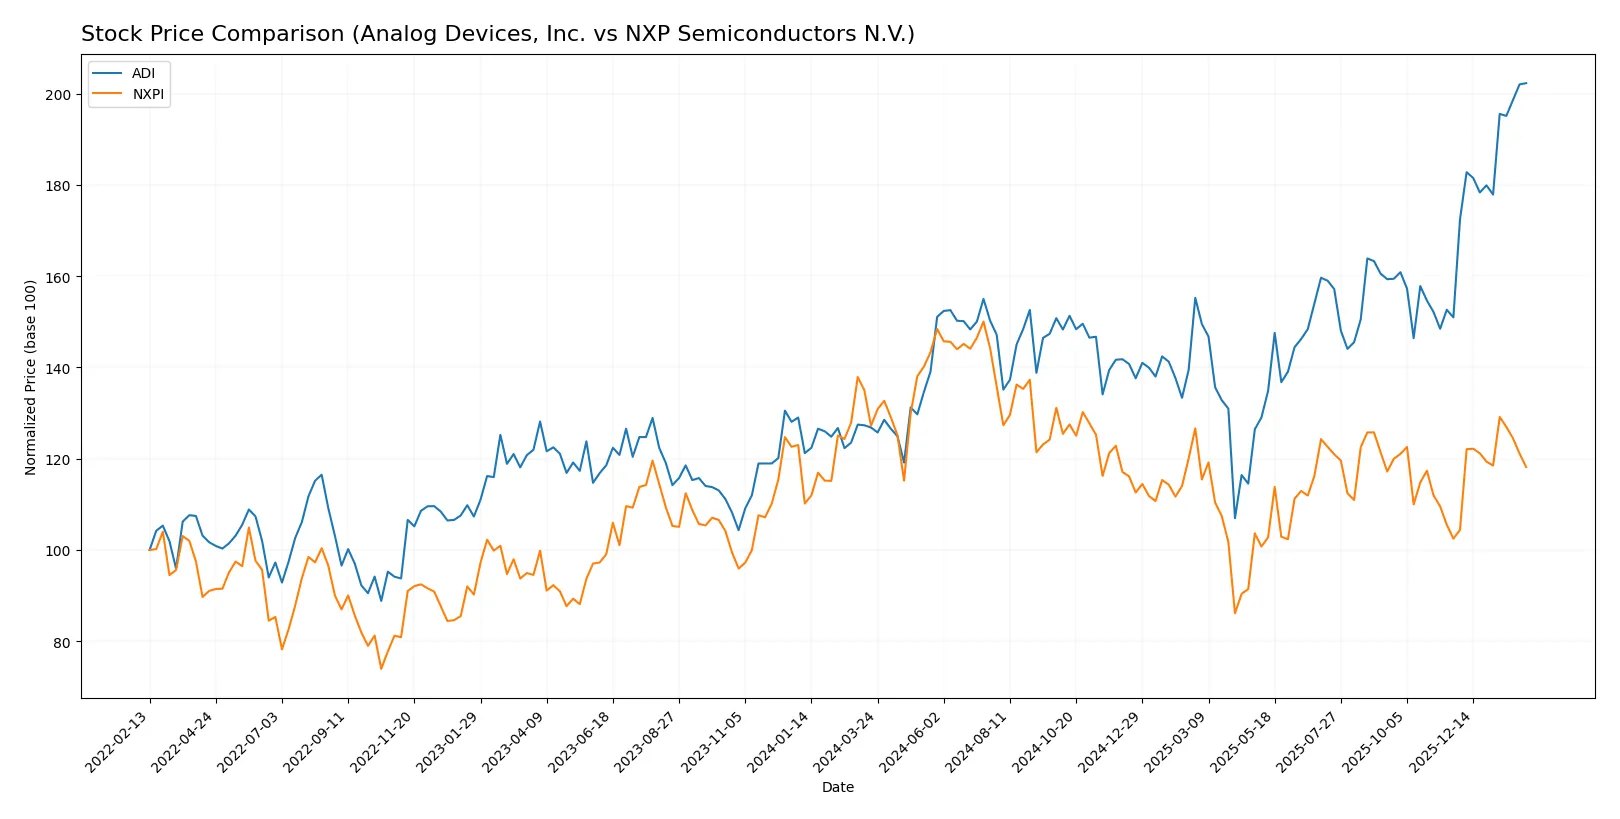
The stock price chart highlights Analog Devices’ strong upward trajectory and NXP Semiconductors’ contrasting decline over the past year, reflecting divergent market dynamics and investor sentiment.
Trend Comparison
Analog Devices, Inc. (ADI) shows a bullish trend with a 59.47% price gain over 12 months. The trend accelerates, reaching a high of 311.29 and maintaining strong volatility with a 27.48 standard deviation.
NXP Semiconductors N.V. (NXPI) experiences a bearish trend, losing 7.11% over the same period. Despite acceleration, the price fell from a high of 280.19, accompanied by a 24.1 standard deviation, indicating persistent volatility.
Comparing the two, ADI outperforms NXPI significantly, delivering the highest market return and a robust upward momentum over the last year.
Target Prices
Analysts present a constructive target price consensus for these semiconductor leaders.
| Company | Target Low | Target High | Consensus |
|---|---|---|---|
| Analog Devices, Inc. | 270 | 375 | 316 |
| NXP Semiconductors N.V. | 215 | 280 | 245 |
The consensus targets suggest moderate upside potential for Analog Devices and NXP compared to current prices of $311 and $221, respectively. Analysts expect steady growth despite recent market volatility.

Don’t Let Luck Decide Your Entry Point
Optimize your entry points with our advanced ProRealTime indicators. You’ll get efficient buy signals with precise price targets for maximum performance. Start outperforming now!
How do institutions grade them?
The following tables summarize recent institutional grades for Analog Devices, Inc. and NXP Semiconductors N.V.:
Analog Devices, Inc. Grades
These grades reflect the latest analyst opinions on Analog Devices, Inc.:
| Grading Company | Action | New Grade | Date |
|---|---|---|---|
| Susquehanna | Maintain | Positive | 2026-01-22 |
| B of A Securities | Maintain | Buy | 2026-01-21 |
| Stifel | Maintain | Buy | 2026-01-16 |
| Oppenheimer | Maintain | Outperform | 2026-01-16 |
| Citigroup | Maintain | Buy | 2026-01-15 |
| Wells Fargo | Upgrade | Overweight | 2026-01-15 |
| Keybanc | Maintain | Overweight | 2026-01-13 |
| Truist Securities | Maintain | Hold | 2025-12-19 |
| UBS | Maintain | Buy | 2025-12-08 |
| Evercore ISI Group | Maintain | Outperform | 2025-11-26 |
NXP Semiconductors N.V. Grades
These grades summarize current analyst ratings for NXP Semiconductors N.V.:
| Grading Company | Action | New Grade | Date |
|---|---|---|---|
| Citigroup | Maintain | Buy | 2026-01-15 |
| Wells Fargo | Maintain | Overweight | 2026-01-15 |
| Truist Securities | Maintain | Buy | 2025-12-19 |
| JP Morgan | Maintain | Neutral | 2025-10-29 |
| Truist Securities | Maintain | Buy | 2025-10-29 |
| Susquehanna | Maintain | Neutral | 2025-07-23 |
| Truist Securities | Maintain | Buy | 2025-07-23 |
| JP Morgan | Maintain | Neutral | 2025-07-23 |
| Wells Fargo | Maintain | Overweight | 2025-07-23 |
| Barclays | Maintain | Overweight | 2025-07-22 |
Which company has the best grades?
Analog Devices, Inc. consistently receives stronger grades, including multiple “Buy” and “Outperform” ratings and one recent upgrade. NXP Semiconductors N.V. shows more “Neutral” ratings. Investors may interpret this as greater confidence in Analog Devices’ near-term prospects.
Risks specific to each company
The following categories identify the critical pressure points and systemic threats facing both firms in the 2026 market environment:
1. Market & Competition
Analog Devices, Inc. (ADI)
- Faces intense competition in analog and mixed-signal ICs with strong market positioning but high P/E ratio signals valuation risk.
NXP Semiconductors N.V. (NXPI)
- Competes in diverse semiconductor segments with higher beta and valuation pressures but enjoys stronger ROE and ROIC metrics.
2. Capital Structure & Debt
Analog Devices, Inc. (ADI)
- Maintains conservative leverage with debt-to-equity at 0.26, and strong interest coverage of 9.54 times.
NXP Semiconductors N.V. (NXPI)
- Exhibits higher leverage with debt-to-equity at 1.22, raising financial risk despite adequate interest coverage of 7.97.
3. Stock Volatility
Analog Devices, Inc. (ADI)
- Beta near 1.03 suggests market-level volatility, moderately stable for tech sector investors.
NXP Semiconductors N.V. (NXPI)
- Beta at 1.46 indicates higher volatility, implying greater stock price swings and risk.
4. Regulatory & Legal
Analog Devices, Inc. (ADI)
- Primarily US-based operations expose it to evolving domestic tech regulations and trade policies.
NXP Semiconductors N.V. (NXPI)
- Global footprint, especially in China and Europe, heightens exposure to complex international regulatory environments.
5. Supply Chain & Operations
Analog Devices, Inc. (ADI)
- Relies on diversified supply chains but faces challenges in fixed asset turnover efficiency.
NXP Semiconductors N.V. (NXPI)
- Higher asset turnover reflects operational efficiency but supply chain complexity increases geopolitical risk.
6. ESG & Climate Transition
Analog Devices, Inc. (ADI)
- Strong focus on energy management products aligns with climate transition trends, supporting ESG credentials.
NXP Semiconductors N.V. (NXPI)
- Incorporates environmental sensors and wireless solutions, but ESG disclosures are less transparent internationally.
7. Geopolitical Exposure
Analog Devices, Inc. (ADI)
- US-centric base limits direct geopolitical tensions but indirect risks from global supply chains persist.
NXP Semiconductors N.V. (NXPI)
- Extensive operations in Asia and Europe increase vulnerability to trade tensions and regional conflicts.
Which company shows a better risk-adjusted profile?
Analog Devices faces less financial leverage and lower volatility, enhancing its risk stability. NXP’s superior ROE and ROIC reflect operational strength but are offset by high debt and geopolitical exposure. ADI’s conservative capital structure and safer Altman Z-Score (7.29 vs. 3.10) suggest a better risk-adjusted profile. NXP’s higher beta and debt-to-equity ratio trigger caution despite growth potential. The clear risk for ADI lies in valuation and market competition, whereas NXPI’s greatest risk is its leveraged balance sheet amid geopolitical complexity.
Final Verdict: Which stock to choose?
Analog Devices, Inc. (ADI) excels as a cash-generating powerhouse with robust margin expansion and consistent revenue growth. Its main point of vigilance lies in a return on invested capital below its cost of capital, signaling value destruction despite improving profitability. ADI fits well in aggressive growth portfolios seeking momentum and operational strength.
NXP Semiconductors N.V. (NXPI) boasts a strategic moat through superior return on equity and invested capital, reflecting efficient capital allocation and market positioning. It carries higher leverage risk than ADI but offers a stronger safety profile with a solid Altman Z-score. NXPI suits Growth at a Reasonable Price (GARP) investors who prioritize sustainable profitability over rapid expansion.
If you prioritize rapid growth and improving operational efficiency, ADI is the compelling choice due to its accelerating earnings and strong cash flow. However, if you seek more stable returns with a durable economic moat, NXPI offers better stability and capital efficiency despite recent profitability pressures. Both present slightly favorable profiles but cater to distinct investor strategies.
Disclaimer: Investment carries a risk of loss of initial capital. The past performance is not a reliable indicator of future results. Be sure to understand risks before making an investment decision.
Go Further
I encourage you to read the complete analyses of Analog Devices, Inc. and NXP Semiconductors N.V. to enhance your investment decisions: