Home > Comparison > Technology > KLAC vs ADI
The strategic rivalry between KLA Corporation and Analog Devices, Inc. shapes the semiconductor industry’s competitive landscape. KLA operates as a capital-intensive leader in process control and yield management solutions, while Analog Devices focuses on high-margin analog and mixed-signal integrated circuits. This head-to-head pits precision manufacturing against diversified product innovation. This analysis aims to identify which company offers superior risk-adjusted returns for a balanced technology portfolio.
Table of contents
Companies Overview
KLA Corporation and Analog Devices, Inc. both play pivotal roles in the semiconductor industry’s evolution.
KLA Corporation: Semiconductor Process Control Leader
KLA Corporation stands as a dominant provider of process control and yield management solutions for semiconductors. Its revenue primarily comes from wafer inspection, metrology, and defect detection technologies. In 2026, KLA focuses strategically on advanced semiconductor process control to enhance manufacturing precision and efficiency worldwide.
Analog Devices, Inc.: Premier Analog and Mixed-Signal Innovator
Analog Devices, Inc. specializes in integrated circuits and signal processing technologies, converting analog data to digital and vice versa. Revenue streams derive from power management, amplifiers, and RF components across automotive, industrial, and communication sectors. The company’s 2026 strategy emphasizes expanding high-performance analog solutions and system integration capabilities globally.
Strategic Collision: Similarities & Divergences
Both firms share a semiconductor foundation but diverge sharply: KLA prioritizes precision in process control, while Analog Devices pushes innovation in analog and mixed-signal ICs. Their competition centers on supplying critical components and technology to semiconductor manufacturers and end markets. These differences create distinct investment profiles—KLA offers exposure to manufacturing optimization, Analog Devices to diversified semiconductor applications.
Income Statement Comparison
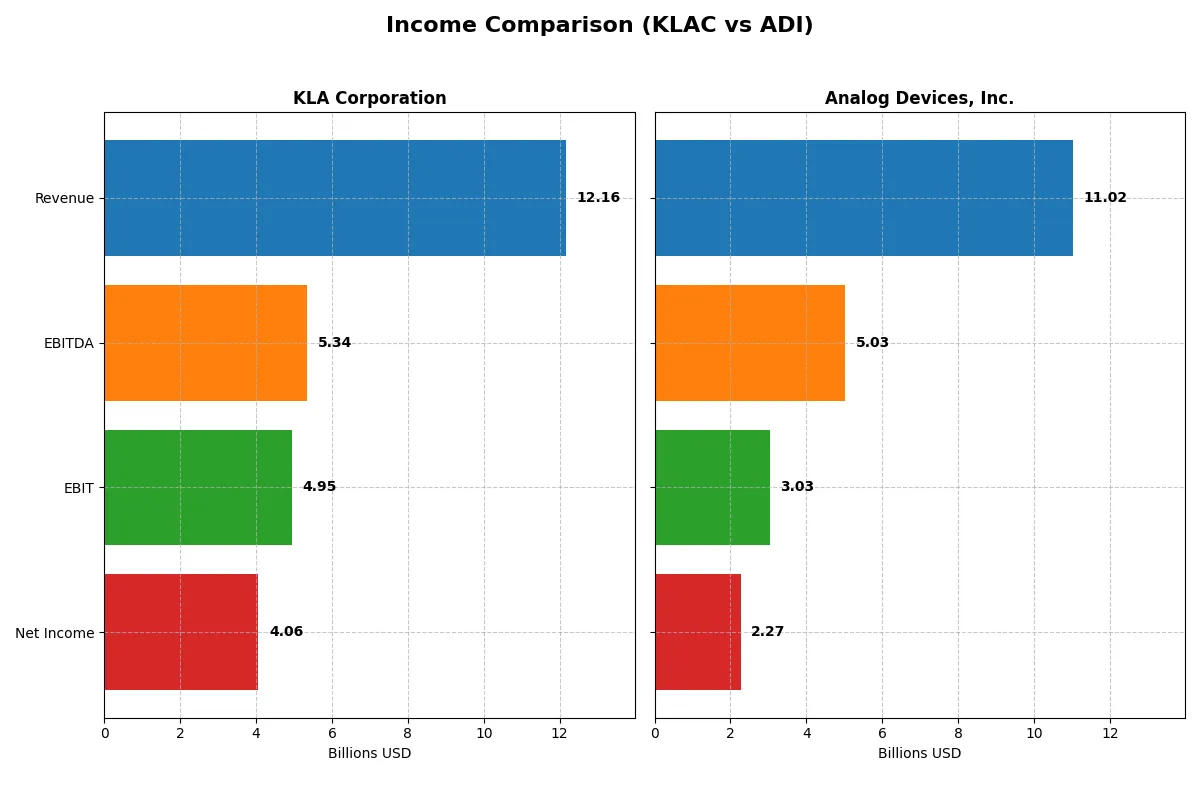
This data dissects the core profitability and scalability of both corporate engines to reveal who dominates the bottom line:
| Metric | KLA Corporation (KLAC) | Analog Devices, Inc. (ADI) |
|---|---|---|
| Revenue | 12.2B | 11.0B |
| Cost of Revenue | 4.6B | 5.0B |
| Operating Expenses | 2.3B | 3.0B |
| Gross Profit | 7.6B | 6.0B |
| EBITDA | 5.3B | 5.0B |
| EBIT | 4.9B | 3.0B |
| Interest Expense | 0.3B | 0.3B |
| Net Income | 4.1B | 2.3B |
| EPS | 30.53 | 4.59 |
| Fiscal Year | 2025 | 2025 |
Income Statement Analysis: The Bottom-Line Duel
This income statement comparison reveals which company runs the more efficient and profitable corporate engine through recent financial performance.
KLA Corporation Analysis
KLA shows a robust revenue climb from $6.9B in 2021 to $12.2B in 2025, nearly doubling net income from $2.1B to $4.1B. Gross margin stands strong at 62.3%, with a net margin of 33.4%, reflecting excellent cost control. The 2025 fiscal year reveals accelerating profitability and margin expansion, signaling operational momentum.
Analog Devices, Inc. Analysis
Analog Devices grew revenue from $7.3B in 2021 to $11B in 2025, with net income rising from $1.4B to $2.3B. Its gross margin is a solid 54.7%, but net margin lags at 20.6%, indicating higher operating costs. Despite healthy EBIT growth, 2025’s margins show less efficiency compared to KLA’s, pointing to room for improvement in expense management.
Margin Leadership vs. Revenue Growth
KLA outperforms ADI by delivering superior margins and faster net income growth, nearly doubling its bottom line over five years. ADI posts respectable top-line gains but trails in converting revenue into profit efficiently. For investors prioritizing profitability and margin strength, KLA’s profile offers a more compelling income statement trajectory.
Financial Ratios Comparison
These vital ratios act as a diagnostic tool to expose the underlying fiscal health, valuation premiums, and capital efficiency of the companies compared below:
| Ratios | KLA Corporation (KLAC) | Analog Devices, Inc. (ADI) |
|---|---|---|
| ROE | 86.6% | 6.7% |
| ROIC | 38.0% | 5.5% |
| P/E | 29.3 | 51.1 |
| P/B | 25.4 | 3.4 |
| Current Ratio | 2.62 | 2.19 |
| Quick Ratio | 1.83 | 1.68 |
| D/E | 1.30 | 0.26 |
| Debt-to-Assets | 37.9% | 18.1% |
| Interest Coverage | 17.3 | 9.5 |
| Asset Turnover | 0.76 | 0.23 |
| Fixed Asset Turnover | 9.70 | 3.32 |
| Payout ratio | 22.3% | 84.9% |
| Dividend yield | 0.76% | 1.66% |
| Fiscal Year | 2025 | 2025 |
Efficiency & Valuation Duel: The Vital Signs
Financial ratios act as a company’s DNA, exposing hidden risks and signaling operational excellence critical for investment decisions.
KLA Corporation
KLA demonstrates robust profitability with an 86.56% ROE and a strong 33.41% net margin, signaling operational efficiency. However, its valuation appears stretched with a high P/E of 29.34 and P/B at 25.39. The company returns modest dividends at 0.76%, favoring reinvestment in R&D to sustain growth and maintain its competitive moat.
Analog Devices, Inc.
Analog Devices posts a moderate 20.58% net margin but a weak 6.7% ROE, reflecting limited profitability. The stock looks expensive, trading at a P/E of 51.05 and a P/B of 3.42. It offers a 1.66% dividend yield, balancing shareholder returns with steady reinvestment in R&D to support future innovation and margin expansion.
Premium Valuation vs. Operational Safety
KLA’s exceptional profitability justifies its premium valuation despite some debt concerns. ADI trades at a higher premium but struggles with profitability metrics. Investors seeking operational strength may prefer KLA, while those favoring income with growth potential might consider ADI’s dividend profile.
Which one offers the Superior Shareholder Reward?
I compare KLA Corporation (KLAC) and Analog Devices, Inc. (ADI) on dividends, payout ratios, and buybacks. KLAC yields 0.76% with a 22% payout ratio, sustaining dividends via strong free cash flow (FCF). ADI yields 1.66% but pays out 85% of net income, pressuring sustainability. KLAC’s free cash flow per share is $28.1B vs. ADI’s $8.7B, supporting buybacks and dividends. Both execute buybacks, yet KLAC’s lower payout and robust FCF coverage make its model more durable. I see KLAC delivering a superior total return profile in 2026 due to balanced distributions and capital allocation.
Comparative Score Analysis: The Strategic Profile
The radar chart reveals the fundamental DNA and trade-offs of KLA Corporation and Analog Devices, Inc.:
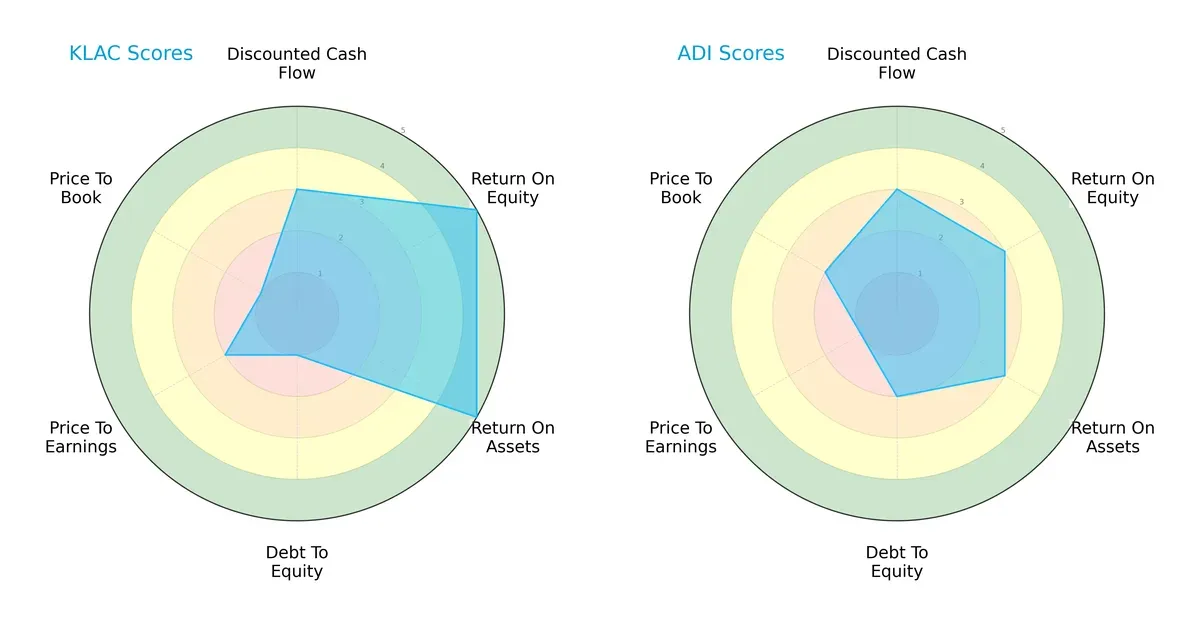
KLA outperforms ADI in profitability with higher ROE (5 vs. 3) and ROA (5 vs. 3) scores, showing superior operational efficiency. However, KLA’s debt-to-equity score is very unfavorable (1 vs. 2), signaling higher financial risk. ADI holds a slight edge in balance sheet strength and valuation metrics, though its price-to-earnings score is weak. KLA’s profile is more polarized, relying on strong returns but burdened by leverage, while ADI presents a more balanced but moderate financial stance.
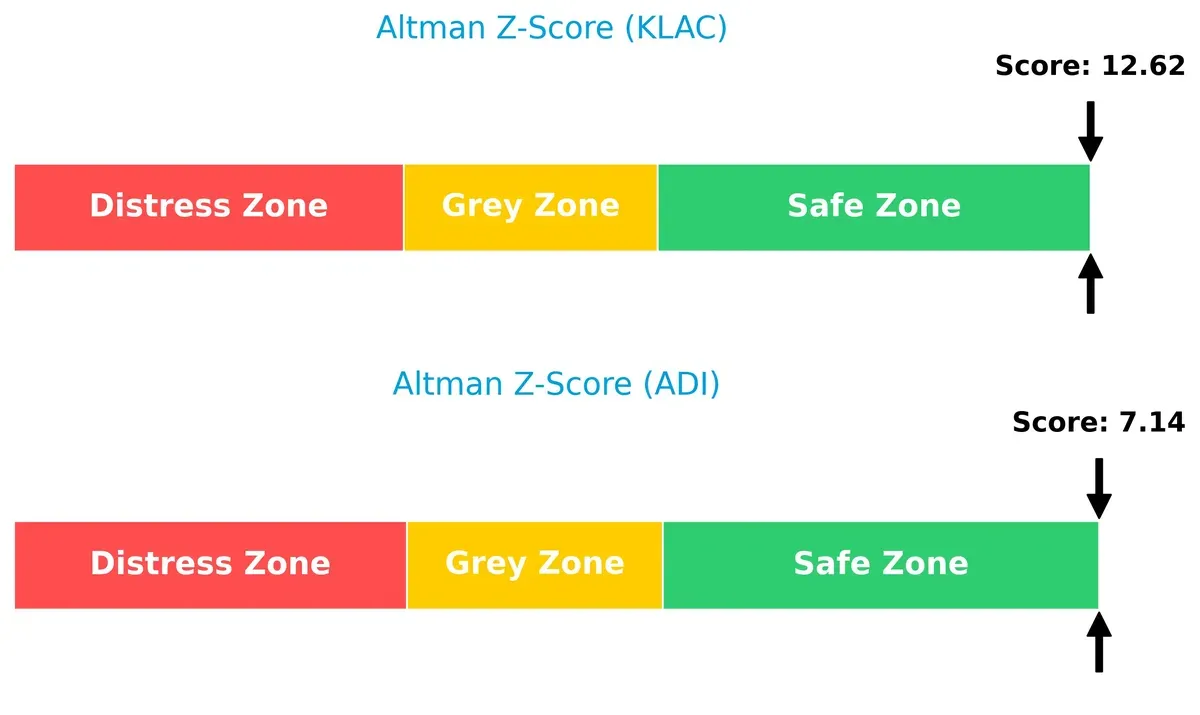
Bankruptcy Risk: Solvency Showdown
The Altman Z-Scores place both companies safely above distress thresholds, but KLA’s 12.6 vastly exceeds ADI’s 7.1, indicating a stronger margin of safety for long-term survival in this cycle:
Financial Health: Quality of Operations
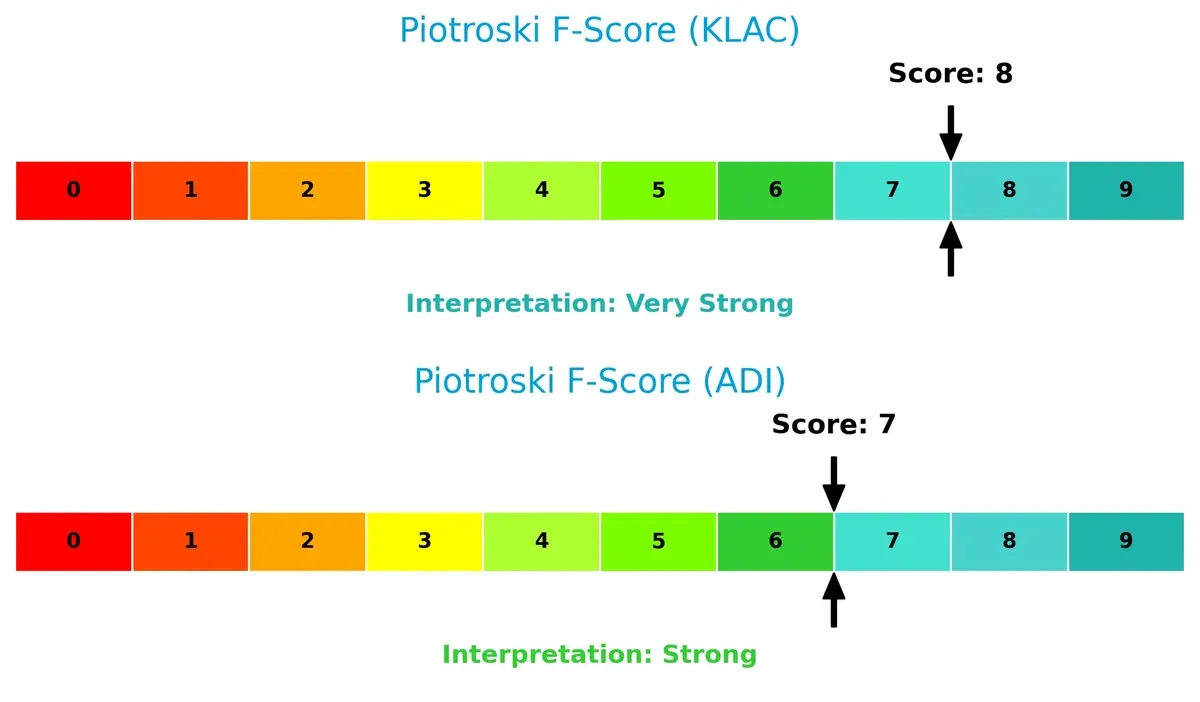
KLA’s Piotroski F-Score of 8 outperforms ADI’s 7, signaling peak financial health with fewer operational red flags. Both firms show strong fundamentals, but KLA edges ahead in internal financial quality:
How are the two companies positioned?
This section dissects KLAC and ADI’s operational DNA by comparing revenue distribution and internal dynamics, including strengths and weaknesses. The goal is to confront their economic moats and identify which model offers the most resilient, sustainable advantage today.
Revenue Segmentation: The Strategic Mix
This comparison dissects how KLA Corporation and Analog Devices diversify their revenue streams and where their primary sector bets lie:
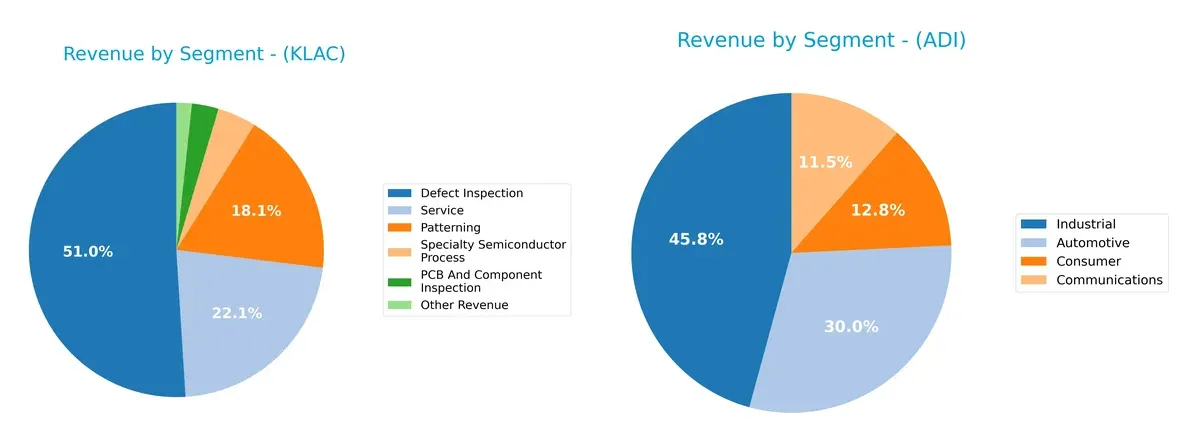
KLA leans heavily on Defect Inspection, which anchors $6.2B of its $11.7B total in 2025, dwarfing other segments. Its next biggest is Service at $2.7B, showing moderate diversification. Analog Devices presents a more balanced portfolio; Industrial leads at $4.3B, but Automotive, Communications, and Consumer segments each contribute $1B to $2.8B, reducing concentration risk. KLA’s dominance in defect inspection implies infrastructure lock-in, while ADI’s spread suggests resilience across multiple end markets.
Strengths and Weaknesses Comparison
This table compares the Strengths and Weaknesses of KLA Corporation and Analog Devices, Inc.:
KLA Corporation Strengths
- High net margin at 33.41%
- ROE of 86.56% indicates strong profitability
- Favorable liquidity with current ratio 2.62
- Diverse product segments including defect inspection and patterning
- Significant revenue from China and Taiwan
- High fixed asset turnover at 9.7
Analog Devices, Inc. Strengths
- Balanced revenue streams across automotive, industrial, consumer, and communications
- Favorable current ratio 2.19 and low debt-to-equity at 0.26
- Strong interest coverage at 9.54
- Global presence with strong US and Europe revenues
- Consistent industrial segment leadership
- Positive dividend yield of 1.66%
KLA Corporation Weaknesses
- Elevated WACC at 10.42% weighs on capital efficiency
- High price-to-book at 25.39 and price-to-earnings at 29.34
- Debt-to-equity ratio high at 1.3
- Dividend yield low at 0.76%
- Some reliance on Asia markets with China and Taiwan concentrated
- Moderate asset turnover at 0.76
Analog Devices, Inc. Weaknesses
- Low ROE at 6.7% reflects profitability challenges
- High P/E of 51.05 and underwhelming asset turnover at 0.23
- Lower ROIC at 5.55% near WACC level
- Less diversification in product innovation compared to KLAC
- Europe and US revenue exposure concentrated
- Dividend yield neutral at 1.66%
KLA shows strong profitability and asset efficiency but faces capital cost and valuation pressures. Analog Devices benefits from broader market diversification and liquidity but struggles with returns and valuation metrics. Both companies have global footprints, yet each faces distinct financial and operational challenges shaping their strategic positioning.
The Moat Duel: Analyzing Competitive Defensibility
A structural moat protects long-term profits from relentless competition and market pressures. Without it, gains erode quickly. Let’s examine the moats of two semiconductor leaders:
KLA Corporation: Precision Process Control Moat
KLA’s moat stems from specialized process control technologies essential to chipmakers. Its high ROIC above WACC (27.5%) and margin stability confirm durable value creation. New inspection tools and expanding Asian markets deepen its advantage in 2026.
Analog Devices, Inc.: Innovation-Driven Product Moat
ADI’s moat relies on analog and mixed-signal innovation, differentiating it from KLA’s process focus. Despite a negative ROIC vs. WACC (-2.8%), ADI shows improving profitability. Expansion in automotive and industrial segments could bolster market disruption opportunities.
Precision Control vs. Innovation Expansion: The Moat Verdict
KLA holds a wider and deeper moat with consistently strong returns and stable margins. ADI’s growing profitability is promising but insufficient to offset value destruction. KLA is better positioned to defend and grow market share in the evolving semiconductor landscape.
Which stock offers better returns?
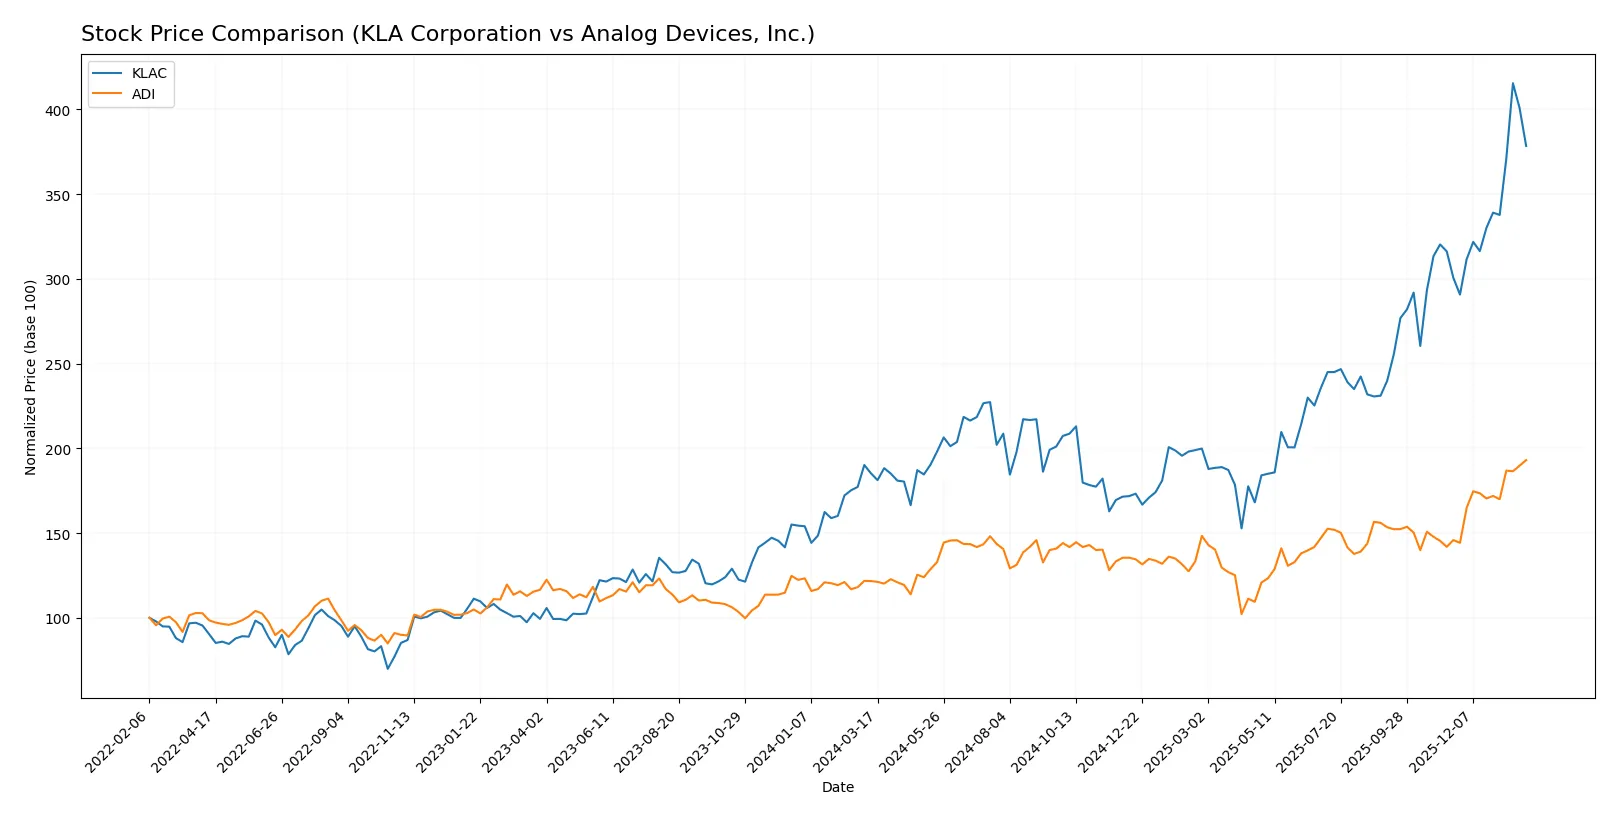
The past year shows stark divergence in price performance between KLA Corporation and Analog Devices, Inc., with both stocks exhibiting bullish momentum but differing in volatility and acceleration patterns.
Trend Comparison
KLA Corporation’s stock price surged 104.22% over the last 12 months, marking a strong bullish trend with accelerating gains and significant volatility, oscillating between 577 and 1,568.
Analog Devices, Inc. recorded a 58.66% price increase over the same period, also bullish with acceleration but far lower volatility, trading within a 165 to 311 range.
KLAC outperformed ADI in market gains, delivering nearly double the percentage increase, although with notably higher price volatility and a sharper upward acceleration.
Target Prices
Analysts show a bullish consensus for KLA Corporation and Analog Devices, Inc., reflecting confidence in their semiconductor leadership.
| Company | Target Low | Target High | Consensus |
|---|---|---|---|
| KLA Corporation | 1,400 | 1,900 | 1,672 |
| Analog Devices, Inc. | 270 | 375 | 316 |
The consensus target for KLA exceeds its current price of 1,428 by 17%, implying upside potential. Analog Devices’ target sits slightly above its 311 price, suggesting modest growth expectations.

Don’t Let Luck Decide Your Entry Point
Optimize your entry points with our advanced ProRealTime indicators. You’ll get efficient buy signals with precise price targets for maximum performance. Start outperforming now!
How do institutions grade them?
Here is a summary of recent institutional grades for KLA Corporation and Analog Devices, Inc.:
KLA Corporation Grades
The following table shows KLA Corporation’s latest grades from established grading firms.
| Grading Company | Action | New Grade | Date |
|---|---|---|---|
| Needham | Maintain | Buy | 2026-01-30 |
| Stifel | Maintain | Buy | 2026-01-30 |
| Wells Fargo | Maintain | Overweight | 2026-01-30 |
| Jefferies | Maintain | Buy | 2026-01-30 |
| Cantor Fitzgerald | Maintain | Overweight | 2026-01-30 |
| Barclays | Maintain | Overweight | 2026-01-30 |
| Oppenheimer | Maintain | Outperform | 2026-01-30 |
| RBC Capital | Maintain | Sector Perform | 2026-01-30 |
| Deutsche Bank | Maintain | Hold | 2026-01-21 |
| UBS | Maintain | Neutral | 2026-01-20 |
Analog Devices, Inc. Grades
Below are Analog Devices, Inc.’s recent grades from recognized grading institutions.
| Grading Company | Action | New Grade | Date |
|---|---|---|---|
| Susquehanna | Maintain | Positive | 2026-01-22 |
| B of A Securities | Maintain | Buy | 2026-01-21 |
| Stifel | Maintain | Buy | 2026-01-16 |
| Oppenheimer | Maintain | Outperform | 2026-01-16 |
| Wells Fargo | Upgrade | Overweight | 2026-01-15 |
| Citigroup | Maintain | Buy | 2026-01-15 |
| Keybanc | Maintain | Overweight | 2026-01-13 |
| Truist Securities | Maintain | Hold | 2025-12-19 |
| UBS | Maintain | Buy | 2025-12-08 |
| Truist Securities | Maintain | Hold | 2025-11-26 |
Which company has the best grades?
Both companies share mostly positive grades from reputable firms. KLA exhibits a strong consensus on “Buy” and “Overweight” ratings. Analog Devices also shows solid support, with several “Buy” and an upgrade to “Overweight.” Investors may view KLA’s consistent “Buy” and “Outperform” ratings as slightly more favorable.
Risks specific to each company
The following categories identify the critical pressure points and systemic threats facing both firms in the 2026 market environment:
1. Market & Competition
KLA Corporation
- Operates in highly competitive semiconductor process control with pressure from innovation cycles.
Analog Devices, Inc.
- Faces intense competition across diverse analog and mixed-signal IC markets, requiring constant product evolution.
2. Capital Structure & Debt
KLA Corporation
- High debt-to-equity ratio (1.3) signals leveraged balance sheet and elevated financial risk.
Analog Devices, Inc.
- Low debt-to-equity (0.26) indicates a conservative capital structure with lower financial risk.
3. Stock Volatility
KLA Corporation
- Beta of 1.444 reflects higher volatility and sensitivity to market swings.
Analog Devices, Inc.
- Beta of 1.032 shows moderate volatility, closer to market average.
4. Regulatory & Legal
KLA Corporation
- Exposure to evolving semiconductor export controls and IP protection laws globally.
Analog Devices, Inc.
- Faces regulatory scrutiny in multiple jurisdictions due to broad end-market exposure.
5. Supply Chain & Operations
KLA Corporation
- Supply chain complexity due to specialized semiconductor equipment manufacturing.
Analog Devices, Inc.
- Supply disruptions risk in multi-sourced analog and mixed-signal components.
6. ESG & Climate Transition
KLA Corporation
- ESG initiatives moderate but must advance to meet industry standards and investor expectations.
Analog Devices, Inc.
- Stronger ESG integration given broader industrial and automotive customer base.
7. Geopolitical Exposure
KLA Corporation
- Significant exposure to US-China tensions affecting semiconductor technology trade.
Analog Devices, Inc.
- Diversified global footprint reduces single-country geopolitical risk but still vulnerable.
Which company shows a better risk-adjusted profile?
KLA Corporation’s most impactful risk is its leveraged capital structure, elevating financial vulnerability despite strong operational metrics. Analog Devices faces valuation risk with high P/E and competitive pressure but maintains a healthier balance sheet. Given the higher financial leverage and stock volatility, Analog Devices presents a superior risk-adjusted profile. Recent data show KLA’s debt-to-equity ratio at 1.3, a clear red flag amid tightening credit conditions.
Final Verdict: Which stock to choose?
KLA Corporation’s superpower lies in its robust value creation, demonstrated by a very favorable moat and a growing return on invested capital. Its efficiency and profitability outpace peers, yet its high debt-to-equity ratio remains a point of vigilance. It fits well in aggressive growth portfolios that can tolerate leverage risks.
Analog Devices, Inc. offers a strategic moat rooted in steady R&D investment and a defensive balance sheet with low leverage. While its value creation is slightly unfavorable, its stability and moderate growth profile present a safer harbor compared to KLA. It suits GARP portfolios seeking growth with a tempered risk appetite.
If you prioritize high-value creation and are comfortable with leverage, KLA outshines with superior profitability and growth momentum. However, if you seek better stability and lower financial risk, Analog Devices offers a more conservative profile despite a modest premium. Both are viable, but your risk tolerance and investment horizon should guide the choice.
Disclaimer: Investment carries a risk of loss of initial capital. The past performance is not a reliable indicator of future results. Be sure to understand risks before making an investment decision.
Go Further
I encourage you to read the complete analyses of KLA Corporation and Analog Devices, Inc. to enhance your investment decisions: