Home > Comparison > Technology > ADI vs CEVA
The strategic rivalry between Analog Devices, Inc. and CEVA, Inc. shapes the semiconductor landscape today. Analog Devices operates as a capital-intensive, diversified semiconductor manufacturer with a broad product portfolio. In contrast, CEVA focuses on licensing cutting-edge wireless connectivity and AI processors, relying on intellectual property rather than manufacturing. This analysis will assess which business model offers superior risk-adjusted returns, guiding investors seeking durable exposure to semiconductor innovation.
Table of contents
Companies Overview
Analog Devices and CEVA both hold critical roles in the semiconductor sector, shaping technology across diverse markets.
Analog Devices, Inc.: Leader in Analog and Mixed-Signal Innovation
Analog Devices dominates as a semiconductor manufacturer specializing in analog, mixed-signal, and digital signal processing ICs. Its core revenue stems from data converters, power management, amplifiers, and RF ICs serving automotive, industrial, and communications markets. In 2026, the company emphasized expanding its high-performance analog solutions to address growing demands in automotive and industrial applications.
CEVA, Inc.: Pioneer in Wireless Connectivity and AI IP Licensing
CEVA operates as a licensor of digital signal processors and AI platforms to semiconductor and OEM firms. It generates revenue through licensing DSP cores, AI processors, and wireless connectivity technologies for 5G, IoT, and smart sensing devices. Its 2026 strategy focused on enhancing AI and sensor fusion IP to capitalize on expanding markets like wearables, automotive, and industrial IoT.
Strategic Collision: Similarities & Divergences
Analog Devices builds value through manufacturing physical ICs, while CEVA licenses intellectual property, reflecting divergent business models. Both compete in the broad semiconductor ecosystem, but their primary battleground lies in high-performance signal processing for emerging applications. Analog Devices offers a tangible product moat, whereas CEVA’s strength is its flexible, scalable IP portfolio—each appealing to distinct investor appetites.
Income Statement Comparison
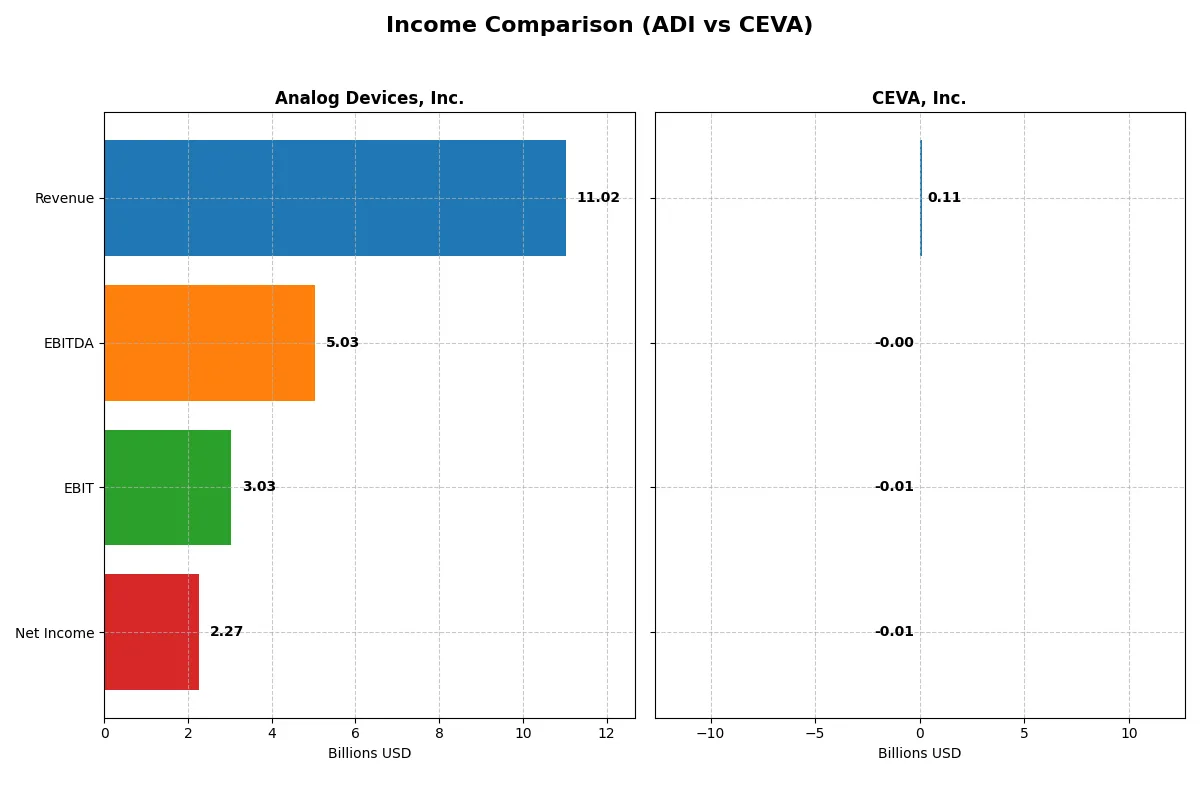
This data dissects the core profitability and scalability of both corporate engines to reveal who dominates the bottom line:
| Metric | Analog Devices, Inc. (ADI) | CEVA, Inc. (CEVA) |
|---|---|---|
| Revenue | 11.0B | 107M |
| Cost of Revenue | 5.0B | 13M |
| Operating Expenses | 3.0B | 102M |
| Gross Profit | 6.0B | 94M |
| EBITDA | 5.0B | -3.4M |
| EBIT | 3.0B | -7.5M |
| Interest Expense | 318M | 0 |
| Net Income | 2.3B | -8.8M |
| EPS | 4.59 | -0.37 |
| Fiscal Year | 2025 | 2024 |
Income Statement Analysis: The Bottom-Line Duel
This income statement comparison reveals which company operates with better financial efficiency and stronger profitability momentum.
Analog Devices, Inc. Analysis
Analog Devices shows robust growth with 2025 revenue at $11B, up 17% from 2024. Net income surged to $2.27B, lifting net margin to 20.6%. Its gross margin remains healthy at 54.7%, and EBIT margin excels at 27.5%. The company’s efficiency gains and margin expansions underline a strong earnings momentum in 2025.
CEVA, Inc. Analysis
CEVA’s revenue climbed 9.8% in 2024 to $107M, yet it posted a net loss of $8.8M, reflecting a negative net margin of -8.2%. Despite an impressive gross margin of 88.1%, the EBIT margin stayed negative at -7.1%. The company improved EBIT and net margin year-over-year but struggles to translate top-line growth into profitability.
Margin Strength vs. Profitability Challenges
Analog Devices clearly outperforms CEVA with sustainable revenue scale and positive net margins. While CEVA boasts a high gross margin, its persistent operating losses and negative net income reveal ongoing profitability challenges. For investors, Analog Devices offers a proven profit engine, whereas CEVA’s profile suits those willing to tolerate risk for potential turnaround rewards.
Financial Ratios Comparison
These vital ratios act as a diagnostic tool to expose the underlying fiscal health, valuation premiums, and capital efficiency of the companies compared below:
| Ratios | Analog Devices, Inc. (ADI) | CEVA, Inc. (CEVA) |
|---|---|---|
| ROE | 6.7% | -3.3% |
| ROIC | 5.5% | -2.7% |
| P/E | 51.1 | -84.8 |
| P/B | 3.42 | 2.79 |
| Current Ratio | 2.19 | 7.09 |
| Quick Ratio | 1.68 | 7.09 |
| D/E | 0.26 | 0.02 |
| Debt-to-Assets | 18.1% | 1.8% |
| Interest Coverage | 9.45 | 0 |
| Asset Turnover | 0.23 | 0.35 |
| Fixed Asset Turnover | 3.32 | 8.43 |
| Payout ratio | 84.9% | 0% |
| Dividend yield | 1.66% | 0% |
| Fiscal Year | 2025 | 2024 |
Efficiency & Valuation Duel: The Vital Signs
Financial ratios serve as a company’s DNA, exposing hidden risks and operational excellence beneath headline figures.
Analog Devices, Inc.
ADI shows strong net margins at 20.58%, but a modest ROE of 6.7% signals limited shareholder profitability. The stock trades expensive with a P/E of 51.05 and P/B at 3.42, reflecting stretched valuation. A 1.66% dividend yield provides steady shareholder returns alongside a favorable capital structure and solid liquidity.
CEVA, Inc.
CEVA struggles with negative profitability metrics, including a -8.22% net margin and -3.3% ROE, indicating operational losses. Its P/E ratio is negative but flagged favorable due to valuation mechanics. CEVA exhibits robust liquidity with a 7.09 current ratio but offers no dividends, instead reinvesting heavily in R&D (67%) to fuel growth, despite an unfavorable overall ratio profile.
Premium Valuation vs. Operational Struggles
ADI balances operational efficiency and shareholder returns but at a premium valuation, increasing risk. CEVA’s weaker profitability and no dividends highlight high risk but potential growth via R&D reinvestment. Investors seeking stability may prefer ADI, while growth-focused profiles face greater risks with CEVA’s profile.
Which one offers the Superior Shareholder Reward?
I compare Analog Devices, Inc. (ADI) and CEVA, Inc. (CEVA) on shareholder rewards by contrasting their dividend policies, yields, payout ratios, and buyback intensity. ADI pays dividends with a 1.66% yield and a high 85% payout ratio, supported by strong free cash flow coverage above 1.9x. It also pursues steady buybacks, enhancing total returns. CEVA pays no dividends and generates minimal free cash flow (0.02 per share), reflecting reinvestment in growth and R&D. Its buyback activity is negligible, limiting shareholder distributions. ADI’s distribution model is more sustainable and shareholder-friendly given its robust cash flow and disciplined capital allocation. I conclude ADI offers the superior total return profile for 2026 investors.
Comparative Score Analysis: The Strategic Profile
The radar chart reveals the fundamental DNA and trade-offs of both firms, highlighting their financial strengths and strategic positioning:
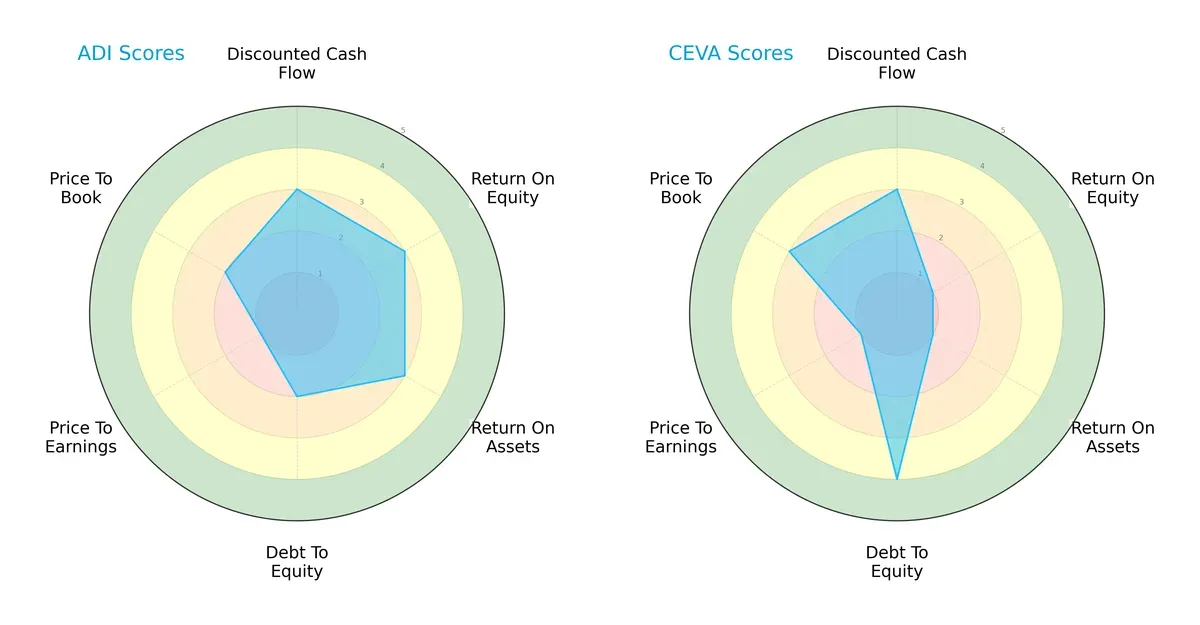
Analog Devices, Inc. (ADI) demonstrates a balanced profile with moderate scores in DCF, ROE, ROA, and debt-to-equity. CEVA, Inc. excels in debt management but suffers from weak profitability metrics (ROE and ROA). ADI relies on a consistent operational efficiency edge, whereas CEVA’s strength lies in conservative leverage management.
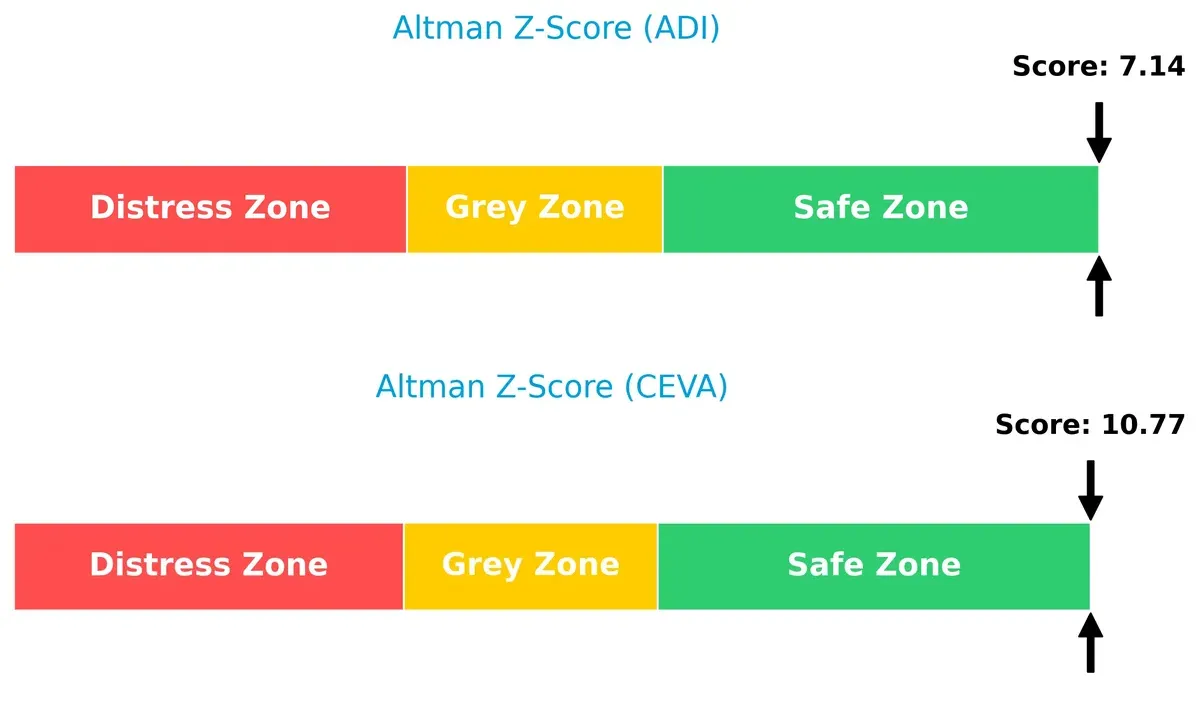
Bankruptcy Risk: Solvency Showdown
The Altman Z-Score delta favors CEVA, indicating a stronger solvency position for long-term survival within this economic cycle:
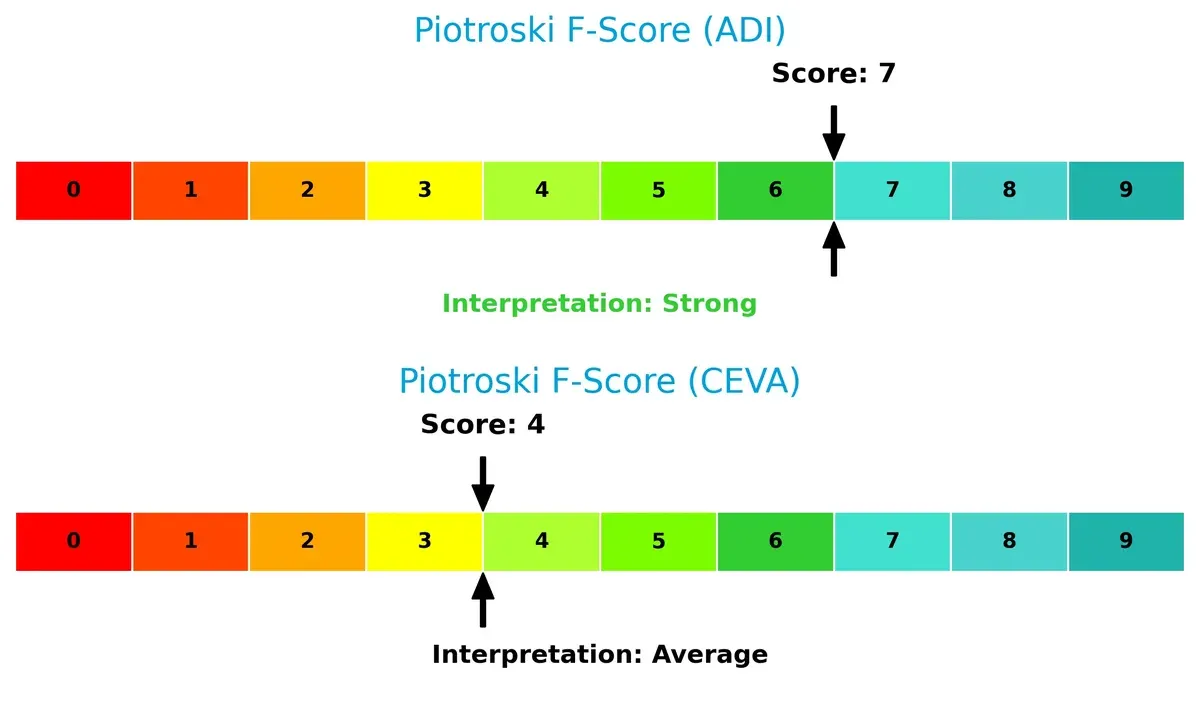
Financial Health: Quality of Operations
Analog Devices leads with a strong Piotroski F-Score of 7, signaling robust financial health, while CEVA’s average score of 4 raises red flags on operational quality and internal metrics:
How are the two companies positioned?
This section dissects the operational DNA of ADI and CEVA by comparing their revenue distribution by segment and internal dynamics. The goal is to confront their economic moats to reveal which model delivers the most resilient competitive advantage today.
Revenue Segmentation: The Strategic Mix
This visual comparison dissects how Analog Devices, Inc. and CEVA, Inc. diversify their income streams and where their primary sector bets lie:
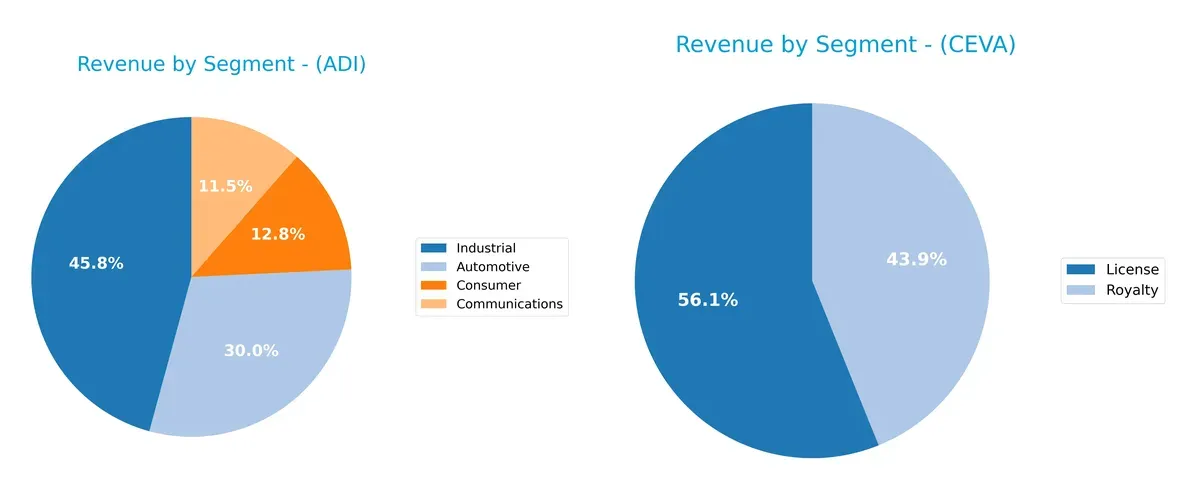
Analog Devices anchors its revenue in Industrial at $4.3B, with substantial contributions from Automotive ($2.8B) and Consumer ($1.2B). This diversified portfolio mitigates sector risk and leverages industrial infrastructure dominance. CEVA pivots around License ($60M) and Royalty ($47M), showing a narrow focus on intellectual property monetization. CEVA’s concentration heightens exposure to licensing cycles, while Analog Devices’ broad mix strengthens ecosystem lock-in across multiple high-value sectors.
Strengths and Weaknesses Comparison
This table compares the strengths and weaknesses of Analog Devices, Inc. and CEVA, Inc.:
ADI Strengths
- Diversified revenue across Automotive, Industrial, Consumer, and Communications segments
- Favorable net margin of 20.58% indicates strong profitability
- Solid liquidity with current ratio of 2.19 and quick ratio of 1.68
- Low debt levels, debt-to-assets 18.05% and interest coverage 9.54
- Global presence with significant sales in the US, China, and Europe
- Favorable fixed asset turnover ratio of 3.32
CEVA Strengths
- Favorable fixed asset turnover of 8.43 shows efficient asset use
- Low debt-to-assets at 1.8% and debt/equity of 0.02 indicate strong balance sheet
- Quick ratio of 7.09 supports short-term liquidity
- Favorable P/E ratio (despite negative earnings) reflects market valuation
- Presence in Asia Pacific, US, and Europe markets
- Focus on licensing and royalty revenue streams
ADI Weaknesses
- Unfavorable ROE at 6.7% below WACC of 8.38%, indicating value destruction
- High P/E at 51.05 and PB at 3.42 suggest overvaluation risk
- Asset turnover of 0.23 is low, signaling inefficient asset utilization
- ROIC at 5.55% is below WACC, limiting capital efficiency
- Dividend yield is moderate at 1.66%, less attractive for income
CEVA Weaknesses
- Negative profitability with net margin -8.22% and ROE -3.3%
- Unfavorable ROIC at -2.68% and WACC high at 10.47%
- Interest coverage at 0 signals risk in servicing debt
- Current ratio unusually high at 7.09 may indicate inefficient capital use
- Zero dividend yield limits income appeal
- Asset turnover unfavorable at 0.35 despite high fixed asset turnover
Analog Devices demonstrates robust diversification, profitability, and global reach but faces challenges in capital efficiency and valuation. CEVA shows strong balance sheet metrics but suffers from persistent profitability and operational inefficiencies. Each company’s strengths and weaknesses highlight different strategic priorities and risk profiles.
The Moat Duel: Analyzing Competitive Defensibility
A structural moat alone defends long-term profits from relentless competitive erosion. Let’s dissect how two semiconductor firms measure up:
Analog Devices, Inc. (ADI): Diversified Technology Moat
ADI’s primary moat stems from its intangible assets and broad product portfolio across analog and mixed-signal ICs. This results in stable margins (27.5% EBIT) and robust revenue growth (17% last year). Its expanding presence in automotive and industrial markets could deepen its moat in 2026, despite current value destruction indicated by ROIC below WACC.
CEVA, Inc. (CEVA): IP Licensing Niche Moat
CEVA’s moat relies on licensing proprietary DSP and AI processor IP, contrasting with ADI’s manufacturing scale. Despite a high gross margin (88%), CEVA struggles with negative EBIT and net margins, signaling weak capital efficiency. Its focus on wireless and sensing tech offers growth potential but faces significant profitability challenges and a sharply declining ROIC trend.
Economic Moat Battle: Diversification and Scale vs. IP Licensing Efficiency
ADI’s broader and more diversified moat offers wider market coverage and margin stability, whereas CEVA’s narrow licensing moat suffers from poor capital returns. I conclude ADI is better positioned to defend and grow its market share in 2026.
Which stock offers better returns?
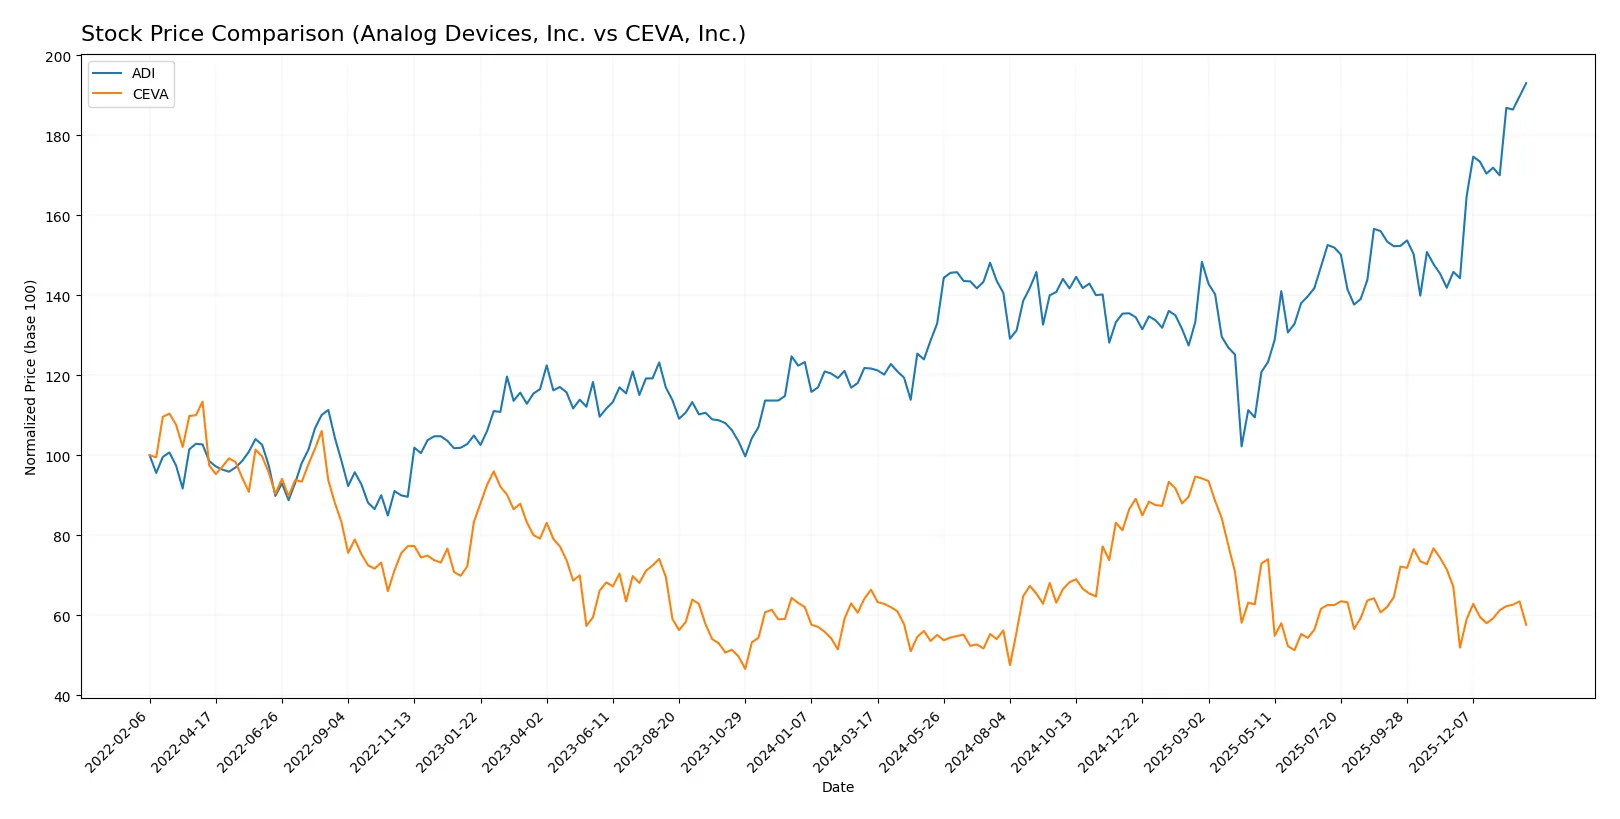
Over the past 12 months, Analog Devices, Inc. surged significantly, while CEVA, Inc. faced a notable decline, reflecting contrasting trading dynamics and investor sentiment.
Trend Comparison
Analog Devices, Inc. posted a strong bullish trend with a 58.66% price increase over the past year, showing acceleration and a high volatility level with a 26.38 standard deviation. The stock reached a peak of 310.88 and a low of 164.6.
CEVA, Inc. experienced a bearish trend with a 13.25% price drop over the same period, also accelerating but with lower volatility at a 4.4 standard deviation. Its highest price was 34.67, and the lowest was 17.39.
Analog Devices, Inc. clearly outperformed CEVA, Inc., delivering the highest market return and demonstrating stronger momentum throughout the year.
Target Prices
Analysts present a clear consensus on target prices for Analog Devices, Inc. and CEVA, Inc.
| Company | Target Low | Target High | Consensus |
|---|---|---|---|
| Analog Devices, Inc. | 270 | 375 | 316 |
| CEVA, Inc. | 28 | 28 | 28 |
The consensus target for Analog Devices at $316 slightly exceeds its current price of $311, signaling moderate upside potential. CEVA’s fixed target of $28 stands well above its current $21, indicating stronger bullish expectations.

Don’t Let Luck Decide Your Entry Point
Optimize your entry points with our advanced ProRealTime indicators. You’ll get efficient buy signals with precise price targets for maximum performance. Start outperforming now!
How do institutions grade them?
The grades from major financial institutions for Analog Devices, Inc. and CEVA, Inc. are summarized below:
Analog Devices, Inc. Grades
This table shows the recent grades issued by well-known grading firms for Analog Devices, Inc.
| Grading Company | Action | New Grade | Date |
|---|---|---|---|
| Susquehanna | Maintain | Positive | 2026-01-22 |
| B of A Securities | Maintain | Buy | 2026-01-21 |
| Stifel | Maintain | Buy | 2026-01-16 |
| Oppenheimer | Maintain | Outperform | 2026-01-16 |
| Wells Fargo | Upgrade | Overweight | 2026-01-15 |
| Citigroup | Maintain | Buy | 2026-01-15 |
| Keybanc | Maintain | Overweight | 2026-01-13 |
| Truist Securities | Maintain | Hold | 2025-12-19 |
| UBS | Maintain | Buy | 2025-12-08 |
| Truist Securities | Maintain | Hold | 2025-11-26 |
CEVA, Inc. Grades
Below are recent grades from reputable institutions for CEVA, Inc.
| Grading Company | Action | New Grade | Date |
|---|---|---|---|
| Barclays | Maintain | Overweight | 2025-11-12 |
| Rosenblatt | Maintain | Buy | 2025-11-11 |
| Rosenblatt | Maintain | Buy | 2025-08-14 |
| Oppenheimer | Maintain | Outperform | 2025-05-09 |
| Rosenblatt | Maintain | Buy | 2025-05-08 |
| Barclays | Maintain | Overweight | 2025-05-08 |
| Rosenblatt | Maintain | Buy | 2025-04-23 |
| Barclays | Maintain | Overweight | 2025-02-14 |
| Rosenblatt | Maintain | Buy | 2025-02-14 |
| Rosenblatt | Maintain | Buy | 2025-02-11 |
Which company has the best grades?
Analog Devices, Inc. has more recent and diverse institutional coverage with predominantly Buy and Overweight ratings, including an upgrade by Wells Fargo. CEVA, Inc.’s ratings are consistent but older, mostly Buy and Overweight without recent upgrades. This suggests stronger current institutional confidence in Analog Devices, which could influence investor sentiment and liquidity.
Risks specific to each company
The following categories identify the critical pressure points and systemic threats facing both firms in the 2026 market environment:
1. Market & Competition
Analog Devices, Inc. (ADI)
- ADI operates in a highly competitive semiconductor sector with strong incumbents and must innovate continuously to maintain market share.
CEVA, Inc. (CEVA)
- CEVA faces intense competition as a technology licensor, relying heavily on licensees’ success and frequent innovation in DSP and AI processors.
2. Capital Structure & Debt
Analog Devices, Inc. (ADI)
- ADI benefits from a solid capital structure with a low debt-to-equity ratio (0.26) and strong interest coverage (9.54).
CEVA, Inc. (CEVA)
- CEVA has minimal debt (D/E 0.02) but zero interest coverage, signaling weak earnings versus debt obligations.
3. Stock Volatility
Analog Devices, Inc. (ADI)
- ADI’s beta near 1.03 suggests market-level volatility, typical for large-cap semiconductors.
CEVA, Inc. (CEVA)
- CEVA’s beta at 1.44 indicates higher volatility, reflecting its smaller size and riskier financial profile.
4. Regulatory & Legal
Analog Devices, Inc. (ADI)
- ADI, a global manufacturer, must navigate export controls and IP regulations across multiple jurisdictions.
CEVA, Inc. (CEVA)
- CEVA, as a licensor, faces regulatory risks tied to intellectual property protection and licensing disputes.
5. Supply Chain & Operations
Analog Devices, Inc. (ADI)
- ADI’s large-scale manufacturing exposes it to supply chain disruptions and raw material price volatility.
CEVA, Inc. (CEVA)
- CEVA’s model reduces supply chain risks but depends on licensees’ operational resilience.
6. ESG & Climate Transition
Analog Devices, Inc. (ADI)
- ADI faces pressure to reduce carbon footprint in manufacturing and ensure sustainable sourcing.
CEVA, Inc. (CEVA)
- CEVA’s lighter operational footprint lessens direct ESG risks but requires strong governance on tech ethics.
7. Geopolitical Exposure
Analog Devices, Inc. (ADI)
- ADI’s global footprint exposes it to US-China tensions and trade restrictions.
CEVA, Inc. (CEVA)
- CEVA’s licensing model buffers some geopolitical risks but remains vulnerable to cross-border IP enforcement issues.
Which company shows a better risk-adjusted profile?
ADI’s greatest risk lies in supply chain and geopolitical exposure, given its global manufacturing scale. CEVA’s most pressing threat is financial instability, marked by negative margins and poor interest coverage. ADI’s diversified operations and robust capital structure afford a superior risk-adjusted profile. CEVA’s high volatility and unfavorable profitability metrics amplify investor caution. Notably, ADI’s Altman Z-Score confirms strong financial health, while CEVA’s weaker Piotroski Score signals operational fragility.
Final Verdict: Which stock to choose?
Analog Devices, Inc. (ADI) stands out as a cash-generating powerhouse with a robust balance sheet and consistent profitability. Its growing operating returns indicate improving efficiency. A point of vigilance is its valuation premium, which tempers upside for cautious investors. ADI fits well in portfolios targeting stable, long-term growth.
CEVA, Inc. offers a strategic moat rooted in its specialized intellectual property and R&D intensity. However, it struggles with negative returns and value destruction, posing higher risk than ADI. CEVA might appeal to investors with appetite for speculative turnaround plays or exposure to niche tech innovation.
If you prioritize resilient cash flow and steady value creation, ADI is the compelling choice due to its improving profitability and financial strength. However, if you seek high-risk, high-reward potential through innovation-driven growth, CEVA offers superior exposure despite its challenges. Analytical prudence is essential for either scenario.
Disclaimer: Investment carries a risk of loss of initial capital. The past performance is not a reliable indicator of future results. Be sure to understand risks before making an investment decision.
Go Further
I encourage you to read the complete analyses of Analog Devices, Inc. and CEVA, Inc. to enhance your investment decisions: