Home > Comparison > Technology > AMAT vs ADI
The strategic rivalry between Applied Materials, Inc. and Analog Devices, Inc. defines the semiconductor sector’s competitive landscape. Applied Materials excels as a capital-intensive equipment manufacturer, while Analog Devices focuses on high-margin integrated circuit design. This head-to-head pits manufacturing scale against technological precision. This analysis aims to reveal which business model delivers superior risk-adjusted returns for a diversified portfolio amid evolving industry dynamics.
Table of contents
Companies Overview
Applied Materials and Analog Devices hold pivotal roles in the semiconductor industry, shaping its technological backbone.
Applied Materials, Inc.: Semiconductor Equipment Powerhouse
Applied Materials dominates as a leading supplier of manufacturing equipment for semiconductor fabrication. Its revenue hinges on selling sophisticated tools across epitaxy, deposition, and metrology technologies. In 2026, the firm focuses on expanding its semiconductor systems and global services segments, targeting efficiency gains and innovation in chip manufacturing.
Analog Devices, Inc.: Analog and Mixed-Signal Innovator
Analog Devices excels in designing integrated circuits and signal processing solutions crucial for analog-to-digital conversion and power management. Its core revenue stems from industrial, automotive, and communications markets. This year, ADI prioritizes enhancing mixed-signal product performance and expanding applications in automotive and aerospace verticals.
Strategic Collision: Similarities & Divergences
Both companies anchor the semiconductor value chain but diverge in approach: Applied Materials builds manufacturing infrastructure, while Analog Devices focuses on component-level innovation. Their primary battleground lies in advancing semiconductor technology, from fabrication to system integration. Investors face distinct profiles—Applied Materials offers capital-intensive industrial scale, whereas Analog Devices delivers specialized, technology-driven growth.
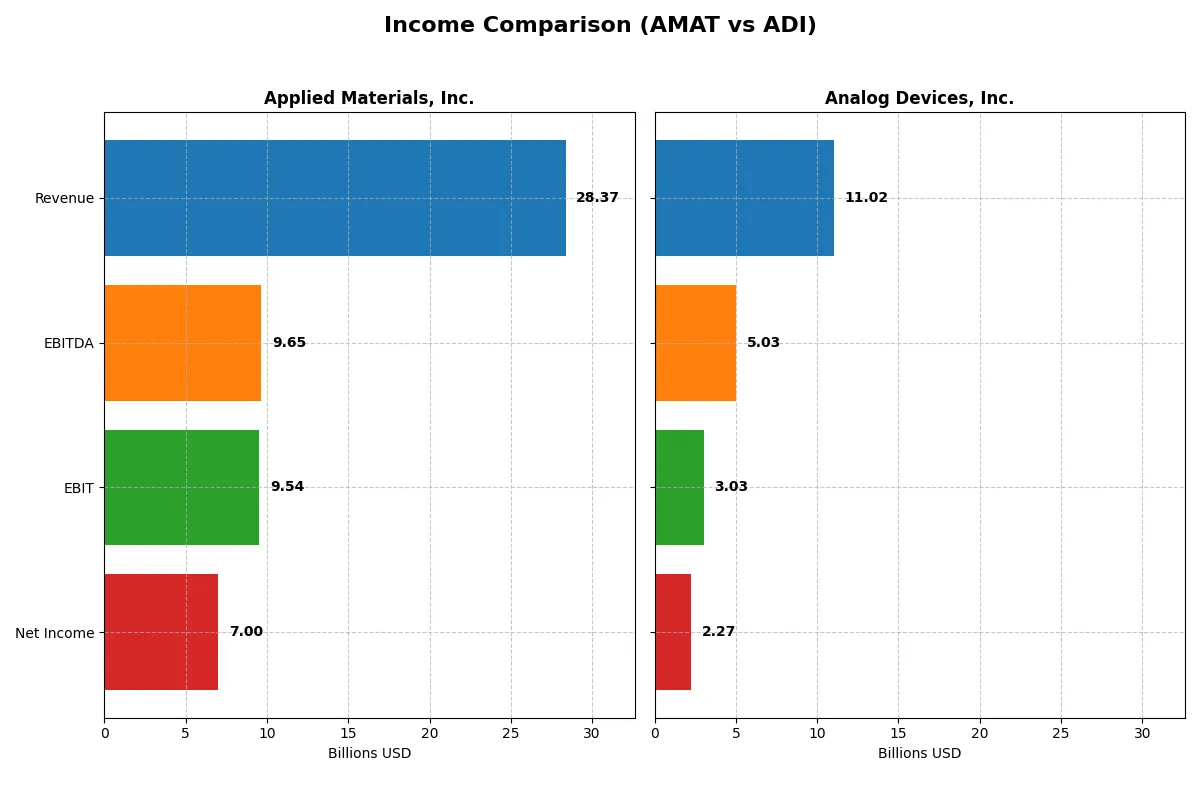
Income Statement Comparison
This data dissects the core profitability and scalability of both corporate engines to reveal who dominates the bottom line:
| Metric | Applied Materials, Inc. (AMAT) | Analog Devices, Inc. (ADI) |
|---|---|---|
| Revenue | 28.4B | 11.0B |
| Cost of Revenue | 14.6B | 5.0B |
| Operating Expenses | 5.52B | 3.02B |
| Gross Profit | 13.8B | 6.0B |
| EBITDA | 9.65B | 5.03B |
| EBIT | 9.54B | 3.03B |
| Interest Expense | 269M | 318M |
| Net Income | 7.00B | 2.27B |
| EPS | 8.71 | 4.59 |
| Fiscal Year | 2025 | 2025 |
Income Statement Analysis: The Bottom-Line Duel
This income statement comparison reveals which company converts revenue into profit most efficiently, spotlighting operational momentum and margin strength.
Applied Materials, Inc. Analysis
Applied Materials grew revenue steadily from $23B in 2021 to $28.4B in 2025, with net income rising from $5.9B to $7B. Gross margin remains strong near 49%, signaling robust cost control. Despite a slight dip in net margin last year, operational efficiency improved, reflected in a 13.6% EBIT increase and stable EPS growth.
Analog Devices, Inc. Analysis
Analog Devices accelerated revenue growth sharply, from $7.3B in 2021 to $11B in 2025, with net income doubling to $2.3B. Its gross margin stands superior at 54.7%, though EBIT margin trails Applied Materials at 27.5%. Strong momentum shows in a 44% EBIT surge and 39% EPS growth last year, reflecting effective expense management and growing profitability.
Margin Discipline vs. Growth Acceleration
Applied Materials leads in absolute profit and margin stability, with a 24.7% net margin outpacing Analog Devices’ 20.6%. However, Analog Devices exhibits faster revenue and income growth, with 50.6% revenue and 63% net income gains over five years. Investors valuing consistent margin power might prefer Applied Materials, while those seeking high momentum could favor Analog Devices’ rapid expansion.
Financial Ratios Comparison
These vital ratios act as a diagnostic tool to expose underlying fiscal health, valuation premiums, and capital efficiency for Applied Materials (AMAT) and Analog Devices (ADI):
| Ratios | Applied Materials (AMAT) | Analog Devices (ADI) |
|---|---|---|
| ROE | 34.3% | 6.7% |
| ROIC | 21.9% | 5.5% |
| P/E | 26.6 | 51.1 |
| P/B | 9.1 | 3.4 |
| Current Ratio | 2.61 | 2.19 |
| Quick Ratio | 1.87 | 1.68 |
| D/E | 0.35 | 0.26 |
| Debt-to-Assets | 19.4% | 18.1% |
| Interest Coverage | 30.8 | 9.5 |
| Asset Turnover | 0.78 | 0.23 |
| Fixed Asset Turnover | 5.54 | 3.32 |
| Payout Ratio | 19.8% | 84.9% |
| Dividend Yield | 0.74% | 1.66% |
| Fiscal Year | 2025 | 2025 |
Efficiency & Valuation Duel: The Vital Signs
Ratios act as a company’s DNA, exposing hidden risks and operational strengths critical for investment decisions.
Applied Materials, Inc.
Applied Materials displays robust profitability with a 34.28% ROE and a strong 24.67% net margin, indicating operational efficiency. However, its valuation appears stretched with a P/E of 26.58 and P/B of 9.11. Shareholders receive a modest 0.74% dividend yield, reflecting a cautious capital return approach favoring reinvestment in growth and R&D.
Analog Devices, Inc.
Analog Devices shows lower profitability, with a 6.7% ROE and a 20.58% net margin, signaling weaker efficiency. The stock trades at a high P/E of 51.05, suggesting an expensive valuation. It offers a 1.66% dividend yield, balancing returns with ongoing investment in research to drive future growth despite pressured margins.
Premium Valuation vs. Operational Safety
Applied Materials combines strong returns and solid balance sheet metrics, despite a stretched valuation. Analog Devices carries a higher valuation premium but delivers lower profitability and weaker asset turnover. Investors favoring operational safety and efficiency may lean toward Applied Materials, while those prioritizing income might consider Analog Devices’ dividends.
Which one offers the Superior Shareholder Reward?
I compare Applied Materials (AMAT) and Analog Devices (ADI) on dividends, payout ratios, and buybacks to assess shareholder rewards. AMAT yields 0.74% with a conservative 20% payout, backed by strong free cash flow coverage (~72%). ADI offers a higher 1.66% yield but pays out 85% of earnings, risking sustainability. Both deploy buybacks, but AMAT’s disciplined capital allocation and healthier cash flow coverage suggest more durable returns. Historically, steady dividends paired with buybacks generate consistent shareholder value in tech hardware. I conclude AMAT delivers a superior total return profile for 2026 investors seeking balanced income and growth.
Comparative Score Analysis: The Strategic Profile
The radar chart reveals the fundamental DNA and trade-offs of Applied Materials, Inc. and Analog Devices, Inc.:
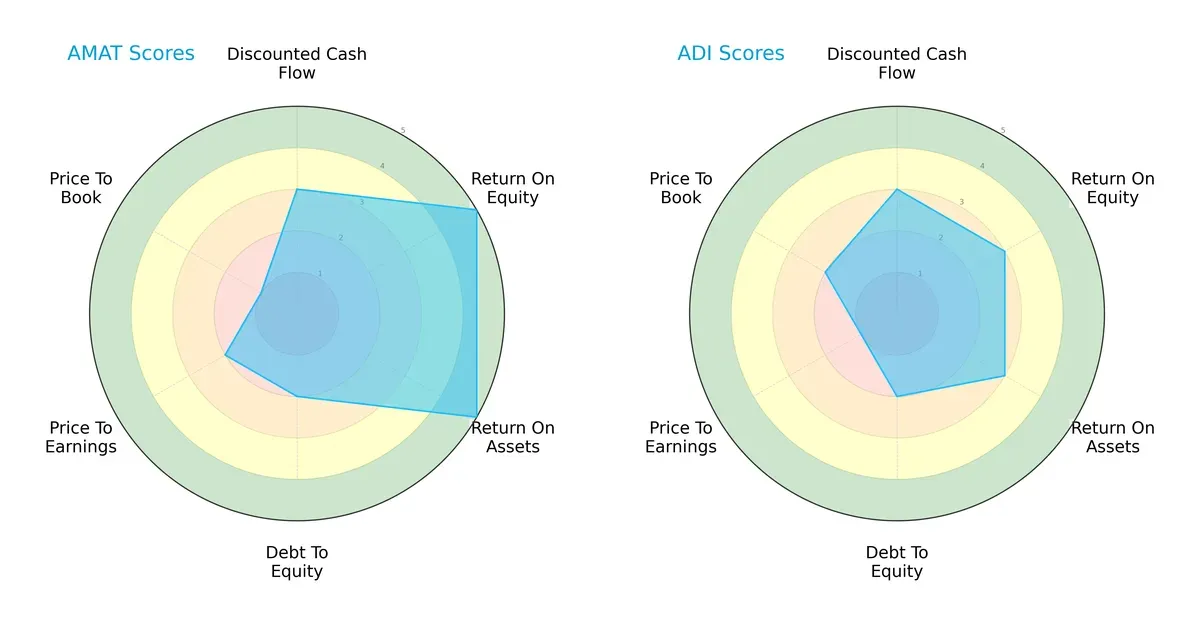
Applied Materials outperforms with very favorable ROE and ROA scores, showing operational efficiency. However, it faces valuation challenges with a very unfavorable price-to-book score. Analog Devices presents a more moderate but balanced profile, with neither extreme strengths nor glaring weaknesses. AMAT leans on profitability, while ADI offers steadiness without a specific edge.
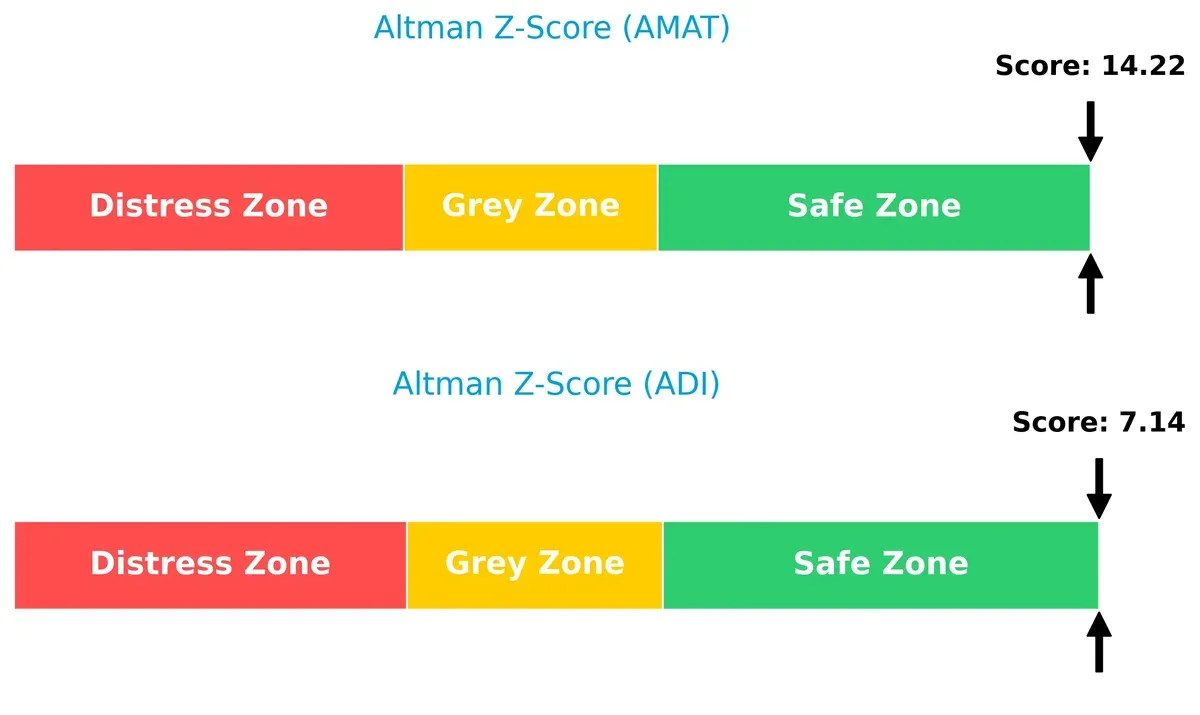
Bankruptcy Risk: Solvency Showdown
Applied Materials shows a much stronger Altman Z-Score than Analog Devices, signaling superior long-term survival prospects in this cycle:
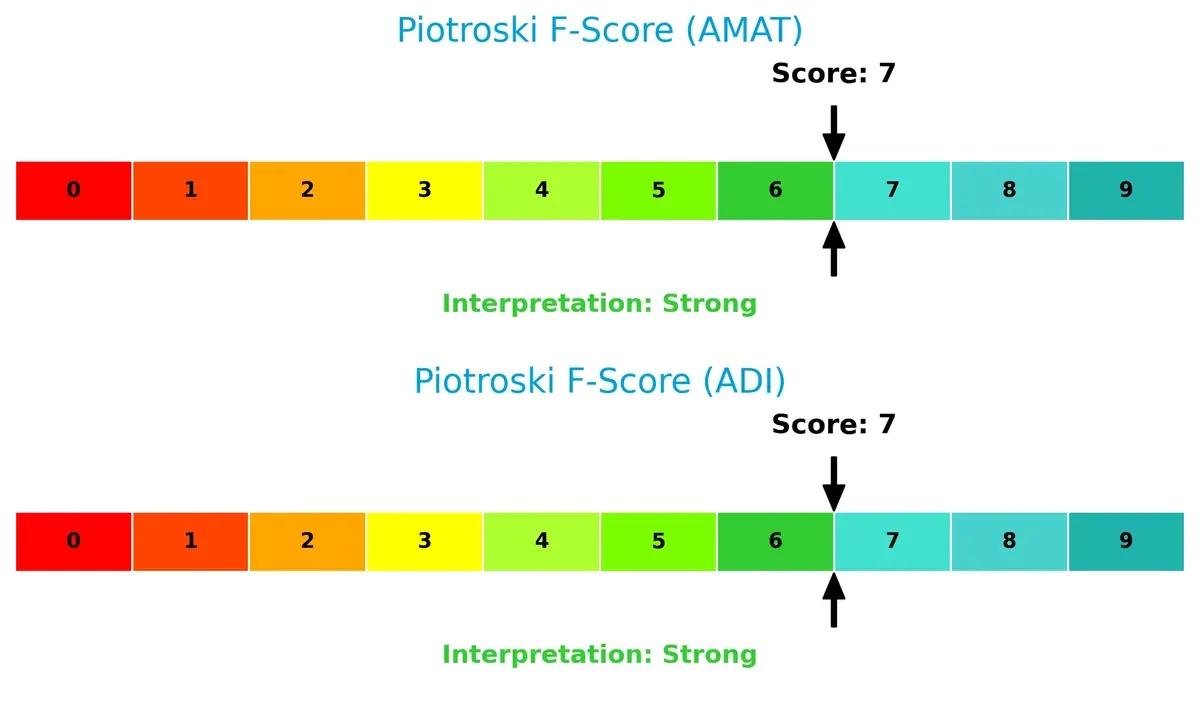
Financial Health: Quality of Operations
Both companies score a solid 7 on the Piotroski F-Score, indicating strong financial health. Neither shows red flags, but this parity suggests investors should weigh other factors carefully:
How are the two companies positioned?
This section dissects AMAT and ADI’s operational DNA by comparing revenue distribution and internal dynamics. The goal is to confront their economic moats and identify which model offers the most resilient competitive advantage today.
Revenue Segmentation: The Strategic Mix
This visual comparison dissects how Applied Materials, Inc. and Analog Devices, Inc. diversify their income streams and where their primary sector bets lie:
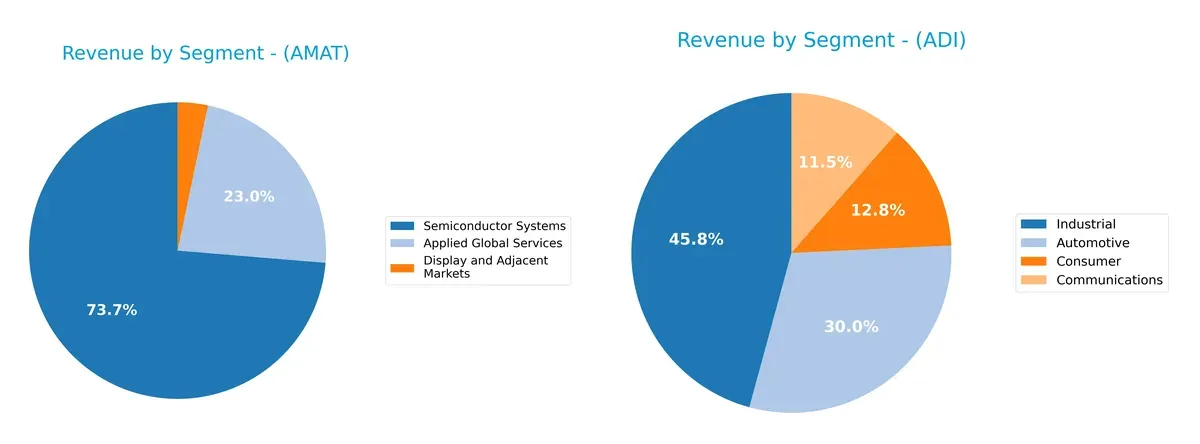
Applied Materials anchors revenue in Semiconductor Systems with $19.9B, dwarfing its other segments like Applied Global Services at $6.2B. Analog Devices shows a more balanced mix, with Industrial leading at $4.3B, followed by Automotive at $2.8B and Communications at $1.1B. AMAT’s reliance on semiconductors signals infrastructure dominance but concentration risk. ADI’s diversified base mitigates volatility, pivoting on multiple industrial applications.
Strengths and Weaknesses Comparison
This table compares the Strengths and Weaknesses of Applied Materials, Inc. and Analog Devices, Inc.:
Applied Materials Strengths
- Higher profitability with net margin 24.67% and ROE 34.28%
- Strong liquidity ratios with current ratio 2.61 and quick ratio 1.87
- Diversified revenue streams across semiconductor systems and global services
- Significant global presence, especially in China and Korea
- Favorable debt management with D/E 0.35 and interest coverage 35.46
Analog Devices Strengths
- Diversified product segments including automotive, industrial, and communications
- Favorable liquidity with current ratio 2.19 and quick ratio 1.68
- Global geographic diversification across Europe, US, and Asia
- Favorable debt levels with D/E 0.26 and interest coverage 9.54
- Moderate dividend yield at 1.66% provides income potential
Applied Materials Weaknesses
- Elevated valuation metrics with PE 26.58 and PB 9.11 considered high
- Weighted average cost of capital (WACC) at 11.37% exceeds ROIC risk
- Dividend yield low at 0.74% limits income appeal
- Asset turnover neutral at 0.78 shows moderate efficiency
Analog Devices Weaknesses
- Low ROE at 6.7% signals weak shareholder returns
- High PE ratio of 51.05 suggests overvaluation risk
- Asset turnover very low at 0.23 indicates inefficient asset use
- PB ratio 3.42 still high, limiting margin of safety
Both companies show solid diversification and global reach, but Applied Materials leads in profitability and financial health. Analog Devices struggles with returns and efficiency despite reasonable diversification. These factors shape their strategic priorities differently.
The Moat Duel: Analyzing Competitive Defensibility
A structural moat is the only true shield guarding long-term profits against relentless competition erosion. Let’s dissect two semiconductor titans’ moats:
Applied Materials, Inc.: Equipment Scale & Intangible Innovation
Applied Materials leverages a cost advantage and intangible assets rooted in complex manufacturing tech. Its high ROIC, despite a recent decline, signals value creation. New fab automation and display tech could deepen its moat in 2026.
Analog Devices, Inc.: Innovation-Driven Product Differentiation
Analog Devices relies on intangible assets and product innovation, focusing on analog and mixed-signal ICs. Unlike Applied, ADI shows growing ROIC but currently sheds value. Expansion into automotive and industrial markets offers strong upside.
Equipment Scale vs. Product Innovation: The Moat Face-Off
Applied Materials holds a wider moat with consistent value creation despite ROIC pressure. Analog Devices’ improving profitability suggests potential, but it still needs to convert growth into value. AMAT remains better equipped to defend market share.
Which stock offers better returns?
Both Applied Materials, Inc. and Analog Devices, Inc. exhibit strong bullish trends over the past year, marked by significant price appreciation and accelerating momentum.
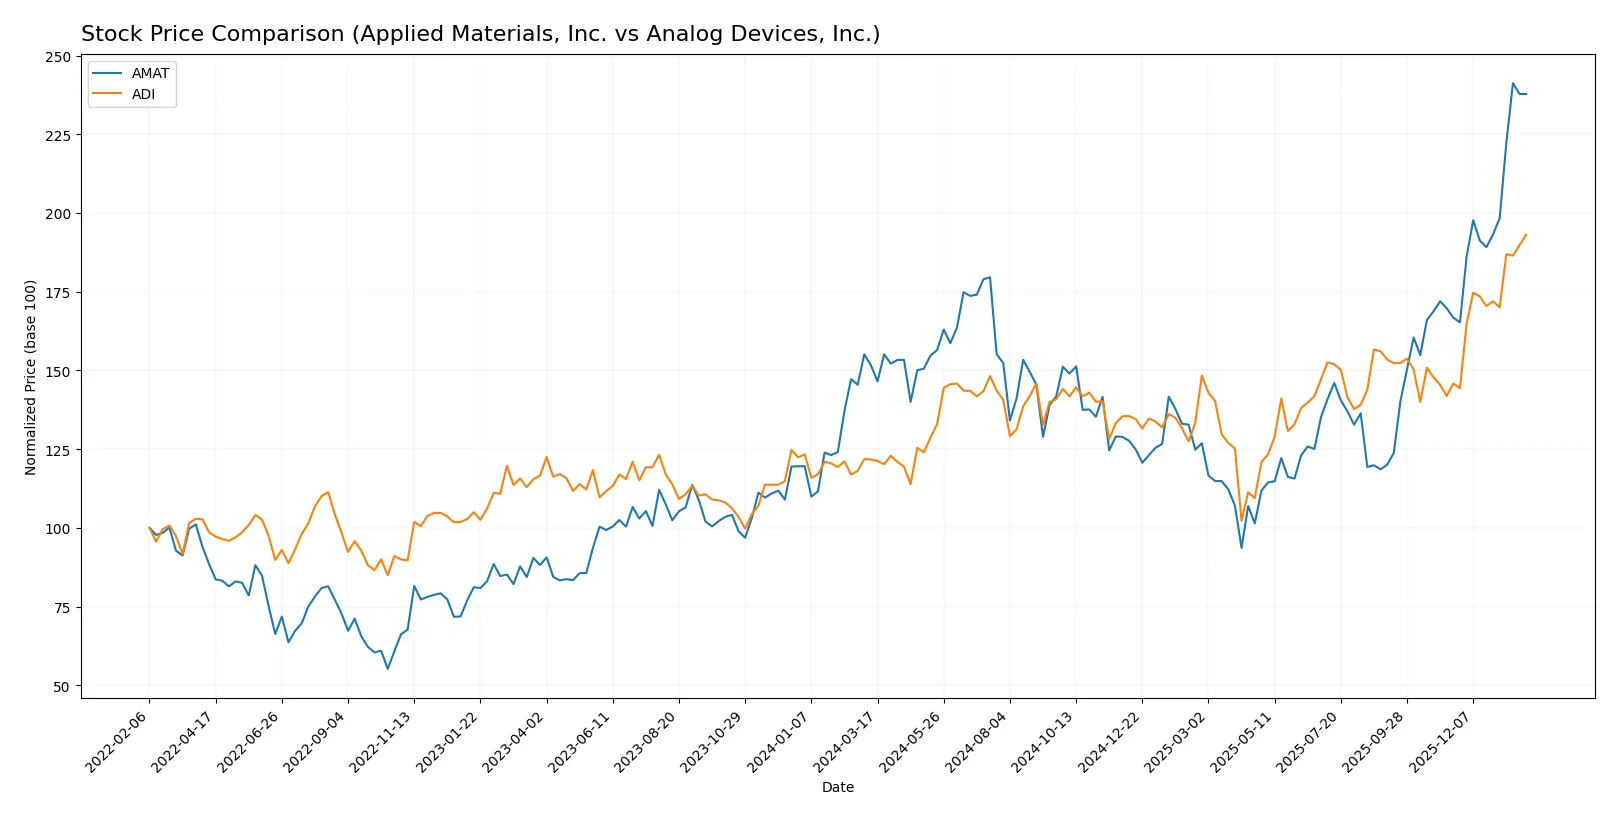
Trend Comparison
Applied Materials shows a 56.8% price increase over 12 months with accelerating momentum. Volatility is high, reflected in a 38.96 std deviation and a wide price range between 127 and 327.
Analog Devices outperforms slightly with a 58.66% gain, also accelerating. It displays lower volatility at 26.38 std deviation, with prices ranging from 165 to nearly 311 over the year.
Analog Devices leads in total returns and exhibits steadier price action than Applied Materials, delivering the highest market performance in this comparison.
Target Prices
Analysts present a solid target price consensus for Applied Materials and Analog Devices, signaling cautious optimism.
| Company | Target Low | Target High | Consensus |
|---|---|---|---|
| Applied Materials, Inc. | 273 | 400 | 347.38 |
| Analog Devices, Inc. | 270 | 375 | 316 |
The consensus targets exceed current prices, implying upside potential. Applied Materials shows a stronger range, reflecting higher volatility and opportunity.

Don’t Let Luck Decide Your Entry Point
Optimize your entry points with our advanced ProRealTime indicators. You’ll get efficient buy signals with precise price targets for maximum performance. Start outperforming now!
How do institutions grade them?
Applied Materials, Inc. Grades
The latest grades from top institutions for Applied Materials are listed below:
| Grading Company | Action | New Grade | Date |
|---|---|---|---|
| Mizuho | Upgrade | Outperform | 2026-01-28 |
| Deutsche Bank | Upgrade | Buy | 2026-01-23 |
| Needham | Maintain | Buy | 2026-01-20 |
| Keybanc | Maintain | Overweight | 2026-01-16 |
| Barclays | Upgrade | Overweight | 2026-01-15 |
| Wells Fargo | Maintain | Overweight | 2026-01-15 |
| Stifel | Maintain | Buy | 2026-01-14 |
| B of A Securities | Maintain | Buy | 2026-01-13 |
| Susquehanna | Upgrade | Positive | 2026-01-12 |
| Cantor Fitzgerald | Maintain | Overweight | 2026-01-08 |
Analog Devices, Inc. Grades
Here are the current institutional grades for Analog Devices:
| Grading Company | Action | New Grade | Date |
|---|---|---|---|
| Susquehanna | Maintain | Positive | 2026-01-22 |
| B of A Securities | Maintain | Buy | 2026-01-21 |
| Stifel | Maintain | Buy | 2026-01-16 |
| Oppenheimer | Maintain | Outperform | 2026-01-16 |
| Wells Fargo | Upgrade | Overweight | 2026-01-15 |
| Citigroup | Maintain | Buy | 2026-01-15 |
| Keybanc | Maintain | Overweight | 2026-01-13 |
| Truist Securities | Maintain | Hold | 2025-12-19 |
| UBS | Maintain | Buy | 2025-12-08 |
| Truist Securities | Maintain | Hold | 2025-11-26 |
Which company has the best grades?
Applied Materials holds a stronger consensus with multiple upgrades to “Outperform” and “Buy” grades. Analog Devices shows solid “Buy” and “Outperform” ratings but includes several “Hold” grades. Investors may view Applied Materials’ upgrades as a more bullish signal.
Risks specific to each company
The following categories identify the critical pressure points and systemic threats facing both firms in the 2026 market environment:
1. Market & Competition
Applied Materials, Inc.
- Faces intense competition in semiconductor manufacturing equipment, requiring continuous innovation to maintain its leading position.
Analog Devices, Inc.
- Competes in analog and mixed-signal IC markets but struggles with slower asset turnover, indicating potential efficiency issues.
2. Capital Structure & Debt
Applied Materials, Inc.
- Maintains a conservative debt-to-equity ratio of 0.35 and strong interest coverage, supporting financial stability.
Analog Devices, Inc.
- Displays slightly lower debt levels (0.26) but weaker interest coverage, which could pressure cash flow in downturns.
3. Stock Volatility
Applied Materials, Inc.
- Exhibits higher beta (1.671), indicating greater volatility and sensitivity to market swings.
Analog Devices, Inc.
- Lower beta (1.032) suggests reduced stock volatility, appealing to risk-averse investors.
4. Regulatory & Legal
Applied Materials, Inc.
- Operates globally with exposure to semiconductor export controls, especially involving China and Asia-Pacific.
Analog Devices, Inc.
- Faces regulatory scrutiny in multiple jurisdictions but benefits from diversified industrial end markets.
5. Supply Chain & Operations
Applied Materials, Inc.
- Complex supply chain with reliance on advanced materials; risks from geopolitical tensions and component shortages.
Analog Devices, Inc.
- Supply chain less complex but impacted by slower asset turnover, possibly reflecting operational inefficiencies.
6. ESG & Climate Transition
Applied Materials, Inc.
- Increasing pressure to reduce carbon footprint in manufacturing; invests in sustainable technologies.
Analog Devices, Inc.
- Faces rising ESG demands but has yet to fully integrate climate transition strategies into operations.
7. Geopolitical Exposure
Applied Materials, Inc.
- Significant exposure to Asia-Pacific markets, vulnerable to US-China trade tensions and export restrictions.
Analog Devices, Inc.
- Also exposed internationally but less dependent on Asia-Pacific, slightly mitigating geopolitical risks.
Which company shows a better risk-adjusted profile?
Applied Materials faces its greatest risk from high market volatility and geopolitical tensions impacting its supply chain. Analog Devices’ largest concern lies in operational inefficiencies reflected by poor asset turnover and elevated valuation multiples. Overall, Analog Devices exhibits a more balanced risk profile with lower stock volatility and moderate debt levels. However, its high price-to-earnings ratio signals potential overvaluation risk. Applied Materials demonstrates stronger profitability and financial health but must navigate a more volatile market and geopolitical uncertainty. Recent data show Applied Materials’ beta at 1.67 versus Analog Devices’ 1.03, underscoring the risk differential that justifies my caution.
Final Verdict: Which stock to choose?
Applied Materials, Inc. (AMAT) impresses with its superpower of delivering strong capital efficiency and robust profitability. Its ability to generate returns well above its cost of capital marks it as a value creator. The main point of vigilance is its slightly declining ROIC trend, which could signal future margin pressures. AMAT fits well within an Aggressive Growth portfolio seeking durable industry leadership.
Analog Devices, Inc. (ADI) stands out with a strategic moat rooted in innovation and high-margin recurring revenue streams. While its profitability currently lags and it is shedding value relative to its capital cost, ADI’s improving ROIC trajectory provides a compelling turnaround story. Its safer balance sheet and consistent income growth make it suitable for a GARP (Growth at a Reasonable Price) investor looking for stability with upside potential.
If you prioritize sustained capital returns and proven value creation, AMAT is the compelling choice due to its superior profitability and efficient capital use. However, if you seek growth fueled by innovation and improving operational metrics, ADI offers better stability and a promising ROIC recovery. Both present valid scenarios depending on your risk tolerance and portfolio strategy.
Disclaimer: Investment carries a risk of loss of initial capital. The past performance is not a reliable indicator of future results. Be sure to understand risks before making an investment decision.
Go Further
I encourage you to read the complete analyses of Applied Materials, Inc. and Analog Devices, Inc. to enhance your investment decisions: