Home > Comparison > Technology > APH vs TRMB
The strategic rivalry between Amphenol Corporation and Trimble Inc. shapes the evolution of the technology hardware sector. Amphenol operates as a capital-intensive industrial leader in electrical connectors and interconnect systems. Trimble focuses on high-margin software and precision technology solutions for construction, agriculture, and transportation. This analysis explores their contrasting operational models to determine which offers superior risk-adjusted returns for a diversified portfolio in today’s competitive landscape.
Table of contents
Companies Overview
Amphenol Corporation and Trimble Inc. stand as significant players in the hardware and equipment sector, shaping diverse technology markets.
Amphenol Corporation: Global Connector and Sensor Leader
Amphenol Corporation dominates the electrical and electronic connectors market with a broad portfolio serving automotive, aerospace, and communication industries. Its revenue primarily derives from designing and manufacturing harsh environment connectors, fiber optics, and sensor systems. In 2026, the company focuses on expanding its product range in harsh environment solutions and enhancing value-add offerings like cable assemblies.
Trimble Inc.: Precision Technology Innovator
Trimble Inc. excels in delivering technology solutions that optimize workflows for construction, agriculture, and transportation sectors. Its core revenue comes from software and hardware that improve asset management, 3D modeling, and autonomous guidance systems. The firm’s 2026 strategy emphasizes integrating advanced geospatial technologies and expanding mobility and transportation management solutions.
Strategic Collision: Similarities & Divergences
Both companies operate in hardware and equipment but pursue contrasting philosophies: Amphenol emphasizes robust physical interconnects while Trimble focuses on software-driven precision and automation. They compete primarily in industrial and infrastructure markets, yet Amphenol leans toward durable components, and Trimble prioritizes digital transformation. This divergence creates distinct investment profiles—Amphenol as a manufacturing stalwart and Trimble as a tech-enabled solutions innovator.
Income Statement Comparison
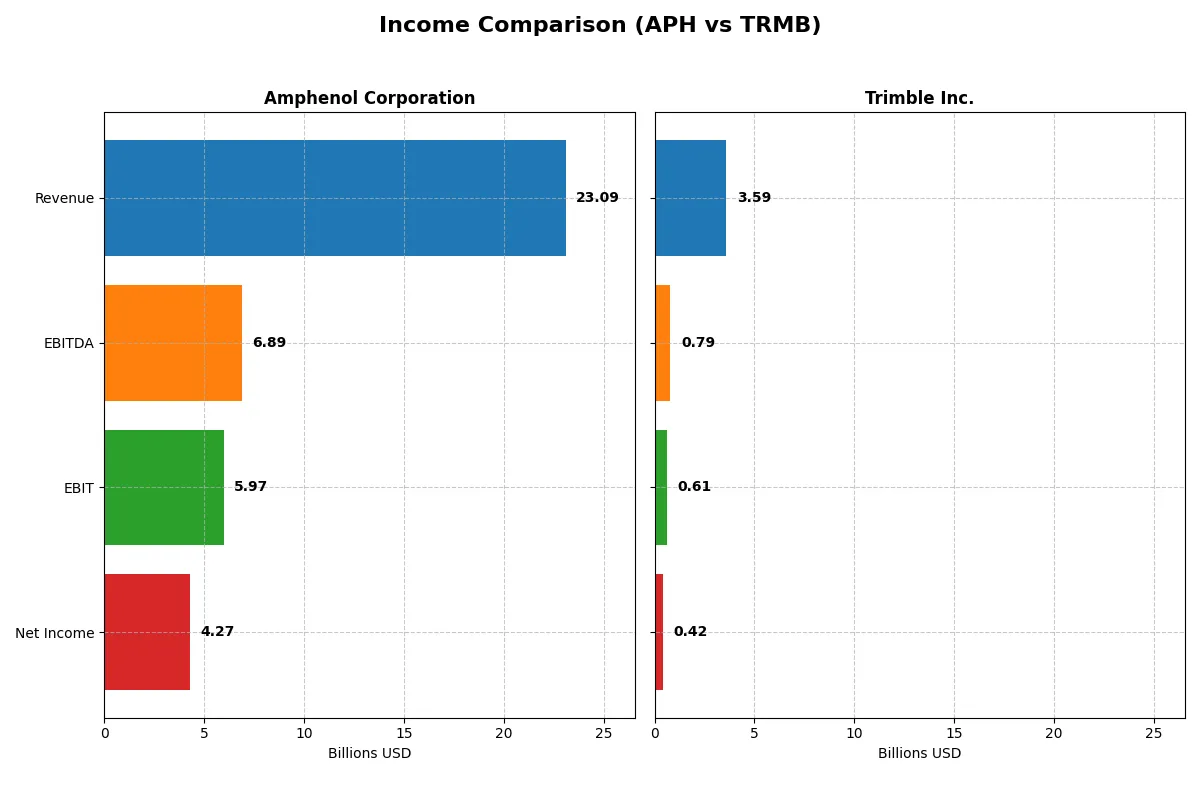
The following data dissects the core profitability and scalability of both corporate engines to reveal who dominates the bottom line:
| Metric | Amphenol Corporation (APH) | Trimble Inc. (TRMB) |
|---|---|---|
| Revenue | 23.1B | 3.59B |
| Cost of Revenue | 14.6B | 1.14B |
| Operating Expenses | 2.55B | 1.84B |
| Gross Profit | 8.52B | 2.45B |
| EBITDA | 6.89B | 789M |
| EBIT | 5.97B | 610M |
| Interest Expense | 368M | 74M |
| Net Income | 4.27B | 424M |
| EPS | 3.51 | 1.77 |
| Fiscal Year | 2025 | 2025 |
Income Statement Analysis: The Bottom-Line Duel
The forthcoming income statement comparison exposes the true operational efficiency and profitability trends of two distinct corporate engines.
Amphenol Corporation Analysis
Amphenol’s revenue surged from $10.9B in 2021 to $23.1B in 2025, with net income nearly tripling from $1.59B to $4.27B. Its gross margin holds steady at 36.9%, while net margin improved to 18.5%, reflecting strong operational leverage. The 2025 year marks a significant momentum boost, with EBIT growing 85% year-over-year, underscoring impressive margin expansion and disciplined cost control.
Trimble Inc. Analysis
Trimble’s revenue peaked near $3.8B in 2023 but dipped 2.6% to $3.59B in 2025. Net income fell sharply from $1.51B in 2024 to $424M in 2025, compressing net margin to 11.8%. Despite a high gross margin of 68.3%, EBIT margin declined to 17%, signaling margin pressure. The latest fiscal year reveals weakening profitability and a troubling 71% drop in EPS, indicating operational challenges.
Margin Expansion vs. Profit Contraction
Amphenol delivers a clear fundamental edge with robust revenue growth exceeding 110% over five years and steady margin expansion. Trimble’s stagnant revenue and steep profit decline highlight operational inefficiencies. For investors, Amphenol’s profile offers superior earnings momentum and margin resilience, making it the more attractive choice in this comparison.
Financial Ratios Comparison
These vital ratios act as a diagnostic tool to expose the underlying fiscal health, valuation premiums, and capital efficiency of the companies analyzed:
| Ratios | Amphenol Corporation (APH) | Trimble Inc. (TRMB) |
|---|---|---|
| ROE | 31.8% | 7.3% |
| ROIC | 15.1% | 6.5% |
| P/E | 38.6 | 43.9 |
| P/B | 12.3 | 3.2 |
| Current Ratio | 2.98 | 1.09 |
| Quick Ratio | 2.48 | 0.96 |
| D/E | 1.16 | 0.24 |
| Debt-to-Assets | 42.8% | 15.0% |
| Interest Coverage | 16.2 | 8.2 |
| Asset Turnover | 0.64 | 0.39 |
| Fixed Asset Turnover | 10.0 | 19.6 |
| Payout ratio | 18.8% | 0% |
| Dividend yield | 0.49% | 0% |
| Fiscal Year | 2025 | 2025 |
Efficiency & Valuation Duel: The Vital Signs
Ratios act as a company’s DNA, unveiling hidden risks and operational excellence behind the numbers investors see.
Amphenol Corporation
Amphenol posts a robust 31.8% ROE and efficient 18.5% net margin, signaling strong profitability. Its P/E of 38.6 appears stretched versus sector norms, reflecting premium valuation. The company maintains a modest 0.5% dividend yield, favoring steady shareholder returns while balancing growth and capital allocation prudently.
Trimble Inc.
Trimble’s 7.3% ROE and 11.8% net margin reveal weaker profitability. The stock trades at a higher P/E of 43.9, suggesting an expensive valuation with less operational efficiency. It pays no dividend, instead reinvesting heavily in R&D to fuel growth, which may appeal to long-term growth-focused investors but carries execution risk.
Premium Valuation vs. Operational Safety
Amphenol offers a better balance of profitability and manageable risk despite a stretched valuation. Trimble’s higher valuation with weaker returns flags greater risk. Amphenol suits investors prioritizing operational strength; Trimble fits those chasing growth with tolerance for volatility.
Which one offers the Superior Shareholder Reward?
I see Amphenol (APH) combines a modest dividend yield of 0.49% with a conservative payout ratio near 19%. Its free cash flow covers dividends almost threefold, showing disciplined capital allocation. Amphenol also executes steady buybacks, enhancing shareholder value sustainably. In contrast, Trimble (TRMB) pays no dividend, reinvesting heavily in R&D and growth. Its free cash flow yield is lower, and buybacks are less prominent. Historically, I’ve observed industrial tech firms like APH reward shareholders better via balanced dividends and buybacks. Thus, for 2026, I favor Amphenol’s distribution model as a more reliable total return vehicle.
Comparative Score Analysis: The Strategic Profile
The radar chart reveals the fundamental DNA and trade-offs of Amphenol Corporation and Trimble Inc., highlighting their distinct financial strengths and vulnerabilities:
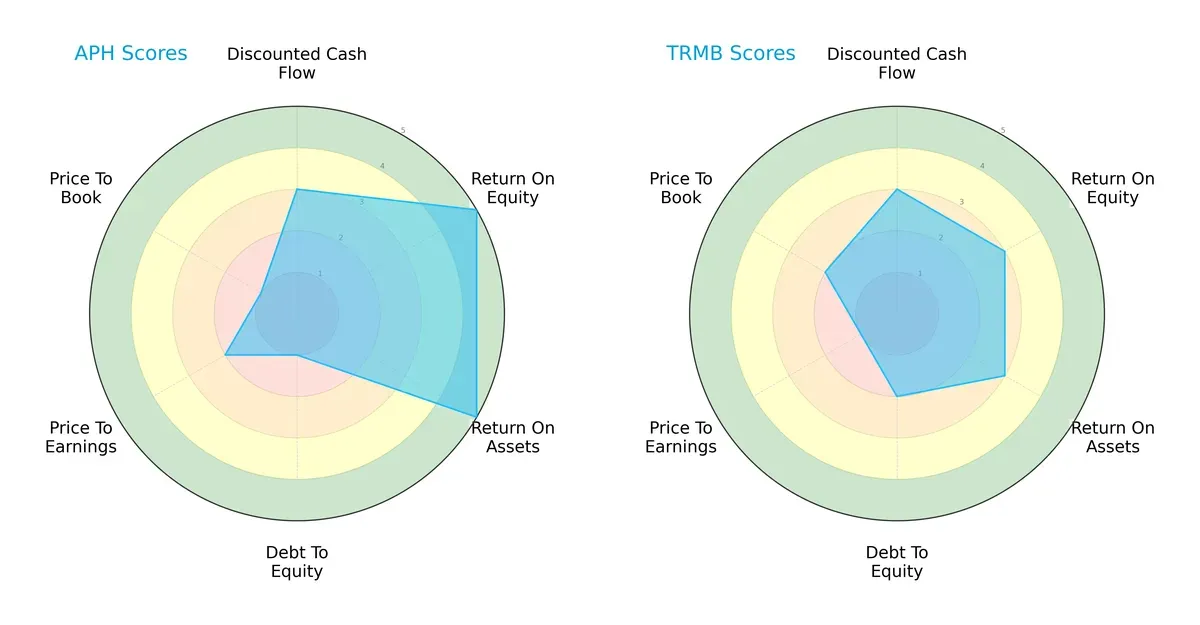
Amphenol delivers strong returns with top-tier ROE and ROA scores (5 each), signaling efficient profit generation and asset use. However, its balance sheet shows risk, with a very unfavorable debt-to-equity score (1) and weak valuation metrics (PE: 2, PB: 1). Trimble presents a more modest operational profile (ROE 3, ROA 3) but maintains slightly better debt management (score 2). Both companies carry valuation challenges, yet Amphenol’s superior operational efficiency offers a more balanced growth edge, while Trimble depends more on contained leverage.
Bankruptcy Risk: Solvency Showdown
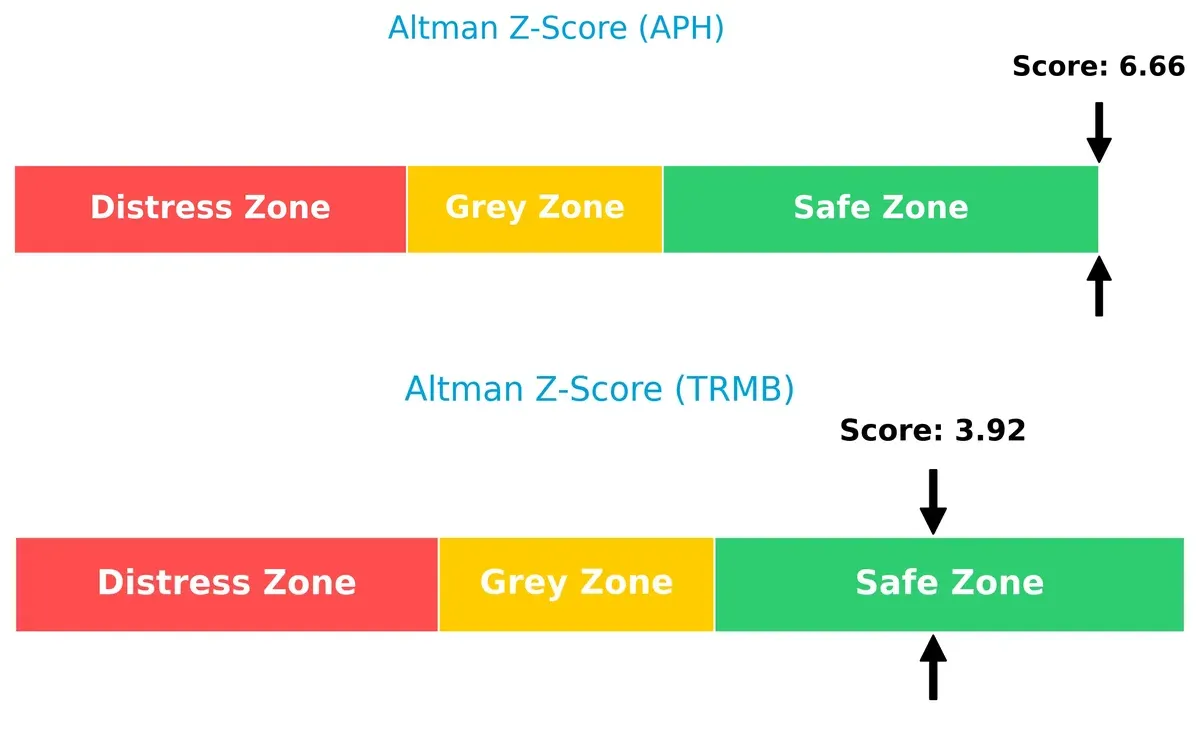
Amphenol’s Altman Z-Score of 6.66 versus Trimble’s 3.92 places both firms comfortably in the safe zone, yet Amphenol’s higher score signals a more robust buffer against financial distress in this economic cycle:
Financial Health: Quality of Operations
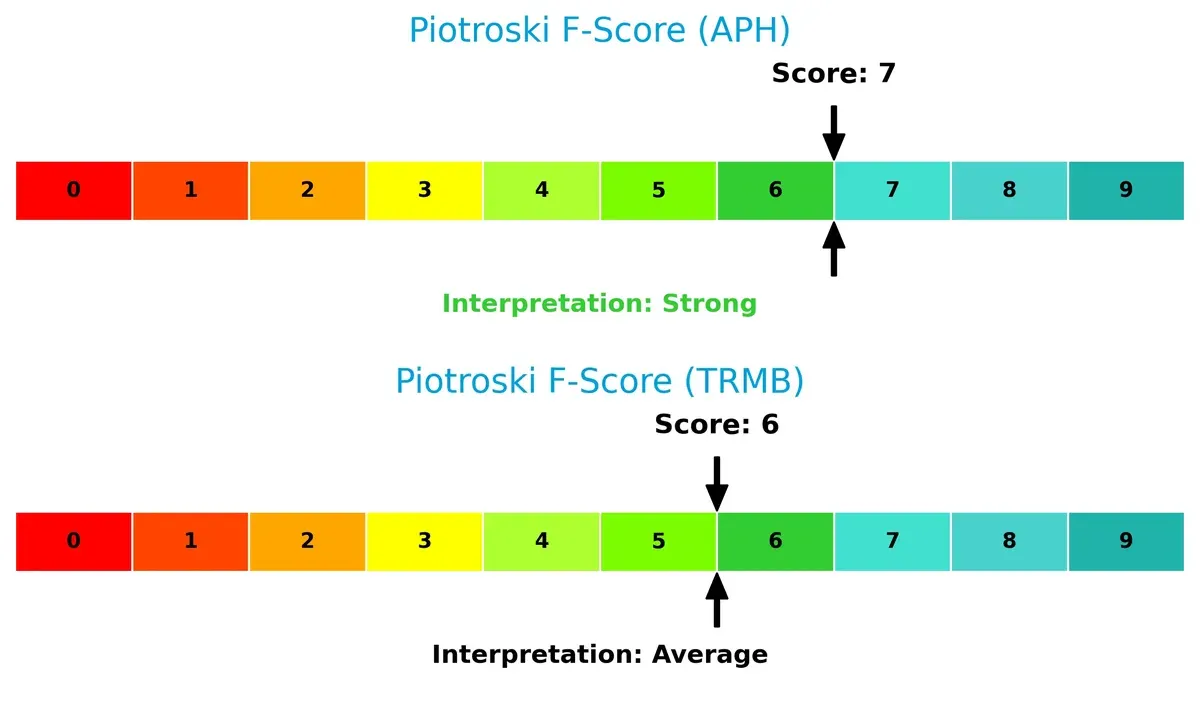
Amphenol’s Piotroski F-Score of 7 surpasses Trimble’s 6, indicating stronger internal financial health and fewer red flags in profitability, leverage, and liquidity metrics:
How are the two companies positioned?
This section dissects the operational DNA of Amphenol and Trimble by comparing their revenue distribution and internal dynamics. The goal is to confront their economic moats and identify which model offers the most resilient competitive advantage today.
Revenue Segmentation: The Strategic Mix
This visual comparison dissects how Amphenol Corporation and Trimble Inc. diversify their income streams and where their primary sector bets lie:
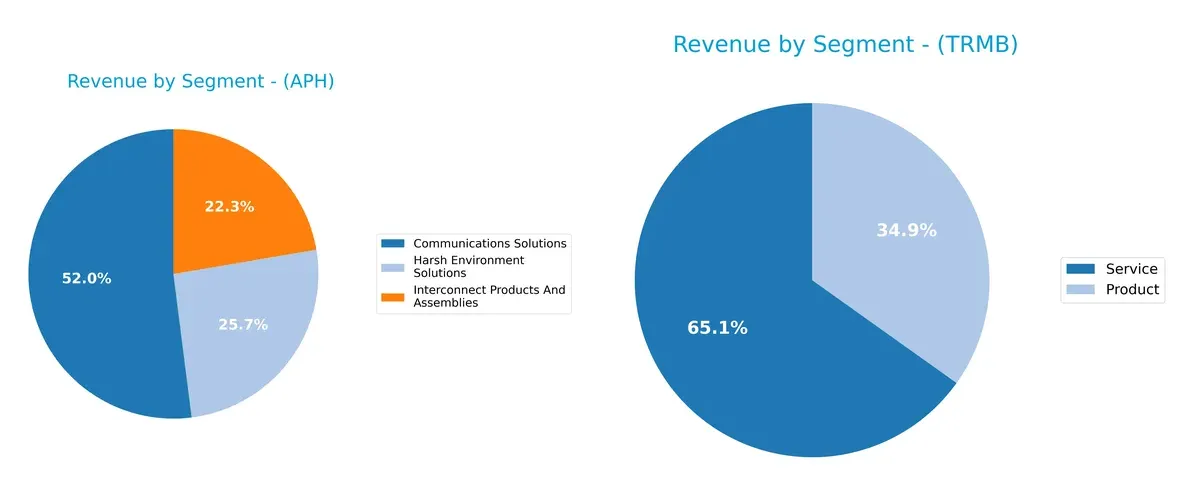
Amphenol’s revenue pivots heavily on Communications Solutions at $12.2B, dwarfing its Harsh Environment ($6B) and Interconnect ($5.2B) segments. This signals a concentrated bet on communication infrastructure. Trimble shows a more balanced mix, with $2.4B in Services and $1.3B in Products in 2024, reflecting diversification across solutions and recurring revenue streams. Amphenol’s concentration risks contrast with Trimble’s broader ecosystem lock-in strategy.
Strengths and Weaknesses Comparison
This table compares the Strengths and Weaknesses of Amphenol Corporation and Trimble Inc.:
Amphenol Corporation Strengths
- High net margin at 18.49%
- Strong ROE of 31.84%
- ROIC well above WACC at 15.12%
- Robust current and quick ratios
- Significant global sales outside US and China
- Diverse product segments with strong Communications Solutions revenue
Trimble Inc. Strengths
- Positive net margin at 11.82%
- Favorable debt-to-equity and debt-to-assets ratios
- Good interest coverage ratio of 8.19
- High fixed asset turnover at 19.62
- Geographically diversified with strong North America and Europe sales
- Balanced revenue between product and service segments
Amphenol Corporation Weaknesses
- Elevated PE ratio at 38.55 and PB at 12.27 indicate possible overvaluation
- High debt-to-equity ratio of 1.16
- Dividend yield low at 0.49%
- Moderate asset turnover at 0.64
- Debt to assets at 42.78% is neutral but notable
Trimble Inc. Weaknesses
- Low ROE at 7.27% below industry norms
- WACC higher than ROIC at 10.51%
- PE and PB ratios unfavorable at 43.87 and 3.19
- Current and quick ratios near 1 indicating weaker liquidity
- Zero dividend yield
- Asset turnover low at 0.39
Amphenol shows strong profitability and liquidity but carries high valuation and leverage risks. Trimble has healthier leverage and asset efficiency but weaker profitability and liquidity metrics. These contrasts highlight different strategic and operational focuses.
The Moat Duel: Analyzing Competitive Defensibility
A structural moat is the only defense that protects long-term profits from competitive erosion in dynamic markets:
Amphenol Corporation: Durable Cost and Intangible Asset Moat
I see Amphenol’s moat rooted in its cost advantage and proprietary connector technologies. This manifests in a very favorable ROIC 6.3% above WACC and stable 18.5% net margins. New product lines in harsh environment connectors promise deeper market penetration in 2026.
Trimble Inc.: Innovation-Driven Network Effects Under Pressure
Trimble leverages software-driven network effects in geospatial and construction tech, but suffers declining ROIC and shrinking margins. Its competitive edge is less stable than Amphenol’s. Expansion into autonomous vehicle guidance could revive its shrinking moat.
Value Creation vs. Innovation Struggles: Moat Strength Comparison
Amphenol holds a wider, more sustainable moat with growing profitability and value creation. Trimble’s declining ROIC signals a shrinking moat, leaving it more vulnerable to market share erosion. Amphenol is better positioned to defend its turf in 2026.
Which stock offers better returns?
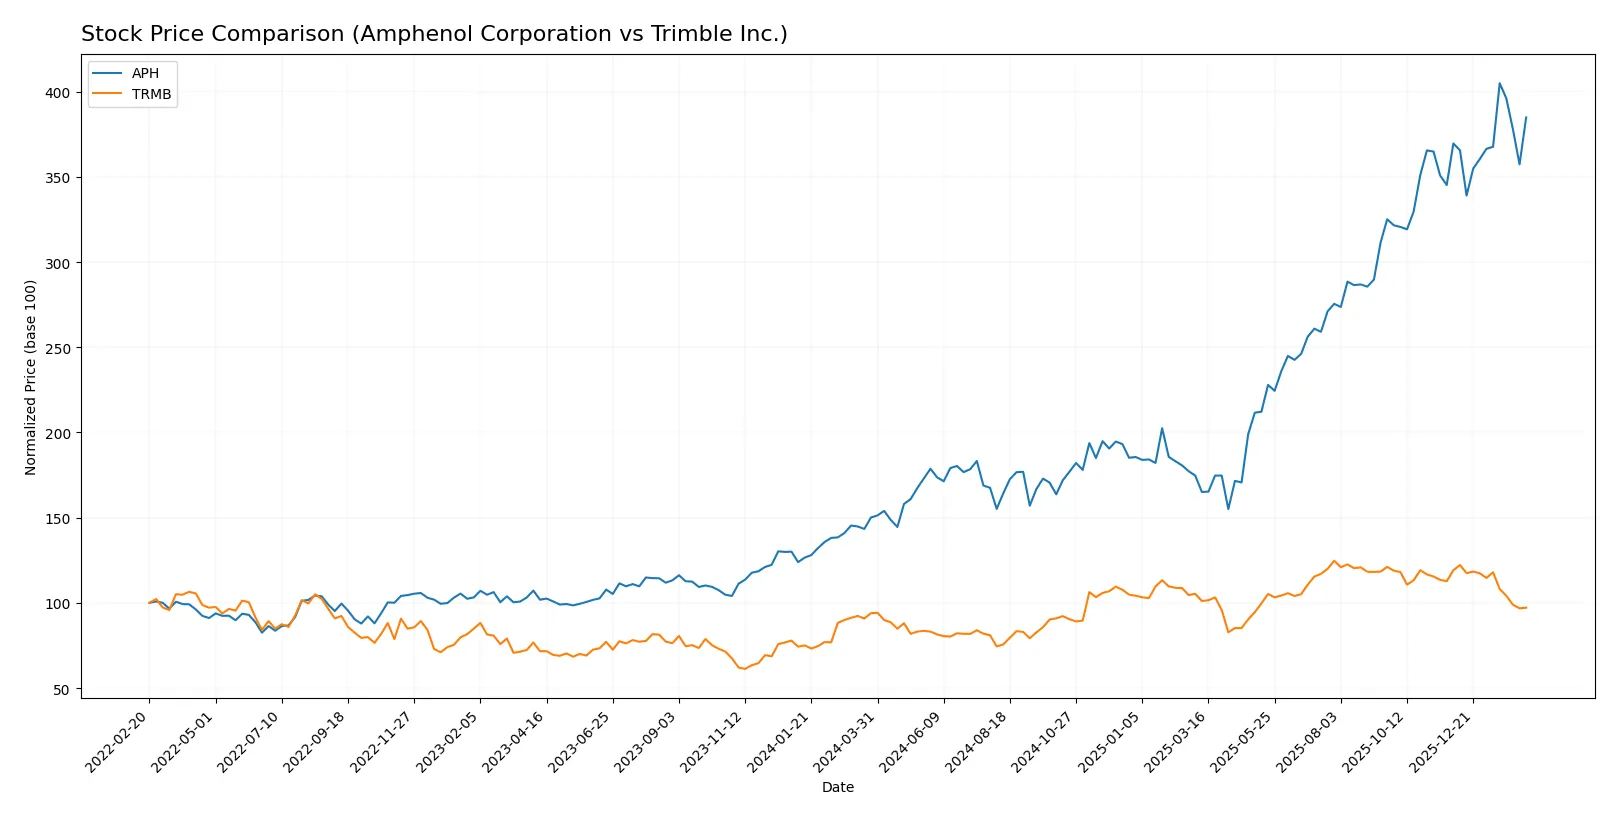
Over the past year, Amphenol Corporation surged sharply with accelerating gains, while Trimble Inc. showed modest growth followed by recent weakness.
Trend Comparison
Amphenol’s stock rose 156.46% over the past 12 months, reflecting a strong bullish trend with accelerating momentum and a wide price range between 55.09 and 154.39.
Trimble’s share price increased 3.43% over the same period, indicating a mild bullish trend but with decelerating gains and a recent 18.45% drop signaling short-term weakness.
Amphenol outperformed Trimble significantly, delivering the highest market returns and stronger upward momentum throughout the year.
Target Prices
Analysts present a clear upward target consensus for both Amphenol Corporation and Trimble Inc.
| Company | Target Low | Target High | Consensus |
|---|---|---|---|
| Amphenol Corporation | 139 | 210 | 174.13 |
| Trimble Inc. | 86 | 101 | 95 |
The consensus target for Amphenol at 174.13 suggests upside potential from the current 146.72 stock price. Trimble’s target consensus of 95 also indicates significant room for appreciation above its 66.40 price.

Don’t Let Luck Decide Your Entry Point
Optimize your entry points with our advanced ProRealTime indicators. You’ll get efficient buy signals with precise price targets for maximum performance. Start outperforming now!
How do institutions grade them?
The following section compares recent institutional grades for Amphenol Corporation and Trimble Inc.:
Amphenol Corporation Grades
Here are the latest grades assigned by notable financial institutions for Amphenol Corporation:
| Grading Company | Action | New Grade | Date |
|---|---|---|---|
| Citigroup | Maintain | Buy | 2026-01-29 |
| Barclays | Maintain | Overweight | 2026-01-29 |
| JP Morgan | Maintain | Overweight | 2026-01-27 |
| UBS | Maintain | Buy | 2026-01-14 |
| Citigroup | Maintain | Buy | 2026-01-12 |
| Barclays | Upgrade | Overweight | 2026-01-12 |
| Truist Securities | Maintain | Buy | 2025-12-19 |
| Barclays | Maintain | Equal Weight | 2025-11-13 |
| Truist Securities | Maintain | Buy | 2025-10-23 |
| Citigroup | Maintain | Buy | 2025-10-23 |
Trimble Inc. Grades
The table below shows recent grades from major analysts for Trimble Inc.:
| Grading Company | Action | New Grade | Date |
|---|---|---|---|
| Wells Fargo | Maintain | Overweight | 2026-02-12 |
| Barclays | Maintain | Overweight | 2026-01-12 |
| Keybanc | Upgrade | Overweight | 2025-12-16 |
| Piper Sandler | Maintain | Overweight | 2025-11-07 |
| JP Morgan | Maintain | Overweight | 2025-09-19 |
| Raymond James | Maintain | Outperform | 2025-08-07 |
| JP Morgan | Maintain | Overweight | 2025-08-07 |
| Oppenheimer | Maintain | Outperform | 2025-08-07 |
| Oppenheimer | Maintain | Outperform | 2025-07-17 |
| JP Morgan | Maintain | Overweight | 2025-07-10 |
Which company has the best grades?
Trimble Inc. consistently receives “Overweight” and “Outperform” ratings, indicating stronger analyst enthusiasm. Amphenol’s grades cluster around “Buy” and “Overweight” but with some “Equal Weight” calls. Investors may interpret Trimble’s higher grades as greater confidence in growth potential.
Risks specific to each company
The following categories identify the critical pressure points and systemic threats facing both firms in the 2026 market environment:
1. Market & Competition
Amphenol Corporation
- Operates in diversified hardware connector markets with strong positions in harsh environment and communications segments.
Trimble Inc.
- Focuses on niche technology solutions for field and mobile workers, facing intense competition in software and precision agriculture.
2. Capital Structure & Debt
Amphenol Corporation
- Higher debt-to-equity ratio at 1.16 signals leverage risk despite solid interest coverage of 16.23x.
Trimble Inc.
- Lower leverage with debt-to-equity at 0.24 offers more financial flexibility and less risk.
3. Stock Volatility
Amphenol Corporation
- Beta of 1.21 indicates moderate market sensitivity, aligned with sector averages.
Trimble Inc.
- Higher beta of 1.58 implies greater stock price volatility and risk exposure.
4. Regulatory & Legal
Amphenol Corporation
- Faces regulatory scrutiny typical for hardware and communications sectors, including export controls and compliance.
Trimble Inc.
- Encounters complex software and data privacy regulations, adding legal uncertainty and potential compliance costs.
5. Supply Chain & Operations
Amphenol Corporation
- Global manufacturing footprint exposes it to raw material price swings and logistic disruptions.
Trimble Inc.
- Relies heavily on technology supply chains vulnerable to semiconductor shortages and software integration challenges.
6. ESG & Climate Transition
Amphenol Corporation
- Increasing pressure to reduce carbon footprint in manufacturing and product lifecycle; moderate ESG scores.
Trimble Inc.
- ESG risks tied to data privacy, sustainable agriculture tech adoption, and climate resilience of geospatial services.
7. Geopolitical Exposure
Amphenol Corporation
- Significant sales in China and international markets expose it to geopolitical trade tensions and tariffs.
Trimble Inc.
- Less global manufacturing but some exposure to supply chain disruptions from geopolitical conflicts.
Which company shows a better risk-adjusted profile?
Amphenol’s greatest risk stems from its leveraged capital structure, which could magnify market downturns despite strong operational metrics. Trimble faces elevated market volatility and regulatory uncertainties but benefits from a conservative debt profile. Amphenol’s Altman Z-score of 6.66 confirms robust financial health, while Trimble’s 3.92 still indicates safety but with less cushion. Overall, Amphenol shows a better risk-adjusted profile supported by a stronger Piotroski score and more favorable returns, though investors must monitor its leverage closely.
Final Verdict: Which stock to choose?
Amphenol Corporation’s superpower lies in its robust value creation and consistent profitability. It commands a very favorable moat with growing ROIC well above its cost of capital. Its point of vigilance is the elevated debt-to-equity ratio, which might pressure financial flexibility. This stock suits an Aggressive Growth portfolio seeking sustainable competitive advantage.
Trimble Inc. leverages a strategic moat rooted in specialized technology and recurring revenue streams, offering more conservative financial risk with low leverage. However, its declining ROIC and weaker profitability signal caution. Trimble fits a GARP profile, appealing to investors prioritizing growth potential with moderate safety nets.
If you prioritize long-term value creation and strong profitability, Amphenol outshines due to its expanding moat and superior returns. However, if you seek a steadier balance sheet and technology-driven growth, Trimble offers better stability despite its current profitability challenges. Each stock aligns with distinct investor risk appetites and strategic goals.
Disclaimer: Investment carries a risk of loss of initial capital. The past performance is not a reliable indicator of future results. Be sure to understand risks before making an investment decision.
Go Further
I encourage you to read the complete analyses of Amphenol Corporation and Trimble Inc. to enhance your investment decisions: