Home > Comparison > Technology > APH vs TDY
The strategic rivalry between Amphenol Corporation and Teledyne Technologies defines the current trajectory of the technology hardware sector. Amphenol operates as a capital-intensive global connector and interconnect systems manufacturer, while Teledyne focuses on high-tech instrumentation and aerospace electronics. This head-to-head contrasts scale-driven industrial breadth with niche technological innovation. This analysis will clarify which corporate model offers superior risk-adjusted returns for a diversified portfolio in 2026.
Table of contents
Companies Overview
Amphenol and Teledyne stand as major players in the hardware and equipment sector, shaping global technology markets.
Amphenol Corporation: Connector Industry Powerhouse
Amphenol dominates the electrical and electronic connector market worldwide. It generates revenue through harsh environment solutions, communications, and sensor systems. In 2026, Amphenol emphasizes expanding fiber optic and high-speed interconnect products, targeting automotive, aerospace, and broadband communication sectors.
Teledyne Technologies Incorporated: Advanced Instrumentation Leader
Teledyne excels in industrial and aerospace instrumentation technologies. Its core revenue comes from digital imaging, aerospace defense electronics, and engineered systems. The strategic focus centers on enhancing sensor networks, thermal imaging, and electrochemical energy systems for military and industrial applications.
Strategic Collision: Similarities & Divergences
Both companies innovate in hardware and connectivity but differ sharply in approach. Amphenol pursues a broad, product-diverse model serving multiple industries. Teledyne focuses on high-tech instrumentation and defense systems. They compete primarily in aerospace and industrial markets. Amphenol offers scale and product breadth, while Teledyne delivers specialized, high-margin technologies. Their investment profiles reflect these distinct strategic bets.
Income Statement Comparison
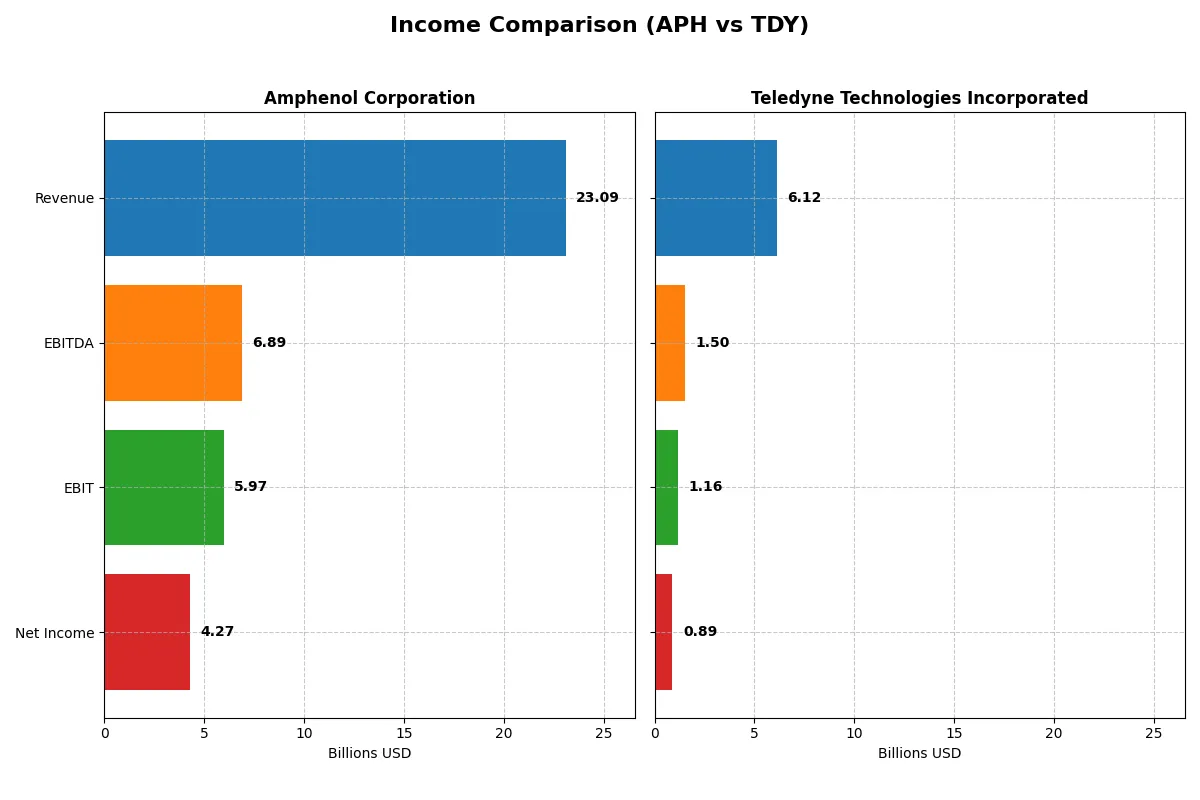
This data dissects the core profitability and scalability of both corporate engines to reveal who dominates the bottom line:
| Metric | Amphenol Corporation (APH) | Teledyne Technologies Incorporated (TDY) |
|---|---|---|
| Revenue | 23B | 6.1B |
| Cost of Revenue | 14.6B | 3.7B |
| Operating Expenses | 2.5B | 1.2B |
| Gross Profit | 8.5B | 2.4B |
| EBITDA | 6.9B | 1.5B |
| EBIT | 6B | 1.2B |
| Interest Expense | 368M | 60M |
| Net Income | 4.3B | 895M |
| EPS | 3.51 | 18.88 |
| Fiscal Year | 2025 | 2025 |
Income Statement Analysis: The Bottom-Line Duel
This income statement comparison reveals the true efficiency and growth momentum of two powerful industrial technology companies.
Amphenol Corporation Analysis
Amphenol’s revenue surged from 10.9B in 2021 to 23.1B in 2025, more than doubling over five years. Net income followed this robust trend, reaching 4.3B in 2025. Its gross margin of 36.9% and net margin of 18.5% demonstrate strong profitability. The company accelerated growth in 2025, posting a 52% revenue jump and 16% net margin expansion, signaling operational efficiency gains.
Teledyne Technologies Incorporated Analysis
Teledyne grew revenue steadily from 4.6B in 2021 to 6.1B in 2025, a 33% increase over five years. Net income doubled to 895M, but with a lower net margin of 14.6%. Gross margin remains higher at 39.2%, though it declined slightly last year. Teledyne’s 2025 results show moderate revenue growth of 7.9% and a modest 1.3% net margin rise, indicating steady but less dynamic momentum.
Growth Engine vs. Margin Strength
Amphenol outpaces Teledyne in revenue and net income growth, delivering superior margin expansion alongside a 52% revenue spike last year. Teledyne offers steadier margin levels but slower top-line growth. For investors, Amphenol’s profile suits those seeking rapid scale and improving efficiency, while Teledyne appeals to those favoring margin stability with moderate growth.
Financial Ratios Comparison
These vital ratios act as a diagnostic tool to expose the underlying fiscal health, valuation premiums, and capital efficiency of the companies compared below:
| Ratios | Amphenol Corporation (APH) | Teledyne Technologies Incorporated (TDY) |
|---|---|---|
| ROE | 24.8% | 8.5% |
| ROIC | 14.9% | 6.8% |
| P/E | 34.5 | 27.3 |
| P/B | 8.54 | 2.33 |
| Current Ratio | 2.37 | 1.64 |
| Quick Ratio | 1.75 | 1.08 |
| D/E | 0.74 | 0.24 |
| Debt-to-Assets | 34.0% | 16.2% |
| Interest Coverage | 15.1 | 19.3 |
| Asset Turnover | 0.71 | 0.40 |
| Fixed Asset Turnover | 7.26 | 7.29 |
| Payout Ratio | 24.6% | 0% |
| Dividend Yield | 0.71% | 0% |
| Fiscal Year | 2024 | 2025 |
Efficiency & Valuation Duel: The Vital Signs
Financial ratios act as a company’s DNA, unveiling hidden risks and operational strengths that shape investment decisions.
Amphenol Corporation
Amphenol shows robust profitability with a 24.75% ROE and a strong 15.92% net margin, reflecting operational efficiency. Its valuation appears stretched, with a high P/E of 34.49 and P/B of 8.54. The company delivers modest shareholder returns via a 0.71% dividend yield, balancing this with steady R&D investment for future growth.
Teledyne Technologies Incorporated
Teledyne posts a weaker 8.51% ROE but maintains a solid 14.63% net margin. Its valuation is more reasonable with a P/E of 27.35 and a conservative P/B of 2.33. The firm pays no dividends, focusing on reinvestment in R&D (5.16% of revenue) to fuel expansion, despite a lower asset turnover and moderate leverage.
Premium Valuation vs. Operational Safety
Amphenol commands a premium valuation justified by high returns and solid margins, while Teledyne offers a more conservative price with lower profitability. Amphenol suits investors seeking operational strength and income; Teledyne fits those prioritizing growth reinvestment and a more moderate risk profile.
Which one offers the Superior Shareholder Reward?
I compare Amphenol Corporation (APH) and Teledyne Technologies Incorporated (TDY) on dividends, payout ratios, and buybacks for shareholder reward. APH yields ~0.85% with a 26% payout ratio, well-covered by free cash flow (~2.2x dividend+capex). TDY pays no dividends but reinvests heavily with a buyback focus. APH modestly returns cash via dividends and likely buybacks, supporting steady income and capital preservation. TDY’s zero dividend and strong free cash flow (23.7/share in 2024) fuel growth and buybacks, boosting total return. Historically, tech-industrial firms like TDY prefer reinvestment and buybacks over dividends for compounding growth. I find TDY’s distribution model more sustainable and attractive for total shareholder return in 2026.
Comparative Score Analysis: The Strategic Profile
The radar chart reveals the fundamental DNA and trade-offs of both firms, showing how they balance profit, risk, and valuation metrics:
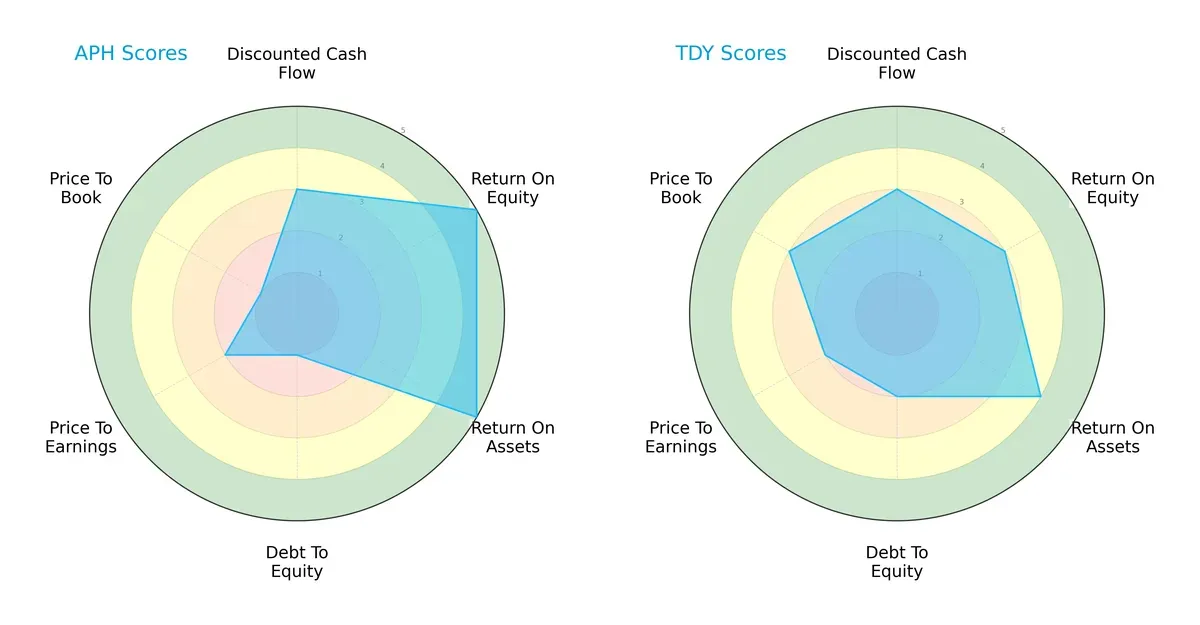
Amphenol dominates in profitability with very favorable ROE (5) and ROA (5) scores, but suffers from a weak balance sheet indicated by a very unfavorable debt-to-equity score (1). Teledyne shows a more balanced profile with moderate profitability (ROE 3, ROA 4) and a stronger financial leverage score (2). Amphenol relies heavily on operational efficiency, while Teledyne presents steadier financial risk management and valuation metrics.
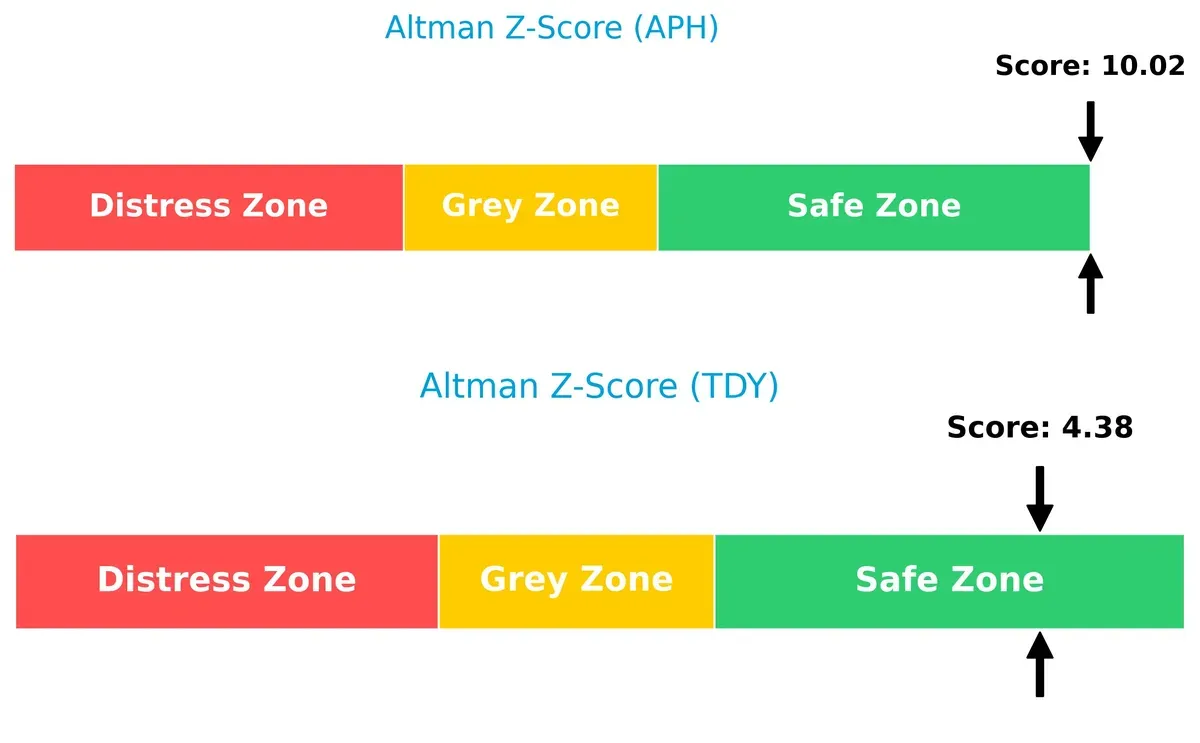
Bankruptcy Risk: Solvency Showdown
Amphenol’s Altman Z-Score of 10.02 vastly outperforms Teledyne’s 4.38, both safely above distress thresholds, signaling stronger long-term solvency for Amphenol in this cycle:
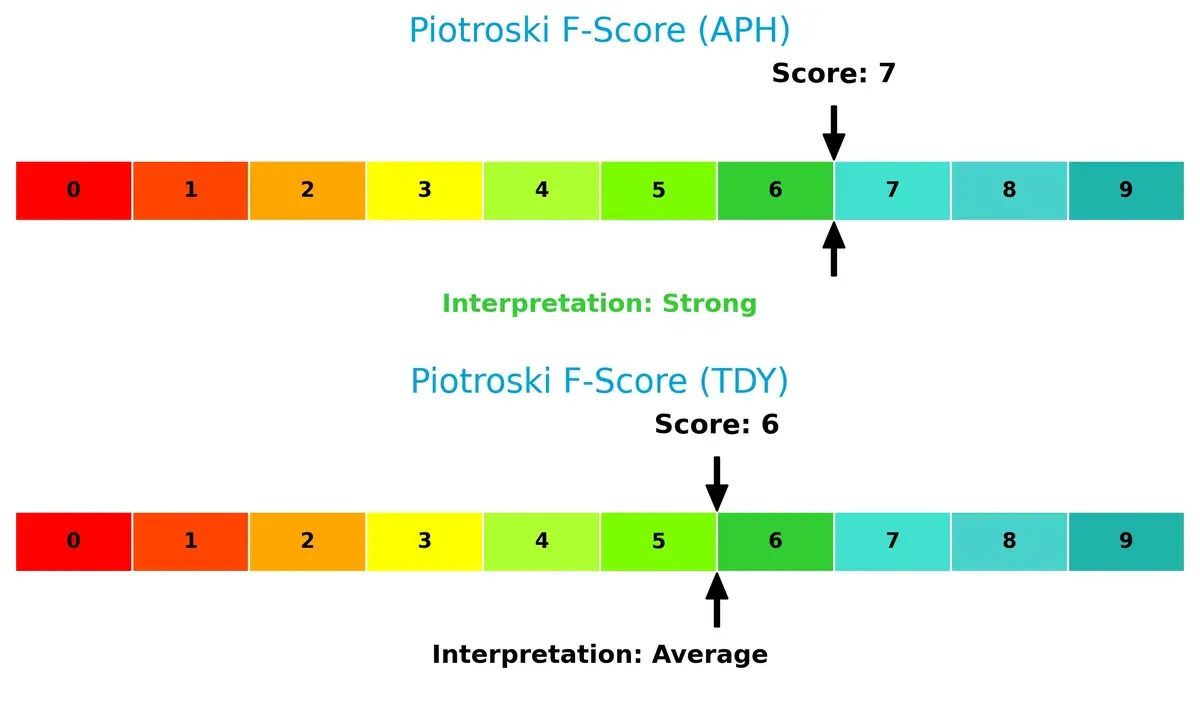
Financial Health: Quality of Operations
Amphenol’s Piotroski F-Score of 7 indicates strong financial health, surpassing Teledyne’s average score of 6, suggesting fewer red flags in Amphenol’s internal operations and cash flow quality:
How are the two companies positioned?
This section dissects the operational DNA of Amphenol and Teledyne by comparing their revenue distribution and internal dynamics. The goal is to confront their economic moats and identify which model offers the most resilient, sustainable advantage today.
Revenue Segmentation: The Strategic Mix
This visual comparison dissects how Amphenol Corporation and Teledyne Technologies diversify their income streams and where their primary sector bets lie:
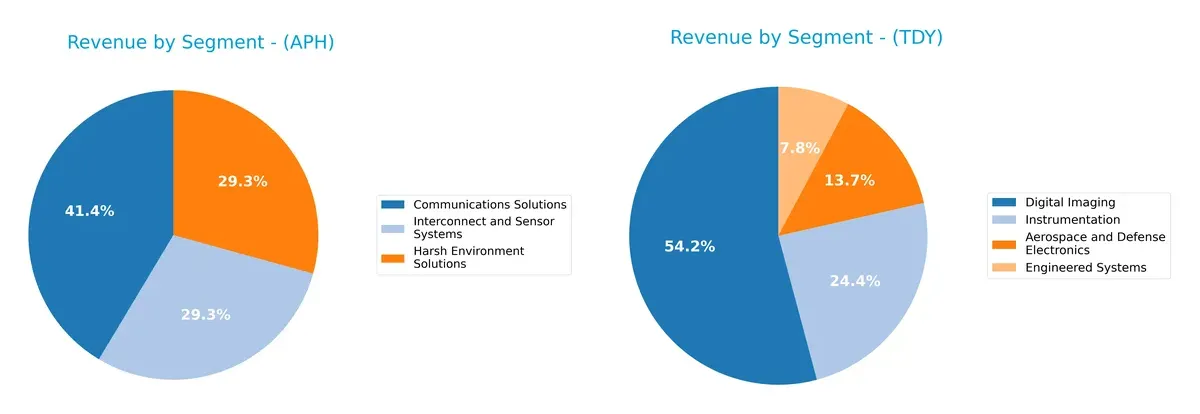
Amphenol’s 2024 revenue pivots around three nearly equal segments: Communications Solutions ($6.38B), Harsh Environment Solutions ($4.51B), and Interconnect and Sensor Systems ($4.51B). This balance signals a diversified portfolio reducing concentration risk. Teledyne leans heavily on Digital Imaging ($3.07B), which dwarfs its Aerospace and Defense Electronics ($777M), Instrumentation ($1.38B), and Engineered Systems ($440M). Teledyne’s dependency on Digital Imaging anchors its strategy but raises exposure to sector-specific volatility.
Strengths and Weaknesses Comparison
This table compares the Strengths and Weaknesses of Amphenol Corporation (APH) and Teledyne Technologies Incorporated (TDY):
APH Strengths
- Diversified revenues across three strong segments
- Favorable net margin of 15.92%
- High ROE at 24.75% indicating efficient capital use
- Strong liquidity ratios with current ratio 2.37
- Solid interest coverage at 16.23
- Significant global presence with large foreign sales
TDY Strengths
- Balanced segment revenue with strong Digital Imaging
- Favorable net margin of 14.63%
- Strong interest coverage at 19.47
- Low debt-to-equity at 0.24 indicates conservative leverage
- Global presence including Asia, Europe, and US
- Favorable liquidity ratios with current ratio 1.64
APH Weaknesses
- High P/E of 34.49 may indicate overvaluation
- Elevated P/B at 8.54 suggests expensive stock price
- Dividend yield low at 0.71%
- Moderate leverage with debt-to-assets 33.96%
- Asset turnover neutral at 0.71 limits efficiency gains
TDY Weaknesses
- Below-par ROE at 8.51% signals weaker profitability
- ROIC at 6.78% close to WACC limits value creation
- Higher unfavorable ratios at 28.57%
- Asset turnover low at 0.4 reduces operational efficiency
- No dividend yield, limiting income appeal
Both companies show strong profitability and liquidity but face valuation and operational efficiency challenges. APH’s higher ROE and diversified product base contrast with TDY’s conservative leverage and strong interest coverage. Each must address specific weaknesses to sustain competitive advantages.
The Moat Duel: Analyzing Competitive Defensibility
A structural moat is the sole barrier protecting long-term profits from relentless competitive erosion. Let’s dissect the moats of these two firms:
Amphenol Corporation: Durable Cost Advantage with Global Scale
Amphenol’s primary moat stems from its cost advantage driven by global manufacturing and a diversified product portfolio. This moat shows in its strong ROIC, 5.9% above WACC, and stable 25.8% EBIT margin. Expanding into harsh environment and fiber optics deepens this moat in 2026.
Teledyne Technologies: Innovation-Driven Niche Expertise
Teledyne’s moat relies on intangible assets and specialized tech in aerospace and defense segments, contrasting Amphenol’s scale. Despite shedding value (ROIC below WACC), its 68% ROIC growth trend and steady margin expansion signal rising competitive strength. New imaging and sensor markets offer growth avenues in 2026.
Scale Efficiency vs. Specialized Innovation: The Moat Face-Off
Amphenol boasts a wider, more durable moat, consistently creating value through cost leadership and scale. Teledyne’s moat is narrower but deepening via innovation. Overall, Amphenol is better positioned to defend market share amid competitive pressures.
Which stock offers better returns?
Over the past year, both Amphenol Corporation and Teledyne Technologies show strong upward price movements, with notable acceleration phases and differing volatility profiles.
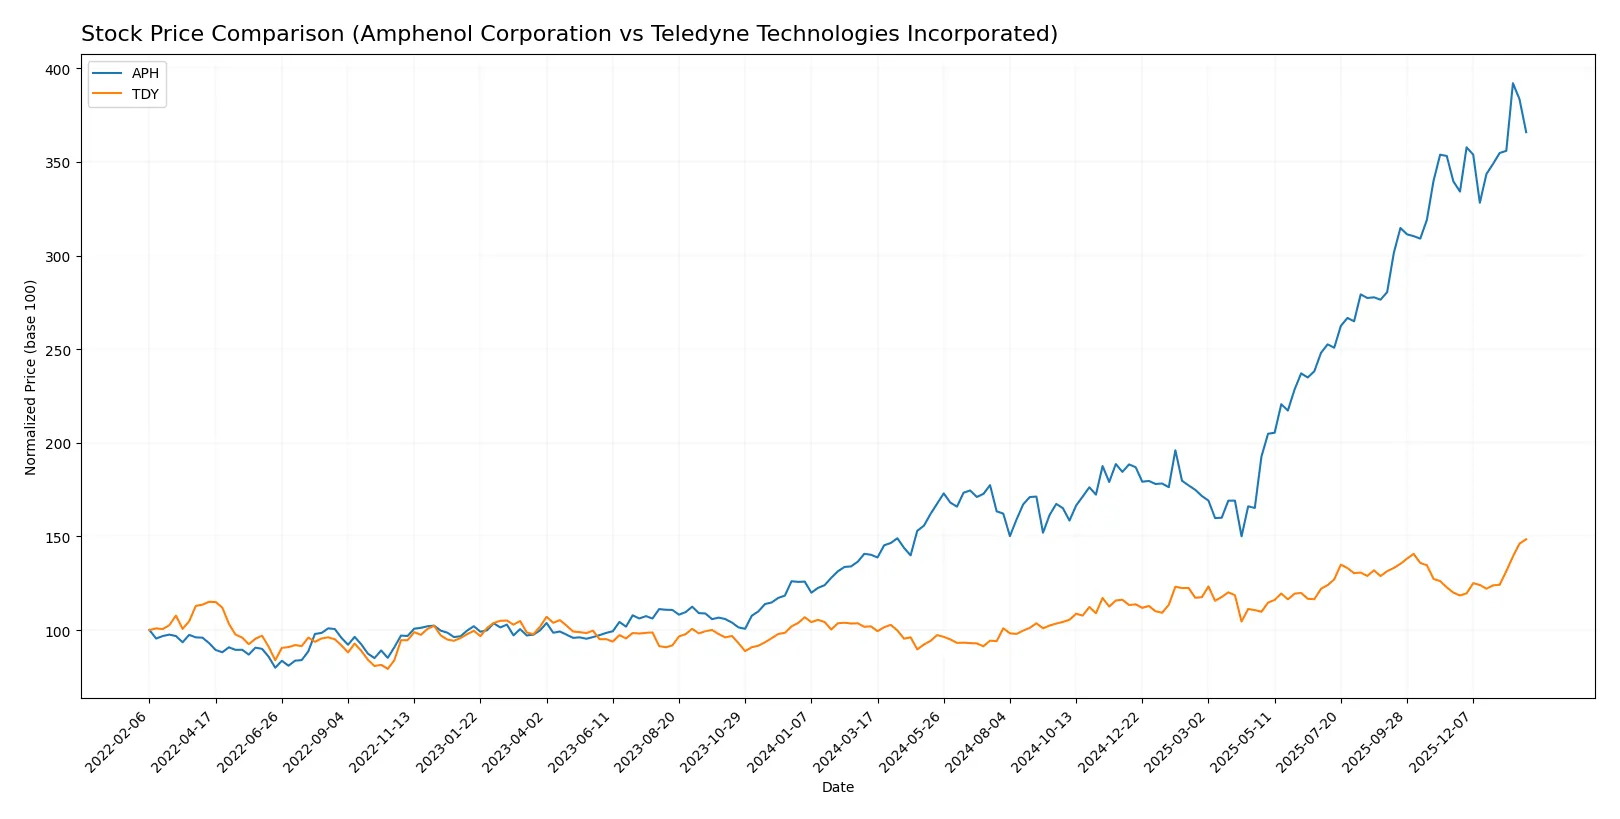
Trend Comparison
Amphenol’s stock surged 161% over the past 12 months, marking a clear bullish trend with accelerating momentum and moderate volatility (28.51 std deviation). Its highest price reached 154.39, with a recent 7.73% gain despite slight seller dominance in volume.
Teledyne’s stock gained 45.6% over the same period, also showing a bullish trend with accelerating price growth but higher volatility (58.2 std deviation). It peaked at 620.3 and exhibited a robust recent 23.76% increase supported by strong buyer dominance.
Comparing these trends, Amphenol delivered the highest market performance with a substantially larger total return, despite Teledyne’s stronger recent price acceleration and buyer volume dominance.
Target Prices
Analysts show a bullish consensus for both Amphenol Corporation and Teledyne Technologies Incorporated with solid upside potential.
| Company | Target Low | Target High | Consensus |
|---|---|---|---|
| Amphenol Corporation | 139 | 210 | 174.13 |
| Teledyne Technologies Incorporated | 599 | 720 | 638.5 |
The consensus targets for Amphenol and Teledyne exceed their current prices by 21% and 3% respectively, indicating moderate investor optimism.

Don’t Let Luck Decide Your Entry Point
Optimize your entry points with our advanced ProRealTime indicators. You’ll get efficient buy signals with precise price targets for maximum performance. Start outperforming now!
How do institutions grade them?
Amphenol Corporation Grades
The following table summarizes recent grades from reputable institutions for Amphenol Corporation.
| Grading Company | Action | New Grade | Date |
|---|---|---|---|
| Citigroup | Maintain | Buy | 2026-01-29 |
| Barclays | Maintain | Overweight | 2026-01-29 |
| JP Morgan | Maintain | Overweight | 2026-01-27 |
| UBS | Maintain | Buy | 2026-01-14 |
| Citigroup | Maintain | Buy | 2026-01-12 |
| Barclays | Upgrade | Overweight | 2026-01-12 |
| Truist Securities | Maintain | Buy | 2025-12-19 |
| Barclays | Maintain | Equal Weight | 2025-11-13 |
| Citigroup | Maintain | Buy | 2025-10-23 |
| Truist Securities | Maintain | Buy | 2025-10-23 |
Teledyne Technologies Incorporated Grades
The following table summarizes recent grades from reputable institutions for Teledyne Technologies Incorporated.
| Grading Company | Action | New Grade | Date |
|---|---|---|---|
| Needham | Maintain | Buy | 2026-01-22 |
| Barclays | Maintain | Equal Weight | 2026-01-22 |
| Stifel | Maintain | Buy | 2026-01-22 |
| Citigroup | Maintain | Neutral | 2026-01-13 |
| Barclays | Maintain | Equal Weight | 2026-01-12 |
| Barclays | Maintain | Equal Weight | 2025-10-23 |
| Needham | Maintain | Buy | 2025-10-23 |
| Stifel | Maintain | Buy | 2025-10-23 |
| Morgan Stanley | Maintain | Equal Weight | 2025-10-15 |
| UBS | Maintain | Buy | 2025-07-24 |
Which company has the best grades?
Amphenol Corporation consistently receives Buy and Overweight ratings, often with upgrades. Teledyne holds a mix of Buy and Equal Weight, with some Neutral ratings. Amphenol’s stronger grades may suggest higher analyst confidence, potentially influencing investor sentiment positively.
Risks specific to each company
The following categories identify the critical pressure points and systemic threats facing both firms in the 2026 market environment:
1. Market & Competition
Amphenol Corporation (APH)
- Faces intense competition in connectors and sensors, with pressure from global suppliers and technology shifts.
Teledyne Technologies Incorporated (TDY)
- Competes in niche instrumentation and aerospace markets, but slower asset turnover indicates operational challenges.
2. Capital Structure & Debt
Amphenol Corporation (APH)
- Moderate debt-to-equity (0.74) poses manageable financial risk; interest coverage (16.23x) is strong.
Teledyne Technologies Incorporated (TDY)
- Low debt-to-equity (0.24) and high interest coverage (19.47x) signal conservative leverage and financial stability.
3. Stock Volatility
Amphenol Corporation (APH)
- Beta at 1.214 shows above-market volatility; wider trading range (56.45–167.04) increases risk.
Teledyne Technologies Incorporated (TDY)
- Beta near market average (1.027) with narrower price range (419–630.76) suggests lower volatility.
4. Regulatory & Legal
Amphenol Corporation (APH)
- Operates globally with exposure to varied regulations in defense, aerospace, and communications sectors.
Teledyne Technologies Incorporated (TDY)
- Faces complex regulations in defense and environmental instrumentation with potential compliance costs.
5. Supply Chain & Operations
Amphenol Corporation (APH)
- Large global footprint and complex product lines increase supply chain risks, including geopolitical disruptions.
Teledyne Technologies Incorporated (TDY)
- Smaller scale but diverse product segments pose operational integration challenges and supply chain dependencies.
6. ESG & Climate Transition
Amphenol Corporation (APH)
- Increasing demand for sustainable products pressures innovation; ESG compliance impacts operational costs.
Teledyne Technologies Incorporated (TDY)
- Focus on aerospace and defense may face stricter emissions regulations and ESG scrutiny.
7. Geopolitical Exposure
Amphenol Corporation (APH)
- Significant international sales expose APH to trade tensions and tariffs, especially US-China relations.
Teledyne Technologies Incorporated (TDY)
- Exposure concentrated in US, Canada, and Europe, limiting but not eliminating geopolitical risks.
Which company shows a better risk-adjusted profile?
Amphenol’s main risk is its higher stock volatility and complex global supply chain. Teledyne struggles with lower operational efficiency but benefits from stronger balance sheet metrics and lower leverage. Both score “slightly favorable” on financial ratios, yet Teledyne’s conservative debt profile and safer stock volatility grant it a better risk-adjusted stance in 2026. Notably, Amphenol’s steep valuation multiples and wide trading range increase investor risk, while Teledyne’s stable cash flow and lower beta provide a more measured risk exposure.
Final Verdict: Which stock to choose?
Amphenol Corporation’s superpower lies in its durable competitive advantage, reflected in a steadily growing ROIC well above its cost of capital. It operates as a cash-generating machine with robust profitability and solid balance sheet liquidity. A point of vigilance remains its elevated valuation multiples, which could temper near-term upside. It suits portfolios targeting aggressive growth with a tolerance for premium pricing.
Teledyne Technologies benefits from a strategic moat rooted in niche technological expertise and recurring revenue streams. Its capital structure is notably more conservative, offering comparatively better financial safety than Amphenol. However, its lower return metrics suggest slower value creation. This makes it appealing for investors seeking GARP—growth at a reasonable price—with a preference for stability over rapid expansion.
If you prioritize durable value creation and can absorb valuation risk, Amphenol outshines as the compelling choice due to its strong profitability and expanding moat. However, if you seek better financial safety combined with steady growth potential, Teledyne offers better stability and a more conservative risk profile. Each scenario fits distinct investor profiles balancing growth ambition against risk tolerance.
Disclaimer: Investment carries a risk of loss of initial capital. The past performance is not a reliable indicator of future results. Be sure to understand risks before making an investment decision.
Go Further
I encourage you to read the complete analyses of Amphenol Corporation and Teledyne Technologies Incorporated to enhance your investment decisions: