Home > Comparison > Technology > APH vs TEL
The strategic rivalry between Amphenol Corporation and TE Connectivity Ltd. shapes the trajectory of the global technology hardware sector. Amphenol operates as a broad-based manufacturer of connectors and interconnect systems, emphasizing harsh environment and communications solutions. TE Connectivity focuses on specialized connectivity and sensor solutions across transportation, industrial, and communications markets. This analysis will clarify which operational model provides the superior risk-adjusted return for a diversified portfolio navigating evolving industry demands.
Table of contents
Companies Overview
Amphenol Corporation and TE Connectivity Ltd. both hold pivotal roles in the global hardware and connectivity markets.
Amphenol Corporation: Leader in Harsh Environment Connectors
Amphenol dominates the electrical and fiber optic connector market with a diverse product lineup spanning harsh environment solutions, communications, and sensor systems. Its revenue hinges on selling complex interconnect products and value-added assemblies globally. In 2026, it strategically emphasizes expanding automotive and broadband communication segments to capture evolving demand.
TE Connectivity Ltd.: Global Connectivity Innovator
TE Connectivity focuses on connectivity and sensor solutions across transportation, industrial, and communications sectors. It generates revenue by supplying terminals, connectors, sensors, and related components worldwide. The company’s 2026 strategy targets deepening its footprint in automotive and industrial applications, leveraging direct sales and extensive distributor networks.
Strategic Collision: Similarities & Divergences
Both companies share a core competitive arena in advanced connectivity products but differ in scope and approach. Amphenol leans toward a broad, integrated portfolio with value-added customization, while TE Connectivity emphasizes specialized sensor integration and global direct sales. Their market rivalry centers on automotive and industrial sectors, offering distinct risk/reward profiles shaped by scale and regional presence.
Income Statement Comparison
This data dissects the core profitability and scalability of both corporate engines to reveal who dominates the bottom line:

| Metric | Amphenol Corporation (APH) | TE Connectivity Ltd. (TEL) |
|---|---|---|
| Revenue | 23B | 17.1B |
| Cost of Revenue | 14.6B | 11.2B |
| Operating Expenses | 2.55B | 2.7B |
| Gross Profit | 8.5B | 5.9B |
| EBITDA | 6.9B | 4.1B |
| EBIT | 6B | 3.3B |
| Interest Expense | 368M | 77M |
| Net Income | 4.3B | 1.8B |
| EPS | 3.51 | 6.2 |
| Fiscal Year | 2025 | 2025 |
Income Statement Analysis: The Bottom-Line Duel
The following income statement comparison reveals which company delivers superior efficiency and growth through its core earnings engine.
Amphenol Corporation (APH) Analysis
Amphenol’s revenue surged from $10.9B in 2021 to $23.1B in 2025, doubling over five years. Net income climbed sharply, reaching $4.3B in 2025 with a robust net margin of 18.5%. Its gross and EBIT margins remain healthy at 36.9% and 25.8%, respectively, signaling strong cost control and operational leverage. Recent momentum is clear with 52% revenue growth and 85% EBIT growth in the last year alone.
TE Connectivity Ltd. (TEL) Analysis
TE Connectivity’s revenue advanced moderately from $14.9B in 2021 to $17.1B in 2025, a 15% increase over five years. Net income, however, declined to $1.8B in 2025 with a net margin at 10.8%. Gross margin stands at 34.6%, but EBIT margin lags at 19.2%, reflecting tighter cost efficiency. Recent growth slowed, showing only 8% revenue uplift and a concerning 47% net margin contraction over the past year.
Margin Strength vs. Revenue Expansion
Amphenol outperforms TE Connectivity decisively in both margin expansion and bottom-line growth. APH’s superior gross and net margins, combined with rapid earnings growth, highlight a more efficient and scalable business model. For investors prioritizing robust profitability and momentum, Amphenol presents a more compelling income statement profile than TE Connectivity’s modest revenue gains and margin pressures.
Financial Ratios Comparison
These vital ratios act as a diagnostic tool to expose the underlying fiscal health, valuation premiums, and capital efficiency of each company:
| Ratios | Amphenol Corporation (APH) | TE Connectivity Ltd. (TEL) |
|---|---|---|
| ROE | 24.8% | 14.6% |
| ROIC | 14.9% | 8.8% |
| P/E | 34.5 | 35.0 |
| P/B | 8.54 | 5.12 |
| Current Ratio | 2.37 | 1.56 |
| Quick Ratio | 1.75 | 1.03 |
| D/E | 0.74 | 0.52 |
| Debt-to-Assets | 33.96% | 26.12% |
| Interest Coverage | 15.1x | 41.7x |
| Asset Turnover | 0.71 | 0.68 |
| Fixed Asset Turnover | 7.26 | 3.96 |
| Payout Ratio | 24.6% | 43.6% |
| Dividend Yield | 0.71% | 1.25% |
| Fiscal Year | 2024 | 2025 |
Efficiency & Valuation Duel: The Vital Signs
Financial ratios act as a company’s DNA, uncovering hidden risks and revealing operational strengths critical for investment decisions.
Amphenol Corporation
Amphenol delivers strong profitability with a 24.75% ROE and a 15.92% net margin, signaling efficient operations. However, its valuation appears stretched with a high P/E of 34.49 and P/B at 8.54. Shareholders receive a modest 0.71% dividend yield, suggesting limited income focus while the firm likely reinvests in growth and R&D.
TE Connectivity Ltd.
TE Connectivity shows moderate profitability with a 14.64% ROE and a 10.78% net margin, reflecting stable but less efficient earnings. Its valuation is also high, with a P/E of 35.0 and P/B of 5.12. The company offers a 1.25% dividend yield, balancing shareholder returns with reinvestment in innovation and capital expenditures.
Valuation Stretch vs. Operational Efficiency
Amphenol exhibits higher profitability but trades at a premium valuation with lower dividend yield. TE Connectivity offers a more balanced dividend and moderate returns at a similar valuation level. Investors seeking efficiency might prefer Amphenol, while those favoring income and steady reinvestment may lean toward TE Connectivity.
Which one offers the Superior Shareholder Reward?
I see Amphenol (APH) delivers a modest dividend yield near 0.8% with a sustainable payout ratio around 25%. Its free cash flow comfortably covers dividends and capex, supporting steady payouts. Buybacks appear consistent but less aggressive. TE Connectivity (TEL) boasts a higher dividend yield above 1.5% and a similar payout ratio near 24%. TEL’s buyback activity is robust, amplifying total shareholder return. However, TE’s elevated payout ratio and thinner free cash flow coverage signal higher risk. Historically, I’ve observed that TE’s aggressive distributions demand close monitoring during economic slowdowns. Overall, I find APH’s balanced approach more sustainable, but TEL offers a superior total return profile in 2026 for investors willing to accept elevated risk.
Comparative Score Analysis: The Strategic Profile
The radar chart reveals the fundamental DNA and trade-offs of Amphenol Corporation and TE Connectivity Ltd., highlighting their financial strengths and vulnerabilities:
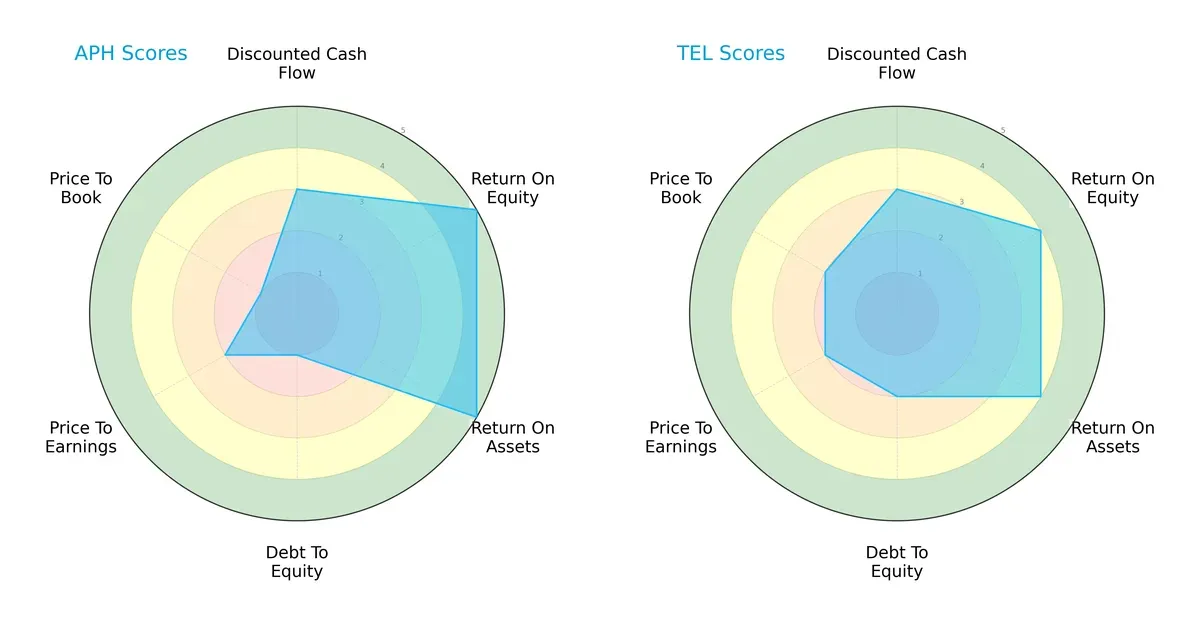
Amphenol leads in profitability with top ROE (5) and ROA (5) scores, signaling efficient use of equity and assets. TE Connectivity shows a more balanced risk profile, holding moderate debt-to-equity (2) and better valuation scores (PE and PB at 2). Amphenol’s heavy leverage (Debt/Equity score 1) and weak price-to-book ratio expose financial risk. TE relies on steadier financial stability rather than a singular profitability edge.
Bankruptcy Risk: Solvency Showdown
The Altman Z-Score gap—10.0 for Amphenol versus 5.3 for TE Connectivity—places both firms safely above distress thresholds but underscores Amphenol’s superior solvency, enhancing its long-term survival odds in this cycle:

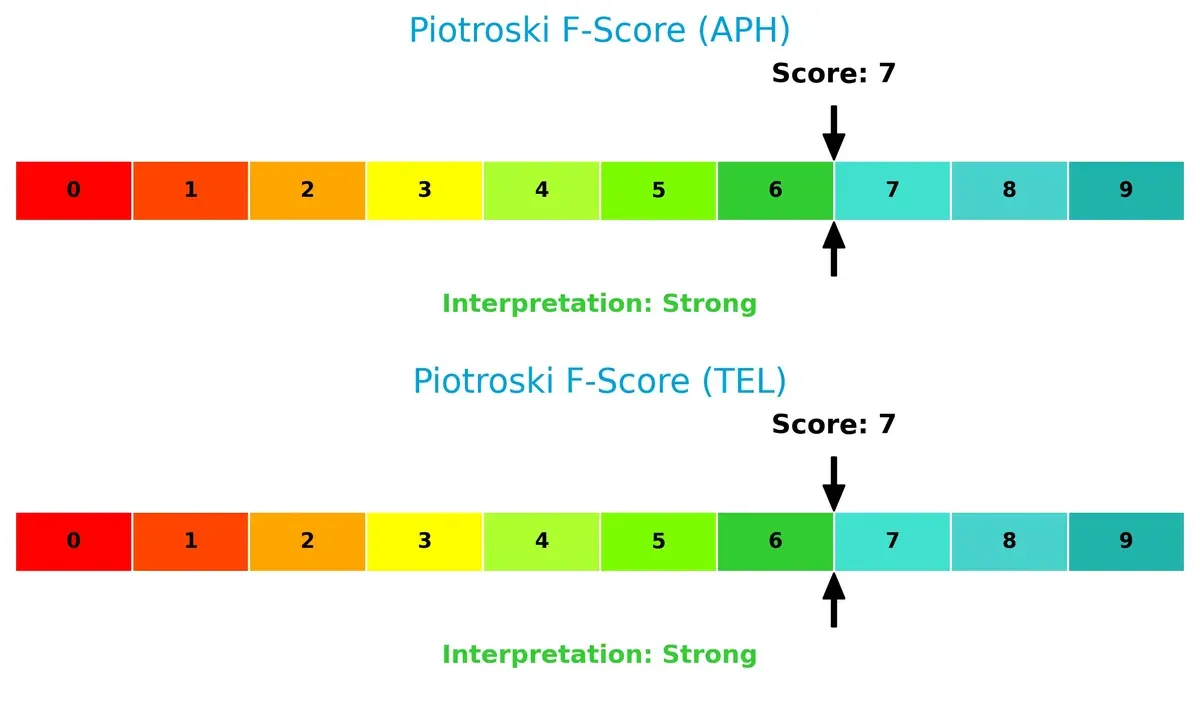
Financial Health: Quality of Operations
Both companies score a strong 7 on the Piotroski F-Score, reflecting robust operational health and quality financial reporting. Neither displays red flags, suggesting solid internal metrics and consistent value generation:
How are the two companies positioned?
This section dissects the operational DNA of Amphenol and TE Connectivity by comparing their revenue distribution and internal dynamics. The goal is to confront their economic moats to identify which model offers the most resilient competitive advantage today.
Revenue Segmentation: The Strategic Mix
This visual comparison dissects how Amphenol Corporation and TE Connectivity diversify income streams and where their primary sector bets lie:

Amphenol anchors revenue in three balanced segments: Communications Solutions at $6.38B, Harsh Environment Solutions at $4.51B, and Interconnect and Sensor Systems at $4.51B. TE Connectivity pivots heavily on Transportation Solutions, which dwarfs its Industrial Solutions ($9.39B vs. $7.87B in 2025). Amphenol’s diversified mix reduces concentration risk, while TE’s dominance in transportation signals infrastructure strength but heightens dependency on that sector’s cycle.
Strengths and Weaknesses Comparison
This table compares the Strengths and Weaknesses of Amphenol Corporation and TE Connectivity Ltd:
Amphenol Corporation Strengths
- Higher net margin at 15.92%
- Strong ROE of 24.75% indicates efficient equity use
- Robust current ratio at 2.37 shows liquidity
- Diverse product segments including Communications and Sensors
- Significant global presence with balanced US and foreign revenues
TE Connectivity Ltd. Strengths
- Lower but favorable net margin at 10.78%
- Very high interest coverage at 42.61, reducing default risk
- Favorable debt-to-assets ratio at 26.12%
- Large Transportation Solutions segment supports market share
- Wide geographic footprint including China and Europe
Amphenol Corporation Weaknesses
- Elevated P/E at 34.49 and high P/B at 8.54 suggest overvaluation risk
- Moderate debt level with D/E at 0.74, neutral but watchful
- Dividend yield low at 0.71%
- Moderate asset turnover at 0.71 could imply less efficient asset use
TE Connectivity Ltd. Weaknesses
- High P/E of 35.0 indicates valuation pressure
- P/B at 5.12 is unfavorable but better than Amphenol
- ROE and ROIC only neutral, implying weaker profitability efficiency
- Lower current and quick ratios (1.56 and 1.03) than Amphenol
Both companies show slightly favorable overall financial health. Amphenol emphasizes profitability and liquidity, while TE Connectivity excels in interest coverage and conservative leverage. Each must address valuation concerns to sustain growth and capital allocation strategy.
The Moat Duel: Analyzing Competitive Defensibility
A structural moat is the only reliable shield protecting long-term profits from relentless competition and market disruption:
Amphenol Corporation: Durable Value Creator via Cost Advantage
Amphenol’s primary moat stems from its cost advantage and scale in harsh environment connectors. This delivers a robust 5.9% ROIC premium over WACC and margin stability. In 2026, expanding fiber optic and sensor segments could further widen its moat.
TE Connectivity Ltd.: Eroding Moat under Margin Pressure
TE Connectivity’s moat relies on its broad product portfolio and industrial scale, contrasting with Amphenol’s sharper cost edge. However, TE’s ROIC has fallen below WACC with a 38% decline trend, signaling value destruction. Potential lies in transportation sensors, but profitability erosion risks persist.
Cost Leadership vs. Diversified Reach: Who Holds the Moat Crown?
Amphenol’s growing ROIC and margin expansion mark a deeper and more durable moat than TE’s weakening returns. I see Amphenol better positioned to defend its market share and sustain profitability amid evolving technology demands.
Which stock offers better returns?
Over the past 12 months, Amphenol Corporation and TE Connectivity Ltd. showed strong rallies with distinct momentum shifts and trading volume dynamics.

Trend Comparison
Amphenol’s stock rose 161% over 12 months, marking a bullish trend with accelerating growth and volatility at 28.51. Its recent 7.7% gain confirms positive momentum.
TE Connectivity gained 58.5% over the year, also bullish but with decelerating trend and higher volatility at 34.24. Recent losses of 6.1% indicate weakening momentum.
Amphenol outperformed TE Connectivity significantly, delivering superior market returns and sustained upward acceleration over the past year.
Target Prices
Analysts present a confident upside potential for both Amphenol Corporation and TE Connectivity Ltd.
| Company | Target Low | Target High | Consensus |
|---|---|---|---|
| Amphenol Corporation | 139 | 210 | 174.13 |
| TE Connectivity Ltd. | 238 | 306 | 270.29 |
The target consensus for Amphenol stands 21% above its current price of 144.08, signaling strong growth expectations. TE Connectivity’s consensus target is 21% higher than its 222.78 market price, reflecting robust analyst confidence.

Don’t Let Luck Decide Your Entry Point
Optimize your entry points with our advanced ProRealTime indicators. You’ll get efficient buy signals with precise price targets for maximum performance. Start outperforming now!
How do institutions grade them?
The following tables summarize recent institutional grades for Amphenol Corporation and TE Connectivity Ltd.:
Amphenol Corporation Grades
This table shows the latest grades from major financial institutions for Amphenol Corporation.
| Grading Company | Action | New Grade | Date |
|---|---|---|---|
| Citigroup | Maintain | Buy | 2026-01-29 |
| Barclays | Maintain | Overweight | 2026-01-29 |
| JP Morgan | Maintain | Overweight | 2026-01-27 |
| UBS | Maintain | Buy | 2026-01-14 |
| Citigroup | Maintain | Buy | 2026-01-12 |
| Barclays | Upgrade | Overweight | 2026-01-12 |
| Truist Securities | Maintain | Buy | 2025-12-19 |
| Barclays | Maintain | Equal Weight | 2025-11-13 |
| Citigroup | Maintain | Buy | 2025-10-23 |
| Truist Securities | Maintain | Buy | 2025-10-23 |
TE Connectivity Ltd. Grades
This table presents recent grades from recognized institutions for TE Connectivity Ltd.
| Grading Company | Action | New Grade | Date |
|---|---|---|---|
| Oppenheimer | Upgrade | Outperform | 2026-01-27 |
| Barclays | Maintain | Overweight | 2026-01-23 |
| Wells Fargo | Maintain | Equal Weight | 2026-01-22 |
| Truist Securities | Maintain | Hold | 2026-01-22 |
| UBS | Maintain | Buy | 2026-01-14 |
| Truist Securities | Maintain | Hold | 2025-12-19 |
| Wells Fargo | Maintain | Equal Weight | 2025-12-09 |
| Barclays | Maintain | Overweight | 2025-11-21 |
| Truist Securities | Maintain | Hold | 2025-11-21 |
| TD Cowen | Maintain | Buy | 2025-11-17 |
Which company has the best grades?
Amphenol Corporation consistently receives Buy and Overweight grades from top banks, showing strong institutional support. TE Connectivity has a wider range, including Hold and Equal Weight, indicating more cautious sentiment. Investors might interpret Amphenol’s grades as a stronger signal of confidence.
Risks specific to each company
The following categories identify the critical pressure points and systemic threats facing both firms in the 2026 market environment:
1. Market & Competition
Amphenol Corporation
- Larger market cap (176B) signals stronger market presence but faces intense competition in harsh environments.
TE Connectivity Ltd.
- Smaller market cap (65B) limits scale but has diverse geographic sales mitigating competitive pressure.
2. Capital Structure & Debt
Amphenol Corporation
- Debt-to-equity ratio at 0.74 signals moderate leverage but rated very unfavorable on debt management.
TE Connectivity Ltd.
- Lower debt-to-equity at 0.52 and favorable debt-to-assets ratio (26%) show stronger balance sheet.
3. Stock Volatility
Amphenol Corporation
- Beta 1.21 indicates slightly lower volatility than TEL but wider price range (56.45-167.04) shows risk.
TE Connectivity Ltd.
- Beta 1.24 suggests marginally higher volatility but tighter price range (116.3-250.67) limits downside.
4. Regulatory & Legal
Amphenol Corporation
- US-based exposure subjects it to stringent domestic regulations and trade policies.
TE Connectivity Ltd.
- Swiss domicile offers regulatory stability but exposes firm to European regulatory shifts and tariffs.
5. Supply Chain & Operations
Amphenol Corporation
- Global manufacturing footprint including China risks supply chain disruptions amid geopolitical tensions.
TE Connectivity Ltd.
- Broad international presence diversifies supply chain but complexity may increase operational risk.
6. ESG & Climate Transition
Amphenol Corporation
- No explicit ESG data; tech sector pressure to improve sustainability may increase compliance costs.
TE Connectivity Ltd.
- European base likely faces higher ESG compliance demands but may benefit from proactive climate initiatives.
7. Geopolitical Exposure
Amphenol Corporation
- Significant US-China exposure heightens risk amid ongoing trade tensions.
TE Connectivity Ltd.
- Geographic diversification reduces risk but European political uncertainties and sanctions pose challenges.
Which company shows a better risk-adjusted profile?
Amphenol’s biggest risk is its elevated leverage, challenging capital structure, and exposure to US-China trade dynamics. TE Connectivity’s key risk lies in its complex global supply chain and European regulatory environment. Despite Amphenol’s stronger profitability metrics, TE Connectivity’s more conservative debt position and geographic diversification provide a better risk-adjusted profile. Recent financial ratios highlight Amphenol’s unfavorable debt-to-equity score, warranting caution amid market volatility.
Final Verdict: Which stock to choose?
Amphenol Corporation’s superpower lies in its durable competitive advantage, demonstrated by a growing ROIC well above its cost of capital. It excels at creating shareholder value with consistent income growth and operational efficiency. Its point of vigilance is a high valuation premium, which might temper near-term upside. Fits best in an Aggressive Growth portfolio.
TE Connectivity’s strategic moat is its stable recurring revenue and solid balance sheet, offering a safer harbor amid market fluctuations. While its profitability trend is declining, it maintains strong free cash flow yield and interest coverage, supporting financial resilience. More suitable for a GARP (Growth at a Reasonable Price) portfolio seeking stability with growth potential.
If you prioritize durable value creation and accelerating earnings, Amphenol outshines with its robust profitability and growth trajectory despite a lofty valuation. However, if you seek better capital preservation and steady cash flow, TE Connectivity offers superior stability and a more conservative risk profile. Both present analytical scenarios aligned with distinct investor risk appetites and strategic goals.
Disclaimer: Investment carries a risk of loss of initial capital. The past performance is not a reliable indicator of future results. Be sure to understand risks before making an investment decision.
Go Further
I encourage you to read the complete analyses of Amphenol Corporation and TE Connectivity Ltd. to enhance your investment decisions: