Home > Comparison > Technology > APH vs SANM
The strategic rivalry between Amphenol Corporation and Sanmina Corporation shapes the future of the Technology sector’s Hardware, Equipment & Parts industry. Amphenol operates as a capital-intensive manufacturer of electronic connectors and sensors, while Sanmina focuses on integrated manufacturing solutions and complex system assembly. This head-to-head pits scale and product breadth against specialized contract manufacturing. This analysis aims to identify which business model offers superior risk-adjusted returns for a diversified portfolio.
Table of contents
Companies Overview
Amphenol Corporation and Sanmina Corporation are pivotal players in the hardware manufacturing sector, shaping technology infrastructure globally.
Amphenol Corporation: Connector and Sensor Innovator
Amphenol dominates as a leading designer and manufacturer of electrical, electronic, and fiber optic connectors. Its revenue stems from diversified segments like harsh environment solutions and communications systems. In 2026, the company focuses strategically on expanding its sensor systems and high-speed interconnect products across automotive, aerospace, and IT markets, leveraging a broad product portfolio and global reach.
Sanmina Corporation: Integrated Manufacturing Specialist
Sanmina stands out as a comprehensive provider of integrated manufacturing solutions and after-market services. Its revenue engine revolves around product design, assembly, and logistics for OEMs in defense, medical, and automotive sectors. In 2026, Sanmina emphasizes enhancing supply chain management and cloud-based manufacturing execution software, aiming to streamline production and support complex customer demands.
Strategic Collision: Similarities & Divergences
Both companies operate in hardware and interconnect systems but diverge in approach—Amphenol focuses on proprietary connector innovation while Sanmina prioritizes integrated manufacturing and services. Their primary battleground lies in serving OEMs requiring complex, high-reliability components and assembly. Amphenol projects a capital-intensive, product-driven profile; Sanmina balances manufacturing scale with service integration, reflecting distinct risk and growth dynamics.
Income Statement Comparison
This data dissects the core profitability and scalability of both corporate engines to reveal who dominates the bottom line:
| Metric | Amphenol Corporation (APH) | Sanmina Corporation (SANM) |
|---|---|---|
| Revenue | 23B | 8.1B |
| Cost of Revenue | 14.6B | 7.4B |
| Operating Expenses | 2.5B | 362M |
| Gross Profit | 8.5B | 716M |
| EBITDA | 6.9B | 463M |
| EBIT | 6B | 344M |
| Interest Expense | 368M | 4.3M |
| Net Income | 4.3B | 246M |
| EPS | 3.51 | 4.56 |
| Fiscal Year | 2025 | 2025 |
Income Statement Analysis: The Bottom-Line Duel
This income statement comparison reveals which company runs a more efficient and profitable corporate engine through recent financial performance.
Amphenol Corporation Analysis
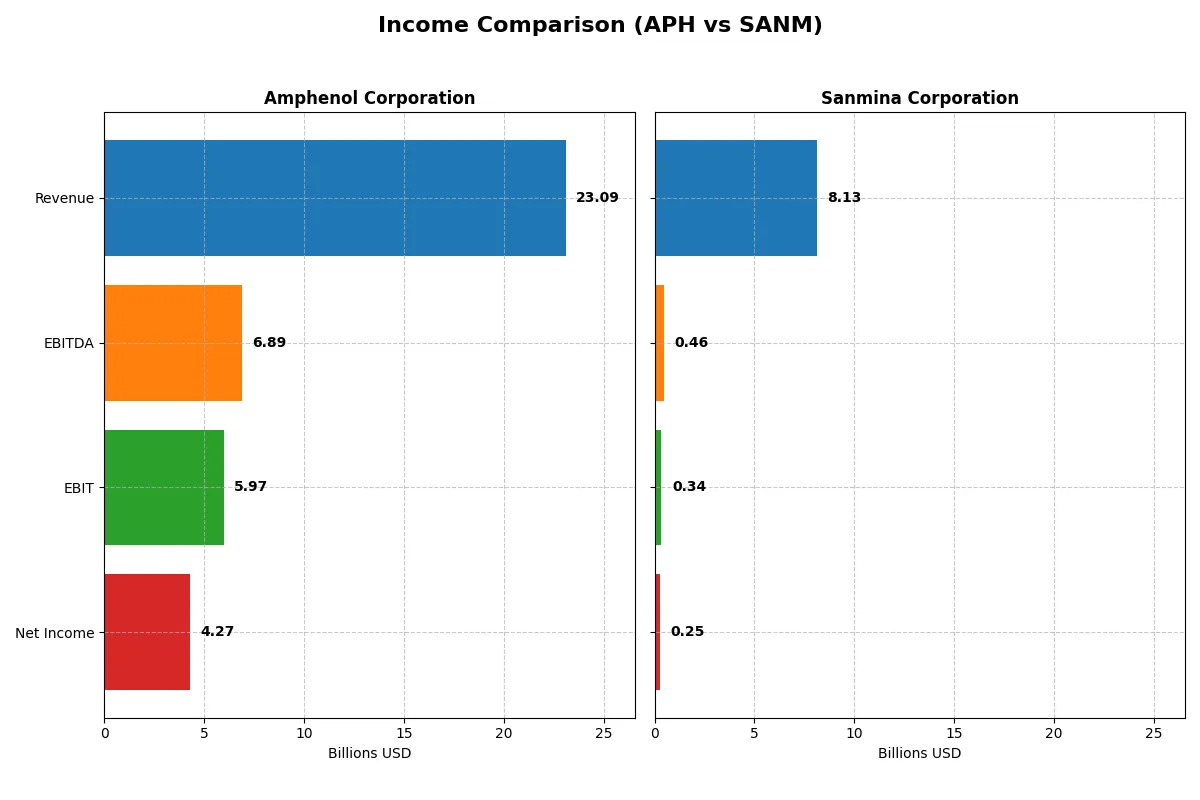
Amphenol’s revenue surged from 10.9B in 2021 to 23.1B in 2025, doubling its scale with net income climbing from 1.59B to 4.27B. Gross margin stays robust near 37%, while net margin improved to 18.5%, signaling strong cost control. The 2025 leap in earnings and margins shows growing operational efficiency and momentum.
Sanmina Corporation Analysis
Sanmina’s revenue grew modestly from 6.7B in 2021 to 8.1B in 2025, with net income roughly flat around 245M. Gross margin lingers below 9%, and net margin is a thin 3%, reflecting tighter profitability. Despite slight revenue gains, stagnant net income and low margins highlight persistent margin pressure and weaker operational leverage.
Margin Strength vs. Revenue Growth
Amphenol clearly outperforms Sanmina in profitability and scale, with superior margins and a more than twofold revenue increase in five years. Sanmina’s flat net income and slim margins contrast sharply against Amphenol’s efficient growth. For investors prioritizing earnings quality and margin expansion, Amphenol’s profile proves more compelling.
Financial Ratios Comparison
These vital ratios act as a diagnostic tool to expose the underlying fiscal health, valuation premiums, and capital efficiency of the companies compared below:
| Ratios | Amphenol Corporation (APH) | Sanmina Corporation (SANM) |
|---|---|---|
| ROE | 24.8% | 10.4% |
| ROIC | 14.9% | 9.0% |
| P/E | 34.5 | 25.6 |
| P/B | 8.54 | 2.67 |
| Current Ratio | 2.37 | 1.72 |
| Quick Ratio | 1.75 | 1.02 |
| D/E (Debt-to-Equity) | 0.74 | 0.17 |
| Debt-to-Assets | 34.0% | 6.7% |
| Interest Coverage | 15.1 | 82.5 |
| Asset Turnover | 0.71 | 1.39 |
| Fixed Asset Turnover | 7.26 | 11.91 |
| Payout ratio | 24.6% | 0% |
| Dividend yield | 0.71% | 0% |
| Fiscal Year | 2024 | 2025 |
Efficiency & Valuation Duel: The Vital Signs
Financial ratios serve as a company’s DNA, exposing hidden risks and operational strengths for investors to decode.
Amphenol Corporation
Amphenol delivers strong profitability with a 24.75% ROE and a solid 15.92% net margin, signaling operational efficiency. However, its valuation looks stretched with a high P/E of 34.49 and P/B at 8.54. The company returns value through a modest 0.71% dividend yield, balancing shareholder rewards with ongoing R&D investment.
Sanmina Corporation
Sanmina posts a modest 10.45% ROE and a low 3.03% net margin, suggesting limited profitability. Its valuation appears more reasonable with a P/E of 25.59 and P/B of 2.67. Sanmina opts not to pay dividends, instead favoring reinvestment to fuel growth, supported by efficient asset turnover and robust interest coverage.
Premium Valuation vs. Operational Safety
Amphenol’s premium valuation reflects its superior profitability but increases risk exposure. Sanmina offers a more conservative valuation with stable capital efficiency but weaker margins. Investors seeking growth with operational safety might prefer Sanmina’s profile, while those favoring proven profitability accept Amphenol’s stretched multiples.
Which one offers the Superior Shareholder Reward?
Amphenol (APH) pays a modest dividend yield near 0.7% with a sustainable payout ratio around 25%. Its free cash flow coverage exceeds 75%, supporting steady dividends and robust buybacks. Sanmina (SANM) skips dividends entirely, reinvesting heavily in growth with free cash flow around 8.6B and capex near 2.7B, fueling an aggressive expansion. SANM’s buybacks are limited, focusing on reinvestment, while APH balances dividends and buybacks for shareholder returns. Historically, consistent dividends plus buybacks in a cyclical sector like APH’s create more reliable total returns. I favor Amphenol for superior, sustainable shareholder reward in 2026.
Comparative Score Analysis: The Strategic Profile
The radar chart reveals the fundamental DNA and trade-offs of Amphenol Corporation and Sanmina Corporation, highlighting their financial strengths and weaknesses:
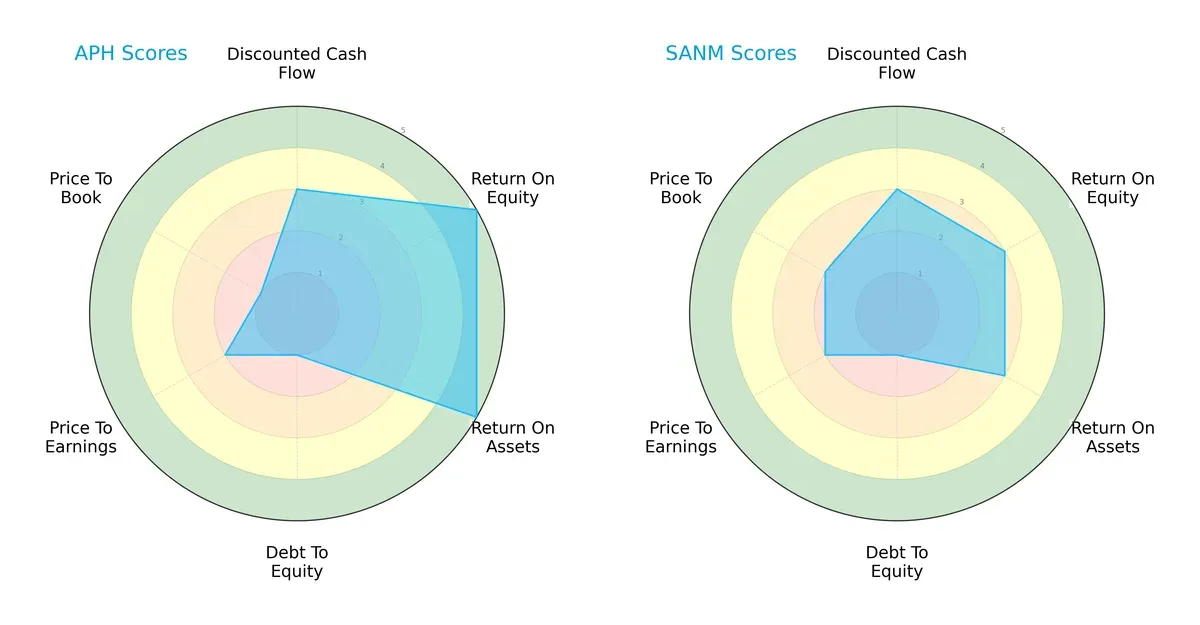
Amphenol dominates in profitability metrics with ROE and ROA scores at 5, signaling efficient capital and asset usage. Sanmina trails with moderate scores of 3 in these areas. Both firms share a very unfavorable debt-to-equity score of 1, signaling high leverage risk. Amphenol’s valuation metrics show a weakness in price-to-book at 1, while Sanmina fares slightly better. Overall, Amphenol presents a more balanced profile driven by operational efficiency, whereas Sanmina relies on moderate valuation strength.
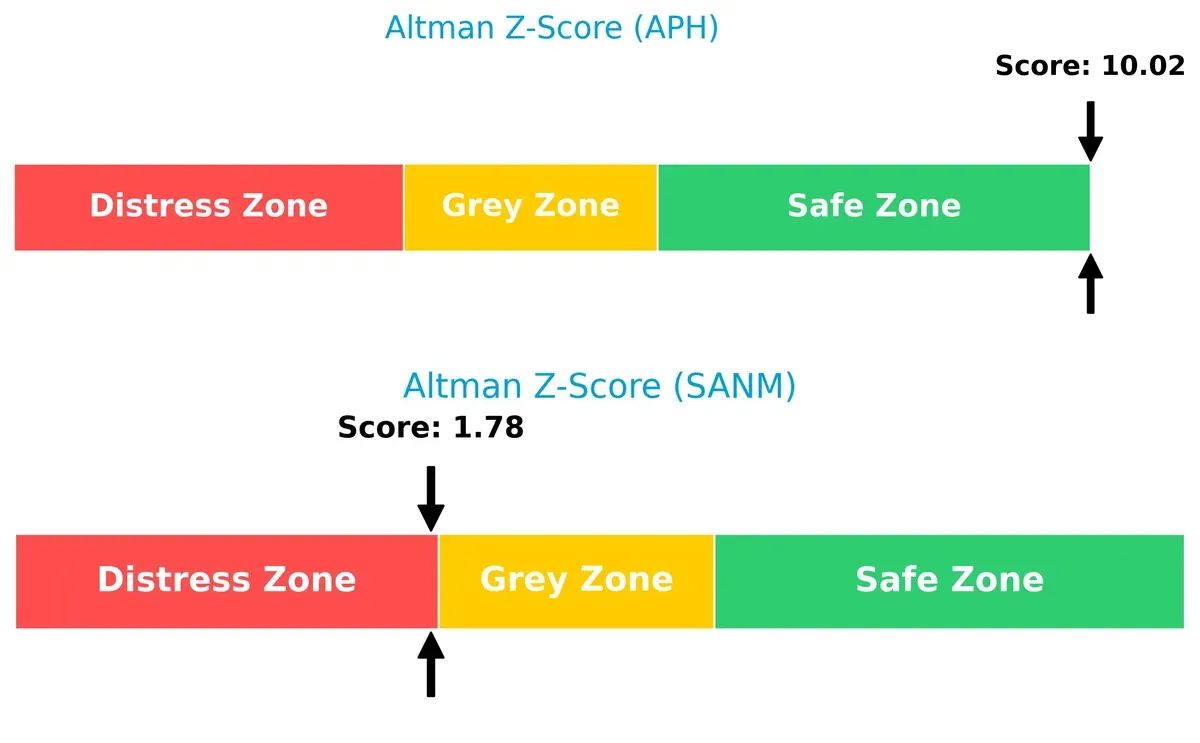
Bankruptcy Risk: Solvency Showdown
Amphenol’s Altman Z-Score of 10.0 places it firmly in the safe zone, reflecting robust financial stability. Sanmina’s score of 1.78 signals distress risk, suggesting vulnerability in this cycle:
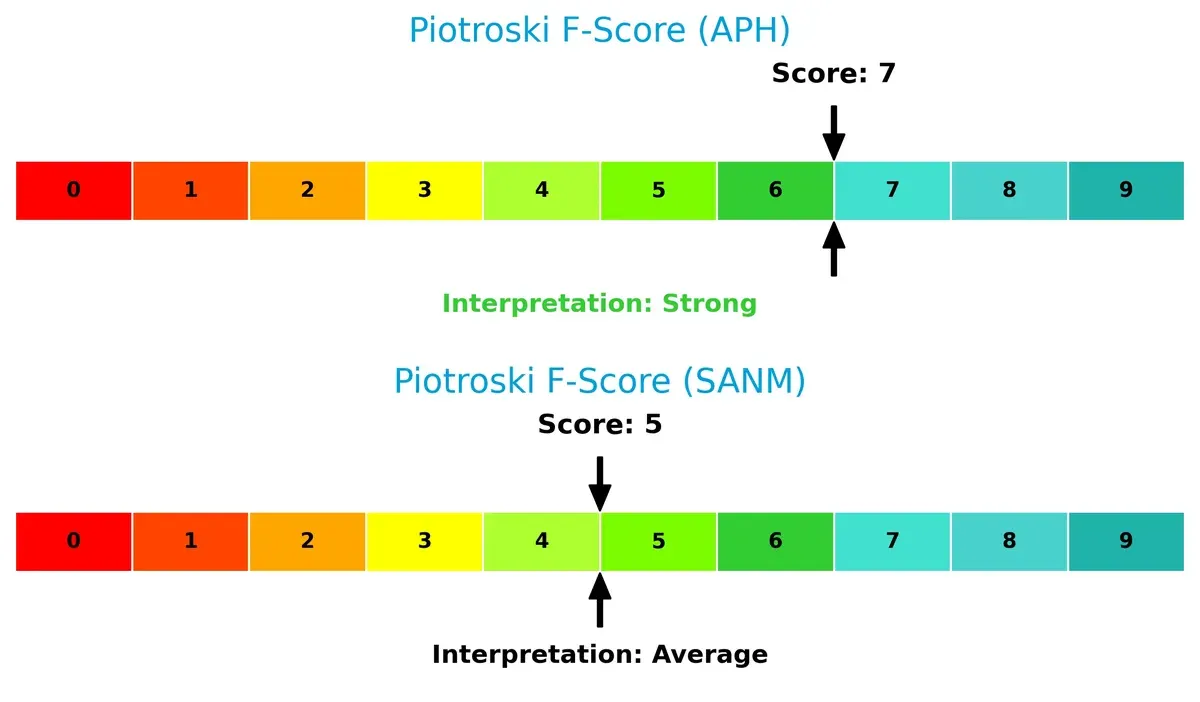
Financial Health: Quality of Operations
Amphenol’s Piotroski F-Score of 7 indicates strong financial health with solid internal metrics. Sanmina’s score of 5 is average, hinting at potential internal weaknesses relative to its peer:
How are the two companies positioned?
This section dissects the operational DNA of Amphenol and Sanmina by comparing their revenue distribution and internal strengths and weaknesses. The final objective is to confront their economic moats to identify which model offers the most resilient competitive advantage today.
Revenue Segmentation: The Strategic Mix
This comparison dissects how Amphenol Corporation and Sanmina Corporation diversify their income streams and reveals where their primary sector bets lie:
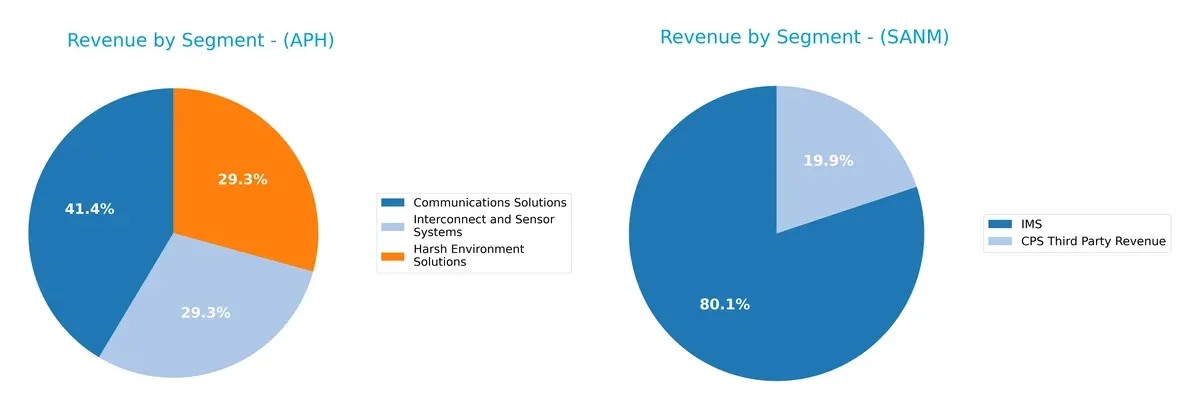
Amphenol shows a balanced revenue mix with Communications Solutions at $6.38B, Harsh Environment Solutions at $4.51B, and Interconnect and Sensor Systems at $4.51B in 2024. Sanmina pivots around two segments: IMS dominates at $6.03B, while CPS Third Party Revenue lags at $1.53B. Amphenol’s diverse portfolio reduces concentration risk, while Sanmina’s reliance on IMS signals infrastructure dominance but higher dependency risk.
Strengths and Weaknesses Comparison
This table compares the strengths and weaknesses of Amphenol Corporation and Sanmina Corporation:
Amphenol Corporation Strengths
- Diversified revenue across Communications, Harsh Environment, and Interconnect segments
- Strong profitability with 15.92% net margin and 24.75% ROE
- Solid liquidity ratios: current 2.37 and quick 1.75
- Robust global presence with significant revenue from US, China, and other foreign locations
- Favorable fixed asset turnover of 7.26 indicating efficient asset use
Sanmina Corporation Strengths
- Favorable liquidity with current ratio 1.72 and quick ratio 1.02
- Low leverage with debt-to-assets 6.73% and debt-to-equity 0.17
- High interest coverage at 80.01 signals strong earnings to cover debt
- Efficient asset turnover of 1.39 and fixed asset turnover 11.91
- Geographic diversification across Americas, Asia Pacific, and EMEA
Amphenol Corporation Weaknesses
- Elevated valuation multiples: PE 34.49 and PB 8.54, implying expensive stock
- Dividend yield low at 0.71% which may deter income-focused investors
- Moderate debt levels with debt-to-assets near 34%
- Neutral WACC at 9.01% may limit capital cost advantage
- Asset turnover moderate at 0.71, suggesting room for operational improvement
Sanmina Corporation Weaknesses
- Low net margin at 3.03%, indicating limited profitability
- PE ratio high at 25.59, reflecting elevated valuation risk
- No dividend yield, limiting shareholder income benefits
- ROE and ROIC neutral, showing average capital efficiency
- Revenue less diversified, concentrated in IMS and CPS segments
Both companies show balanced profiles with strengths in liquidity and asset efficiency. Amphenol’s broad product diversification and profitability contrast with Sanmina’s lower leverage and stronger interest coverage. However, both face valuation and profitability challenges that could impact strategic flexibility and investor appeal.
The Moat Duel: Analyzing Competitive Defensibility
A structural moat is the only reliable shield protecting long-term profits from competitive erosion in capital-intensive industries:
Amphenol Corporation: Intangible Assets and Scale-Driven Moat
Amphenol’s moat stems from its vast product portfolio and global manufacturing scale, enabling stable 25.8% EBIT margins and expanding ROIC. New markets in harsh environment connectors promise deeper moat in 2026.
Sanmina Corporation: Cost Advantage with Narrow Margins
Sanmina relies on cost efficiency through integrated manufacturing, but weaker 4.2% EBIT margins and declining ROIC highlight a fragile moat. Growth hinges on expanding cloud and defense contracts to offset margin pressure.
Verdict: Intangible Assets and Scale vs. Cost Efficiency
Amphenol’s wider, durable moat outperforms Sanmina’s narrow, cost-based advantage. Amphenol’s rising ROIC and margin stability position it better to defend market share in intensifying competition.
Which stock offers better returns?
Over the past year, both stocks delivered strong gains, with Amphenol showing accelerating strength while Sanmina experienced a recent pullback despite long-term growth.
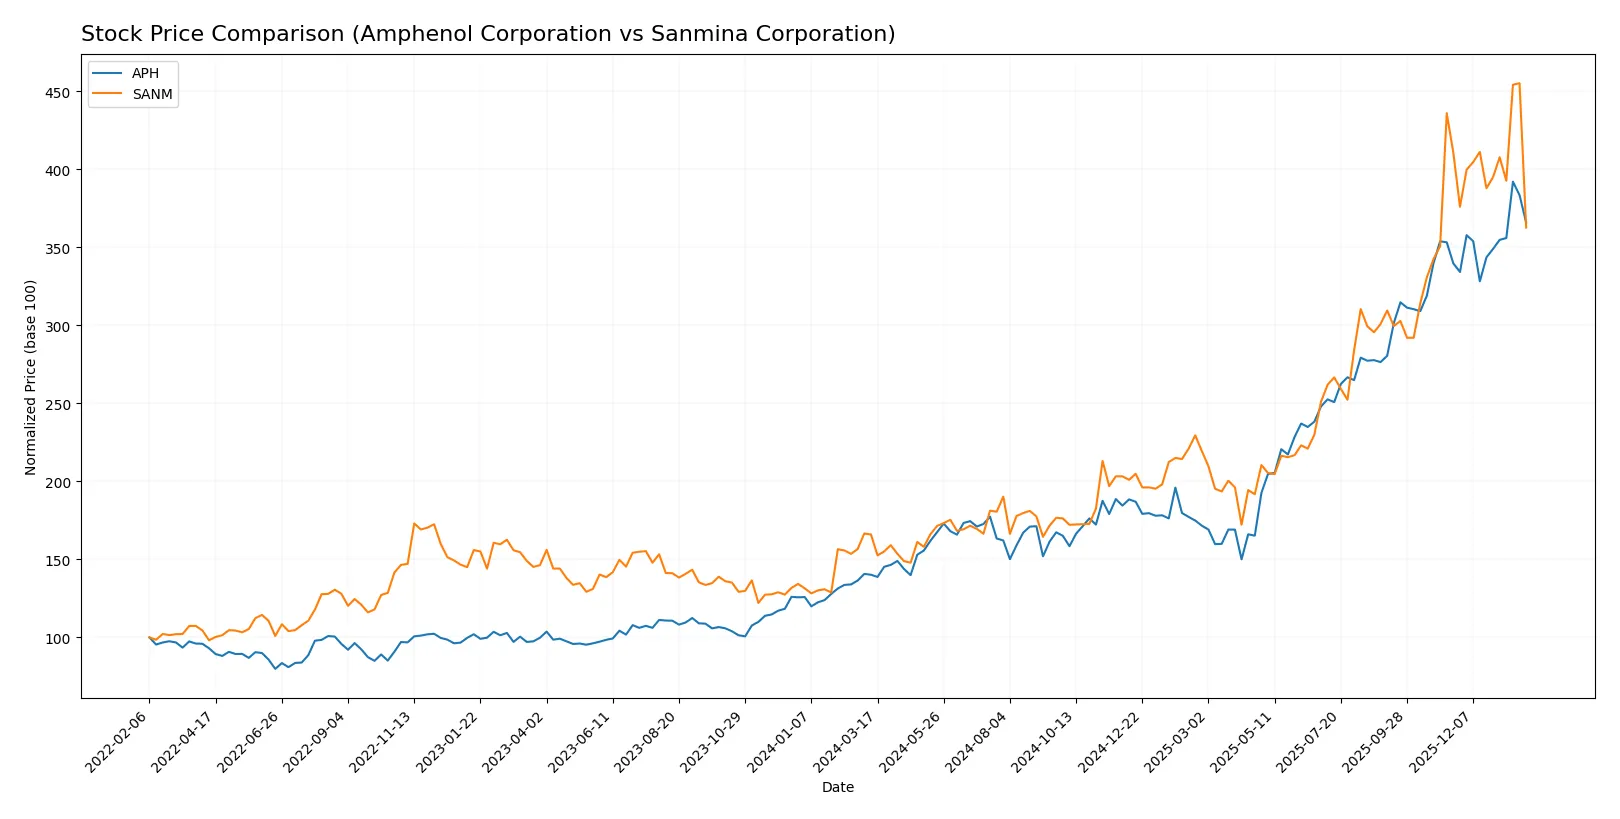
Trend Comparison
Amphenol’s stock rose 161% over 12 months, marking a bullish trend with accelerating momentum and a high volatility level of 28.51%. It reached a peak of 154.39, up from a low of 54.65.
Sanmina’s stock gained 118% over the same period, also bullish but with decelerating momentum. Volatility was higher at 31.84%, with a high of 177.83 and a low of 57.79.
Amphenol outperformed Sanmina in total returns, showing stronger recent acceleration despite both stocks maintaining overall bullish trends.
Target Prices
Analysts present a confident target price range for both Amphenol Corporation and Sanmina Corporation.
| Company | Target Low | Target High | Consensus |
|---|---|---|---|
| Amphenol Corporation | 139 | 210 | 174.13 |
| Sanmina Corporation | 200 | 200 | 200 |
The target consensus for Amphenol suggests upside potential from its current 144.08 price, while Sanmina’s fixed target at 200 indicates strong growth expectations well above its 141.68 price.

Don’t Let Luck Decide Your Entry Point
Optimize your entry points with our advanced ProRealTime indicators. You’ll get efficient buy signals with precise price targets for maximum performance. Start outperforming now!
How do institutions grade them?
Amphenol Corporation Grades
The latest institutional grades for Amphenol Corporation are summarized in the table below.
| Grading Company | Action | New Grade | Date |
|---|---|---|---|
| Citigroup | Maintain | Buy | 2026-01-29 |
| Barclays | Upgrade | Overweight | 2026-01-12 |
| JP Morgan | Maintain | Overweight | 2026-01-27 |
| UBS | Maintain | Buy | 2026-01-14 |
| Truist Securities | Maintain | Buy | 2025-12-19 |
Sanmina Corporation Grades
The latest institutional grades for Sanmina Corporation are summarized in the table below.
| Grading Company | Action | New Grade | Date |
|---|---|---|---|
| Argus Research | Maintain | Buy | 2026-01-28 |
| B of A Securities | Maintain | Neutral | 2025-07-11 |
| Craig-Hallum | Maintain | Hold | 2024-11-05 |
Which company has the best grades?
Amphenol Corporation consistently receives Buy and Overweight ratings from top-tier firms. Sanmina shows a mix of Buy, Neutral, and Hold grades. Amphenol’s stronger consensus grading suggests better institutional confidence, which may influence investor sentiment and capital flows.
Risks specific to each company
The following categories identify critical pressure points and systemic threats facing Amphenol Corporation and Sanmina Corporation in the 2026 market environment:
1. Market & Competition
Amphenol Corporation
- Dominates with diversified connectors; faces intense competition in harsh environment and communication segments.
Sanmina Corporation
- Competes in integrated manufacturing solutions; pressure from global EMS rivals and technological shifts.
2. Capital Structure & Debt
Amphenol Corporation
- Moderate leverage (D/E 0.74); interest coverage strong at 16.23x, but debt-to-equity score very unfavorable.
Sanmina Corporation
- Low leverage (D/E 0.17); excellent interest coverage at 80x; stronger balance sheet reduces financial risk.
3. Stock Volatility
Amphenol Corporation
- Beta 1.21 indicates higher volatility than market; wide price range signals sensitivity to sector cycles.
Sanmina Corporation
- Beta 1.05 close to market; price range wider but lower relative volume, suggesting moderate volatility.
4. Regulatory & Legal
Amphenol Corporation
- Exposure to international trade policies; compliance in aerospace and defense sectors critical.
Sanmina Corporation
- Faces regulatory scrutiny in aerospace and medical segments; supply chain compliance risks persist.
5. Supply Chain & Operations
Amphenol Corporation
- Complex global supply chain; risk from raw material cost inflation and geopolitical disruptions.
Sanmina Corporation
- Integrated manufacturing sensitive to component shortages; operational efficiency is a competitive focus.
6. ESG & Climate Transition
Amphenol Corporation
- Increasing pressure to enhance sustainability in materials and manufacturing processes.
Sanmina Corporation
- ESG initiatives advancing but lagging peers; climate transition risks in energy-intensive operations.
7. Geopolitical Exposure
Amphenol Corporation
- Significant international footprint, especially China and Europe; geopolitical tensions pose risks.
Sanmina Corporation
- Global operations with concentrated exposure in Asia-Pacific; trade tensions impact supply chain continuity.
Which company shows a better risk-adjusted profile?
Amphenol’s key risk lies in its moderate leverage and geopolitical exposure, while Sanmina’s primary challenge is operational sensitivity amid supply chain pressures. Despite Amphenol’s stronger profitability and financial scores, Sanmina’s lower leverage and interest coverage offer a more conservative risk buffer. However, Amphenol’s Altman Z-Score (10.02, safe zone) vastly outperforms Sanmina’s distress zone score (1.78), signalling better financial stability. The sharp recent share price drop in Sanmina (-8.26%) reflects heightened risk perception, underscoring my caution. Overall, Amphenol exhibits a superior risk-adjusted profile supported by robust financial health and operational scale.
Final Verdict: Which stock to choose?
Amphenol Corporation thrives on its superpower of generating robust returns well above its cost of capital, reflecting a durable competitive advantage. Its strong cash flow and efficient capital allocation support growth, though its high valuation multiples warrant caution. It fits well in portfolios targeting aggressive growth with a tolerance for premium pricing.
Sanmina Corporation’s strategic moat lies in its lean asset base and strong operational efficiency, delivering solid free cash flow with lower leverage risk. While its profitability lags behind Amphenol’s, it offers greater capital preservation and financial stability, suiting investors focused on growth at a reasonable price with moderate risk exposure.
If you prioritize durable profitability and market leadership, Amphenol outshines with superior ROIC growth and income expansion. However, if you seek better balance sheet safety and steady cash flow, Sanmina offers better stability despite slower profit growth. Both stocks present distinct analytical scenarios aligned with differing investor risk appetites and growth expectations.
Disclaimer: Investment carries a risk of loss of initial capital. The past performance is not a reliable indicator of future results. Be sure to understand risks before making an investment decision.
Go Further
I encourage you to read the complete analyses of Amphenol Corporation and Sanmina Corporation to enhance your investment decisions: