Home > Comparison > Technology > APH vs SNDK
The strategic rivalry between Amphenol Corporation and Sandisk Corporation shapes the evolution of the technology hardware sector. Amphenol, a capital-intensive connector and interconnect systems manufacturer, contrasts sharply with Sandisk’s focus on high-margin NAND flash storage solutions. This head-to-head embodies a clash between diversified industrial scale and specialized innovation. This analysis will clarify which business model delivers superior risk-adjusted returns for a balanced, forward-looking portfolio.
Table of contents
Companies Overview
Amphenol Corporation and Sandisk Corporation both hold prominent roles in the hardware and technology sectors, shaping critical infrastructure components.
Amphenol Corporation: Connector and Sensor Powerhouse
Amphenol dominates as a designer and manufacturer of electrical and fiber optic connectors. It generates revenue through a diverse product lineup spanning harsh environment solutions, communications, and sensor systems. In 2026, Amphenol’s strategic focus remains on expanding its footprint in automotive, aerospace, and broadband communication markets.
Sandisk Corporation: NAND Flash Storage Innovator
Sandisk leads the development and manufacture of NAND flash-based storage devices. It drives revenue from solid state drives, embedded products, and removable cards. In 2026, Sandisk concentrates on advancing storage solutions to meet growing data demands across consumer and enterprise segments.
Strategic Collision: Similarities & Divergences
Both companies operate in hardware but pursue distinct business models: Amphenol’s broad connector ecosystem contrasts with Sandisk’s specialized flash memory focus. Their primary battleground lies in enabling next-gen technology infrastructure. Their divergent product scopes create unique investment profiles reflecting different risk and growth dynamics.
Income Statement Comparison
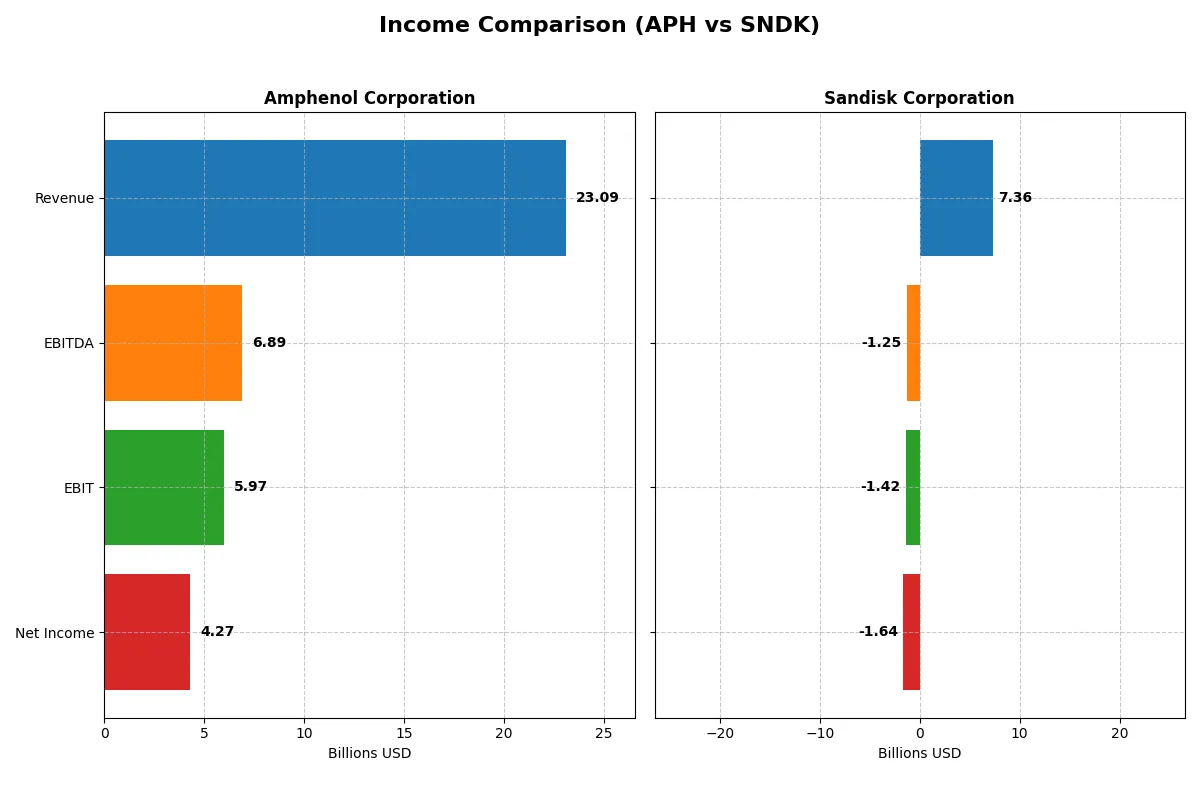
This data dissects the core profitability and scalability of both corporate engines to reveal who dominates the bottom line:
| Metric | Amphenol Corporation (APH) | Sandisk Corporation (SNDK) |
|---|---|---|
| Revenue | 23B | 7.4B |
| Cost of Revenue | 14.6B | 5.1B |
| Operating Expenses | 2.5B | 3.6B |
| Gross Profit | 8.5B | 2.2B |
| EBITDA | 6.9B | -1.3B |
| EBIT | 6.0B | -1.4B |
| Interest Expense | 368M | 63M |
| Net Income | 4.3B | -1.6B |
| EPS | 3.51 | -11.32 |
| Fiscal Year | 2025 | 2025 |
Income Statement Analysis: The Bottom-Line Duel
This income statement comparison reveals which company runs the more efficient and profitable corporate engine through recent financial performance.
Amphenol Corporation Analysis
Amphenol’s revenue surged 51.7% to 23.1B in 2025, with net income climbing 76% to 4.27B. Gross margin stands strong at 36.9%, and net margin improved to 18.5%. The company’s operating leverage and margin expansion reflect disciplined cost control and robust demand momentum in 2025.
Sandisk Corporation Analysis
Sandisk posted 7.35B in revenue for 2025, growing 10.4% year-over-year. However, it reported a net loss of 1.64B with a negative net margin of -22.3%. Despite a gross margin of 30%, heavy operating and other expenses dragged profitability deep into the red, highlighting ongoing operational challenges.
Verdict: Margin Power vs. Revenue Scale
Amphenol clearly outperforms Sandisk with superior margin health and rapid profit growth. While Sandisk maintains modest revenue growth, its persistent net losses and negative EBIT margin signal fundamental weaknesses. Amphenol’s consistent margin expansion and bottom-line strength make it the more compelling earnings profile for investors prioritizing profitability and efficiency.
Financial Ratios Comparison
These vital ratios act as a diagnostic tool to expose the underlying fiscal health, valuation premiums, and capital efficiency of the companies analyzed:
| Ratios | Amphenol Corporation (APH) | Sandisk Corporation (SNDK) |
|---|---|---|
| ROE | 24.8% | -17.8% |
| ROIC | 14.9% | -11.9% |
| P/E | 34.5 | -4.2 |
| P/B | 8.54 | 0.74 |
| Current Ratio | 2.37 | 3.56 |
| Quick Ratio | 1.75 | 2.11 |
| D/E | 0.74 | 0.22 |
| Debt-to-Assets | 33.96% | 15.73% |
| Interest Coverage | 15.1 | -21.9 |
| Asset Turnover | 0.71 | 0.57 |
| Fixed Asset Turnover | 7.26 | 11.88 |
| Payout ratio | 24.6% | 0% |
| Dividend yield | 0.71% | 0% |
| Fiscal Year | 2024 | 2025 |
Efficiency & Valuation Duel: The Vital Signs
Financial ratios act as a company’s DNA, revealing hidden risks, operational strength, and valuation nuances critical for investment decisions.
Amphenol Corporation
Amphenol posts a strong 24.75% ROE and a solid 15.92% net margin, reflecting robust profitability. However, its P/E ratio of 34.49 signals an expensive valuation, stretched relative to market averages. The company returns value modestly through a 0.71% dividend yield, favoring stable payouts over aggressive buybacks or reinvestment.
Sandisk Corporation
Sandisk struggles with a negative 17.81% ROE and a -22.31% net margin, indicating ongoing losses. Its low P/B of 0.74 and negative P/E reflect a distressed valuation, despite a strong current ratio of 3.56. Sandisk reinvests heavily in R&D (15.4% of revenue), foregoing dividends amid operational challenges and cash flow deficits.
Premium Valuation vs. Operational Struggles
Amphenol balances strong profitability with a premium valuation, offering operational safety at a higher price. Sandisk faces steep losses and valuation discounts but invests aggressively in innovation. Risk-tolerant investors seeking turnaround potential may prefer Sandisk, while those valuing steady returns lean toward Amphenol.
Which one offers the Superior Shareholder Reward?
I observe Amphenol (APH) pays a steady dividend yield around 0.7%-1.0% with a sustainable payout ratio near 25%. Its free cash flow comfortably covers dividends, and it executes consistent buybacks, supporting shareholder returns. Sandisk (SNDK) pays no dividends and shows negative free cash flow recently, relying on reinvestment amid losses. Its buyback activity is minimal. I view Amphenol’s balanced dividend and buyback approach as a more sustainable, total return model in 2026. Sandisk’s reinvestment strategy faces execution risks without clear profitability. Thus, Amphenol offers the superior shareholder reward profile today.
Comparative Score Analysis: The Strategic Profile
The radar chart reveals the fundamental DNA and trade-offs of Amphenol Corporation and Sandisk Corporation, highlighting their financial strengths and vulnerabilities:
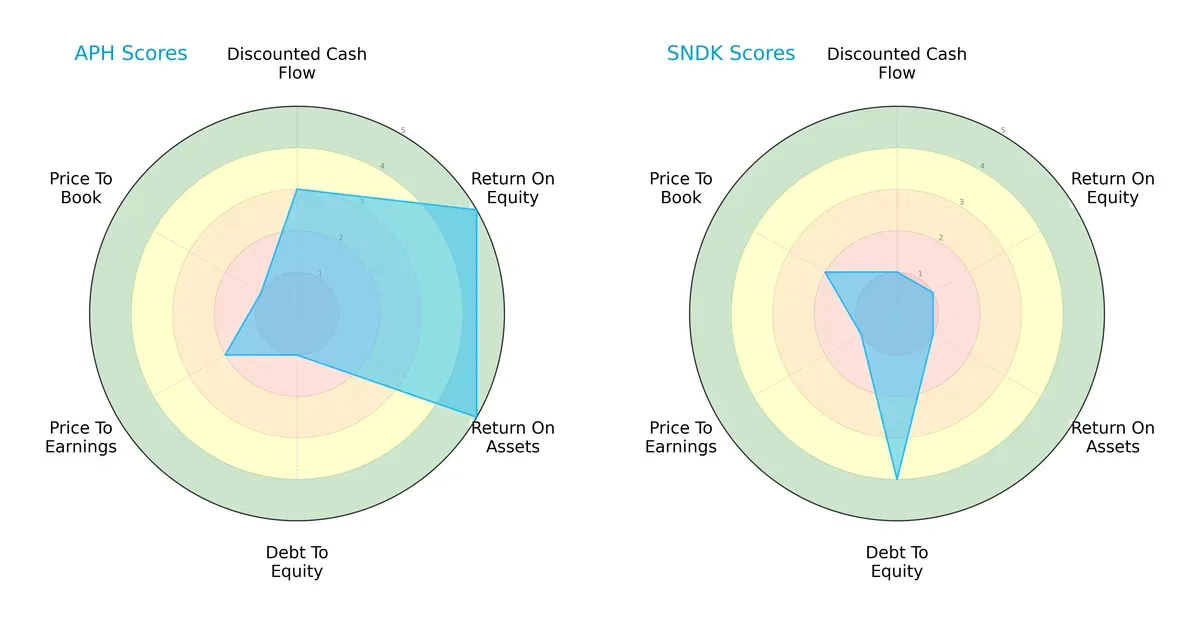
Amphenol shows a balanced profile with strong ROE and ROA scores (5 each), signaling efficient profit generation and asset use. However, its high debt-to-equity risk (score 1) and weak valuation metrics (P/E 2, P/B 1) raise caution. Sandisk relies on financial prudence with favorable debt management (score 4) but suffers from poor operational returns (ROE and ROA scores at 1) and undervaluation signals (P/E 1, P/B 2). I see Amphenol as growth-driven but leveraged, while Sandisk plays conservatively with weaker profitability.
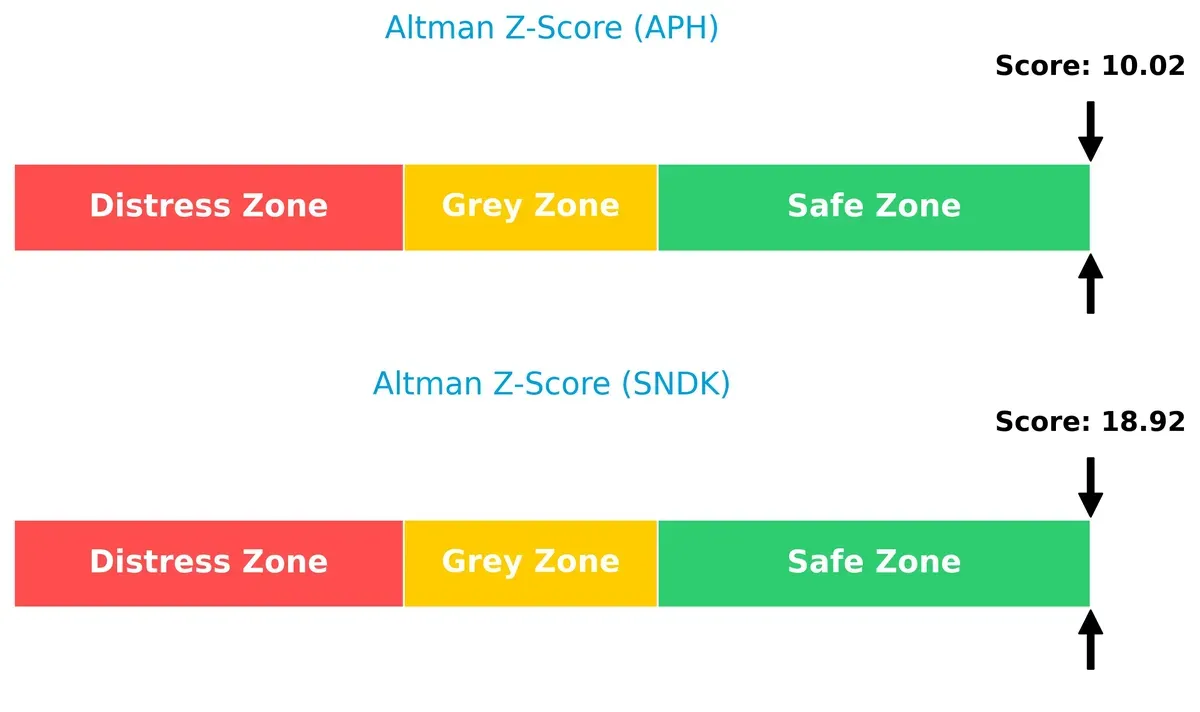
Bankruptcy Risk: Solvency Showdown
Amphenol’s Altman Z-Score (10.0) and Sandisk’s even higher score (18.9) place both firmly in the safe zone, implying strong long-term survival prospects amid economic cycles:
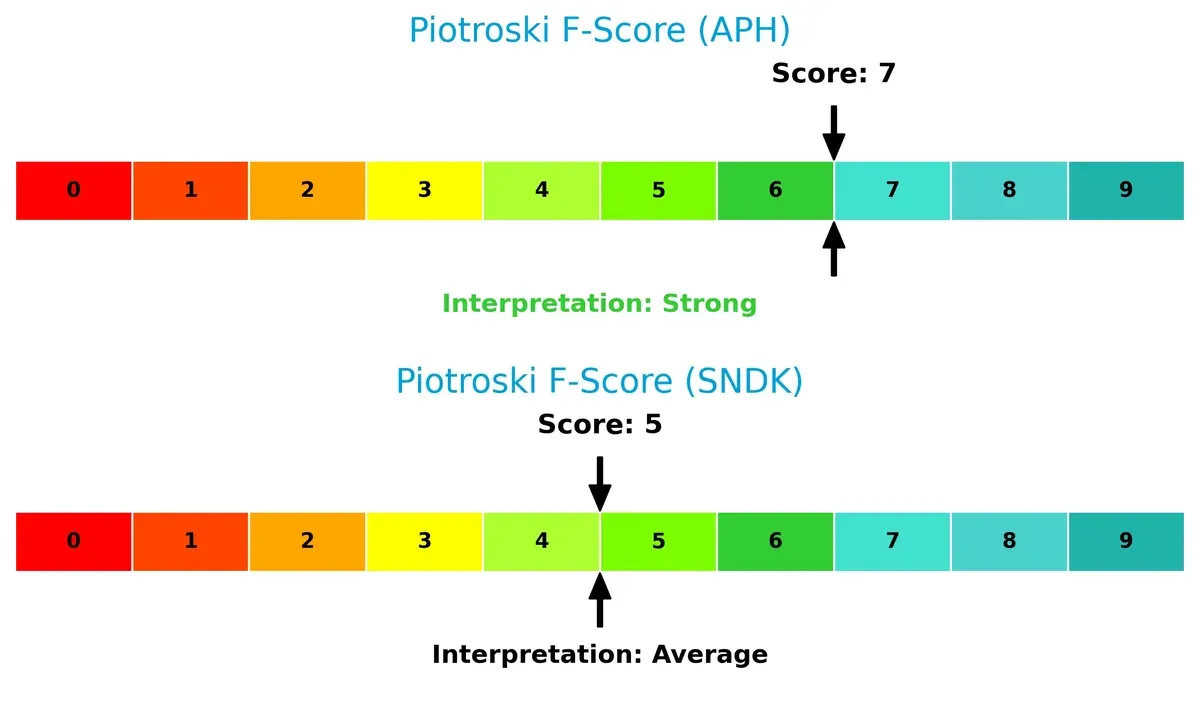
Financial Health: Quality of Operations
Amphenol’s Piotroski F-Score of 7 indicates strong financial health, while Sandisk’s 5 signals average stability. Sandisk’s internal metrics suggest caution compared to Amphenol’s robust operational quality:
How are the two companies positioned?
This section dissects the operational DNA of Amphenol and Sandisk by comparing their revenue distribution and internal dynamics. The ultimate goal is to confront their economic moats to identify which model offers the most resilient, sustainable competitive advantage today.
Revenue Segmentation: The Strategic Mix
The following comparison dissects how Amphenol Corporation and Sandisk Corporation diversify their income streams and where their primary sector bets lie:
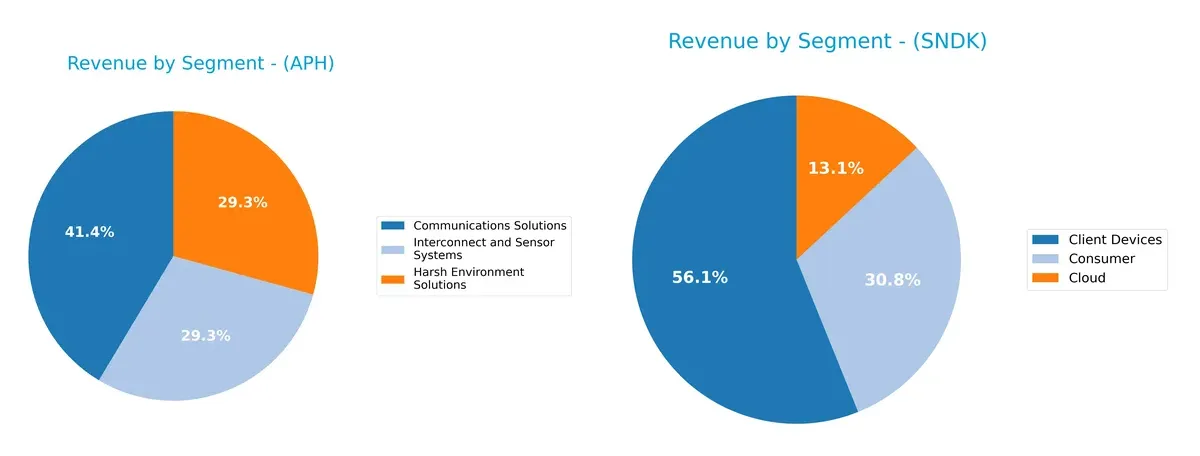
Amphenol shows a balanced mix with Communications Solutions at $6.38B, and Harsh Environment plus Interconnect Systems each near $4.5B. Sandisk pivots heavily on Client Devices with $4.13B, while Cloud lags at $960M. Amphenol’s diversified base reduces concentration risk and signals infrastructure dominance. Sandisk’s reliance on Client Devices creates ecosystem lock-in but exposes it to sector volatility.
Strengths and Weaknesses Comparison
This table compares the Strengths and Weaknesses of Amphenol Corporation and Sandisk Corporation:
Amphenol Corporation Strengths
- Diverse segments in Communications, Harsh Environment, and Sensors
- Favorable profitability ratios including 15.92% net margin and 24.75% ROE
- Solid liquidity with 2.37 current and 1.75 quick ratios
- Strong global presence with significant revenue from the US, China, and other foreign markets
Sandisk Corporation Strengths
- Favorable valuation ratios with low PE and PB values
- Low debt levels with 0.22 debt/equity and 15.73% debt/assets
- Favorable fixed asset turnover of 11.88
- Geographic diversity including China, EMEA, US, and Asia regions
Amphenol Corporation Weaknesses
- High price multiples with PE at 34.49 and PB at 8.54
- Dividend yield low at 0.71%
- Neutral leverage metrics with 0.74 debt/equity and 33.96% debt/assets
- Asset turnover moderate at 0.71
Sandisk Corporation Weaknesses
- Negative profitability with -22.31% net margin, -17.81% ROE, and -11.89% ROIC
- High WACC at 26.32% indicates costly capital
- Poor interest coverage at -22.48 and unfavorable current ratio of 3.56
- No dividend yield and overall slightly unfavorable financial ratios
Amphenol’s strengths lie in diversified revenue streams and solid profitability, while Sandisk benefits from low leverage and attractive valuation ratios. However, Amphenol faces valuation concerns and Sandisk struggles with persistent unprofitability, which impacts their capital efficiency and risk profiles.
The Moat Duel: Analyzing Competitive Defensibility
A structural moat is the only reliable shield protecting long-term profits from relentless competition erosion. Let’s examine the strategic moats of two key players:
Amphenol Corporation: Durable Value Creation Through Specialized Connectors
Amphenol’s moat stems from its intangible assets and cost advantage in harsh environment connectors. Its ROIC exceeds WACC by nearly 6%, reflecting efficient capital use and margin resilience. Expansion into new markets like fiber optics in 2026 should deepen this moat.
Sandisk Corporation: Flash Storage Innovation Under Pressure
Sandisk relies on technology innovation as its moat, contrasting Amphenol’s asset-heavy approach. However, its negative ROIC versus WACC signals value destruction. Intense competition and declining margins pose threats, though upcoming NAND advancements could offer a turnaround opportunity.
Verdict: Specialized Manufacturing vs. Innovation Volatility
Amphenol’s wider and deeper moat, proven by growing ROIC and margin stability, outmatches Sandisk’s eroding competitive edge. Amphenol stands better prepared to defend and grow market share in 2026’s challenging environment.
Which stock offers better returns?
The past year saw significant price appreciation in both stocks, with Sandisk showing pronounced acceleration and Amphenol maintaining steady gains amid evolving trading dynamics.
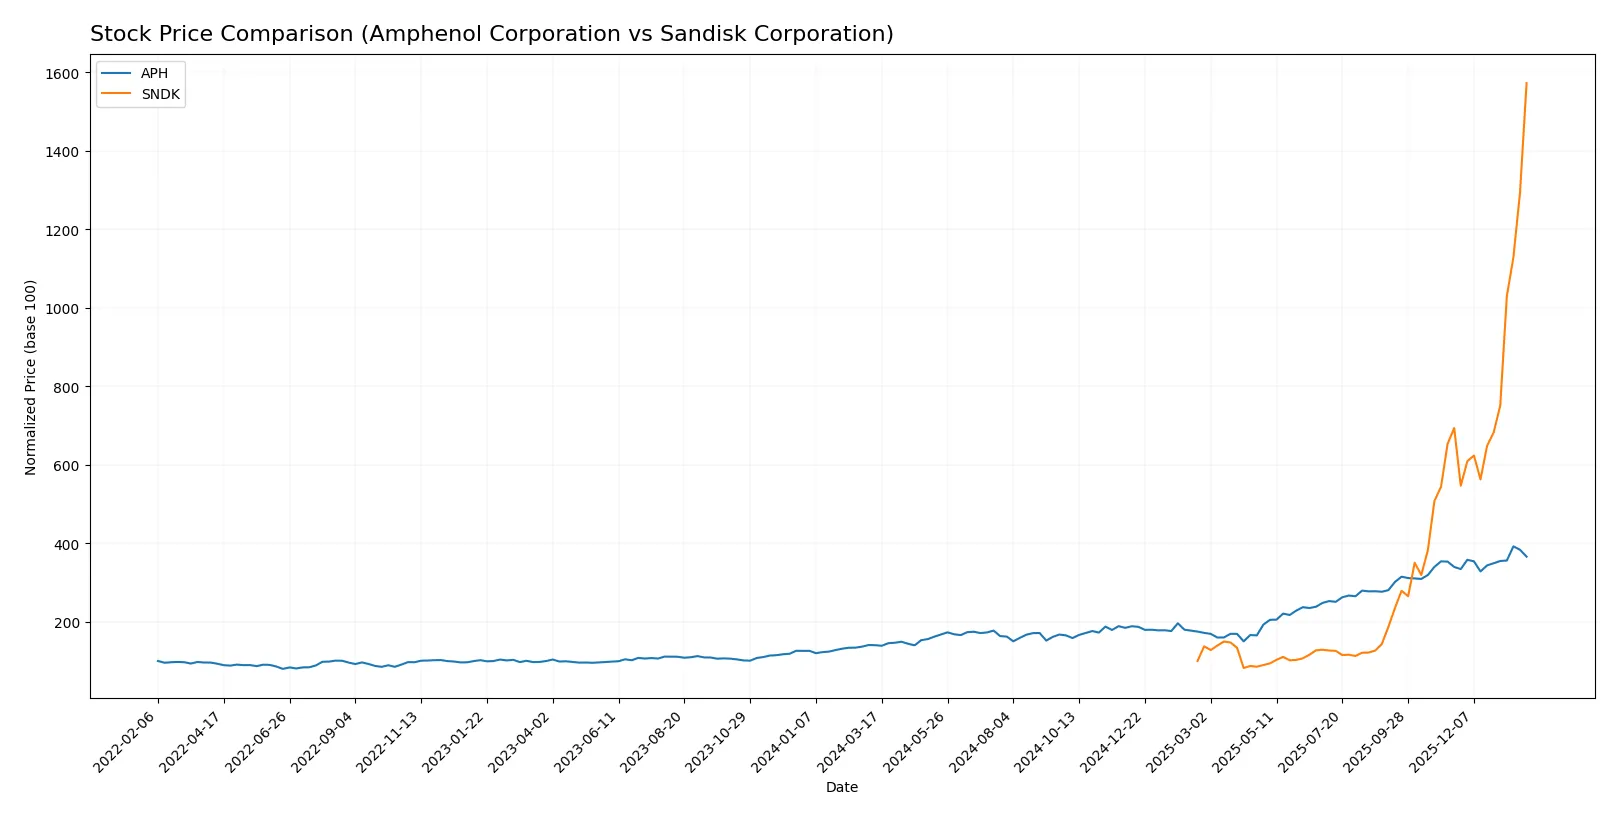
Trend Comparison
Amphenol’s stock surged 161% over the past year, reflecting a bullish trend with accelerating momentum and moderate volatility, peaking at 154.39 and bottoming at 54.65.
Sandisk outperformed with a 1472% gain, exhibiting a strong bullish trend and accelerated growth. It faced high volatility, with prices ranging from 30.11 to 576.25.
Sandisk delivered substantially higher market returns and stronger buyer dominance compared to Amphenol during the same period.
Target Prices
Analysts present a broad consensus on Amphenol Corporation and Sandisk Corporation targets, reflecting strong growth expectations.
| Company | Target Low | Target High | Consensus |
|---|---|---|---|
| Amphenol Corporation | 139 | 210 | 174.13 |
| Sandisk Corporation | 220 | 1000 | 614.62 |
Amphenol’s consensus target at 174.13 suggests a 21% upside from the current 144.08 price. Sandisk’s target consensus of 614.62 implies a 7% upside, indicating high volatility and growth potential.

Don’t Let Luck Decide Your Entry Point
Optimize your entry points with our advanced ProRealTime indicators. You’ll get efficient buy signals with precise price targets for maximum performance. Start outperforming now!
How do institutions grade them?
Amphenol Corporation Grades
Here are recent grades assigned by recognized financial institutions for Amphenol Corporation:
| Grading Company | Action | New Grade | Date |
|---|---|---|---|
| Citigroup | Maintain | Buy | 2026-01-29 |
| Barclays | Maintain | Overweight | 2026-01-29 |
| JP Morgan | Maintain | Overweight | 2026-01-27 |
| UBS | Maintain | Buy | 2026-01-14 |
| Citigroup | Maintain | Buy | 2026-01-12 |
| Barclays | Upgrade | Overweight | 2026-01-12 |
| Truist Securities | Maintain | Buy | 2025-12-19 |
| Barclays | Maintain | Equal Weight | 2025-11-13 |
| Citigroup | Maintain | Buy | 2025-10-23 |
| Truist Securities | Maintain | Buy | 2025-10-23 |
Sandisk Corporation Grades
Below are recent institutional grades issued for Sandisk Corporation from reputable sources:
| Grading Company | Action | New Grade | Date |
|---|---|---|---|
| RBC Capital | Maintain | Sector Perform | 2026-01-30 |
| Jefferies | Maintain | Buy | 2026-01-30 |
| Goldman Sachs | Maintain | Buy | 2026-01-30 |
| Morgan Stanley | Maintain | Overweight | 2026-01-30 |
| Wedbush | Maintain | Outperform | 2026-01-30 |
| Cantor Fitzgerald | Maintain | Overweight | 2026-01-30 |
| Citigroup | Maintain | Buy | 2026-01-20 |
| Wells Fargo | Maintain | Equal Weight | 2026-01-15 |
| Benchmark | Maintain | Buy | 2026-01-15 |
| Bernstein | Maintain | Outperform | 2026-01-14 |
Which company has the best grades?
Sandisk Corporation generally holds higher-tier ratings like “Outperform” and consistent “Buy” grades, suggesting stronger analyst conviction. Amphenol Corporation mainly receives “Buy” and “Overweight” ratings, showing solid but slightly less bullish sentiment. Investors may interpret Sandisk’s superior grades as a sign of greater expected performance or confidence.
Risks specific to each company
The following categories identify the critical pressure points and systemic threats facing both firms in the 2026 market environment:
1. Market & Competition
Amphenol Corporation
- Strong market cap and diversified segments support resilience. Faces intense competition in connectors and sensors.
Sandisk Corporation
- Smaller market cap but high volatility. Competes in NAND flash storage, a highly commoditized market with rapid innovation cycles.
2. Capital Structure & Debt
Amphenol Corporation
- Moderate debt-to-equity ratio at 0.74, interest coverage strong at 16.23, signaling comfortable debt servicing.
Sandisk Corporation
- Low debt-to-equity at 0.22, good leverage profile, but negative interest coverage indicates operational struggles to cover interest expenses.
3. Stock Volatility
Amphenol Corporation
- Beta of 1.21 implies moderate volatility, aligned with sector norms.
Sandisk Corporation
- Beta near 4.89 signals extreme volatility, raising risk for risk-averse investors.
4. Regulatory & Legal
Amphenol Corporation
- Operates globally with exposure to US and China regulations; no major legal issues reported.
Sandisk Corporation
- Faces regulatory scrutiny in technology export controls and IP protection, critical in NAND flash technology.
5. Supply Chain & Operations
Amphenol Corporation
- Diverse supply chain with value-add product lines reduces single-source risk.
Sandisk Corporation
- NAND flash manufacturing heavily reliant on semiconductor supply chains, vulnerable to disruptions and cost inflation.
6. ESG & Climate Transition
Amphenol Corporation
- Moderate ESG risks; operates in hardware with focus on sustainability in manufacturing.
Sanddisk Corporation
- Growing pressure to address energy consumption in semiconductor fabrication, potentially increasing costs.
7. Geopolitical Exposure
Amphenol Corporation
- Significant international sales including China, exposing it to trade tensions and tariffs.
Sandisk Corporation
- Significant exposure to US-China tech rivalry, which could disrupt supply and sales channels.
Which company shows a better risk-adjusted profile?
Amphenol’s moderate leverage, robust interest coverage, and diversified product lines provide a more stable risk profile. Sandisk’s extreme stock volatility, negative profitability metrics, and operational risks in a cyclical semiconductor market heighten its risk burden. Amphenol’s Altman Z-score above 10 and strong profitability contrast sharply with Sandisk’s losses and financial instability, confirming Amphenol as the safer, better risk-adjusted investment in 2026.
Final Verdict: Which stock to choose?
Amphenol Corporation’s superpower lies in its durable competitive advantage underpinned by a growing ROIC well above its WACC. It efficiently converts capital into profits while sustaining strong income statement growth. A point of vigilance remains its elevated valuation multiples, which may pressure returns. This stock suits an Aggressive Growth portfolio seeking quality with momentum.
Sandisk Corporation’s strategic moat centers on a deep asset base and low leverage, offering a cushion in turbulent markets. However, it currently struggles with value destruction and negative profitability trends, signaling operational challenges. Relative to Amphenol, Sandisk provides a more defensive profile for investors favoring turnaround potential. It fits a GARP (Growth at a Reasonable Price) approach with risk tolerance.
If you prioritize consistent value creation with strong profitability and are comfortable with premium valuation, Amphenol outshines as the compelling choice due to its robust moat and growth trajectory. However, if you seek a contrarian play with balance sheet strength and potential recovery upside, Sandisk offers better stability despite current headwinds. Both scenarios require disciplined risk management given distinct risk-reward profiles.
Disclaimer: Investment carries a risk of loss of initial capital. The past performance is not a reliable indicator of future results. Be sure to understand risks before making an investment decision.
Go Further
I encourage you to read the complete analyses of Amphenol Corporation and Sandisk Corporation to enhance your investment decisions: