Home > Comparison > Technology > APH vs OUST
The strategic rivalry between Amphenol Corporation and Ouster, Inc. shapes the future of the technology sector’s hardware, equipment, and parts industry. Amphenol operates as a capital-intensive industrial giant with diversified electrical and fiber optic connectors. Ouster, by contrast, focuses on high-tech, high-growth lidar sensors and software with a leaner operational footprint. This analysis will determine which company’s trajectory offers superior risk-adjusted returns for a diversified portfolio.
Table of contents
Companies Overview
Amphenol Corporation and Ouster, Inc. both shape crucial segments of the hardware equipment market with distinct scale and innovation footprints.
Amphenol Corporation: Global Connector and Sensor Leader
Amphenol dominates as a global designer and manufacturer of electrical, electronic, and fiber optic connectors. Its revenue stems from diversified segments including harsh environment and communication solutions, serving automotive to military markets. In 2026, Amphenol focuses strategically on expanding value-added products like cable assemblies to deepen its market penetration and fortify its competitive moat.
Ouster, Inc.: High-Resolution Lidar Innovator
Ouster specializes as a cutting-edge digital lidar sensor designer. It generates revenue through sales of 3D vision sensors for vehicles, robots, and infrastructure. In 2026, Ouster sharpens its focus on advancing solid-state flash sensors to capture a growing autonomous systems market, aiming to leverage tech innovation against larger incumbents.
Strategic Collision: Similarities & Divergences
Amphenol pursues a broad, diversified hardware portfolio, relying on scale and longstanding OEM relationships. Ouster adopts a niche, high-tech focus emphasizing innovation in lidar technology. Their primary battleground lies in supplying sensors and connectors to emerging autonomous and industrial applications. These contrasting models create distinct investment profiles: Amphenol as a stable industrial stalwart, Ouster as a volatile growth disruptor.
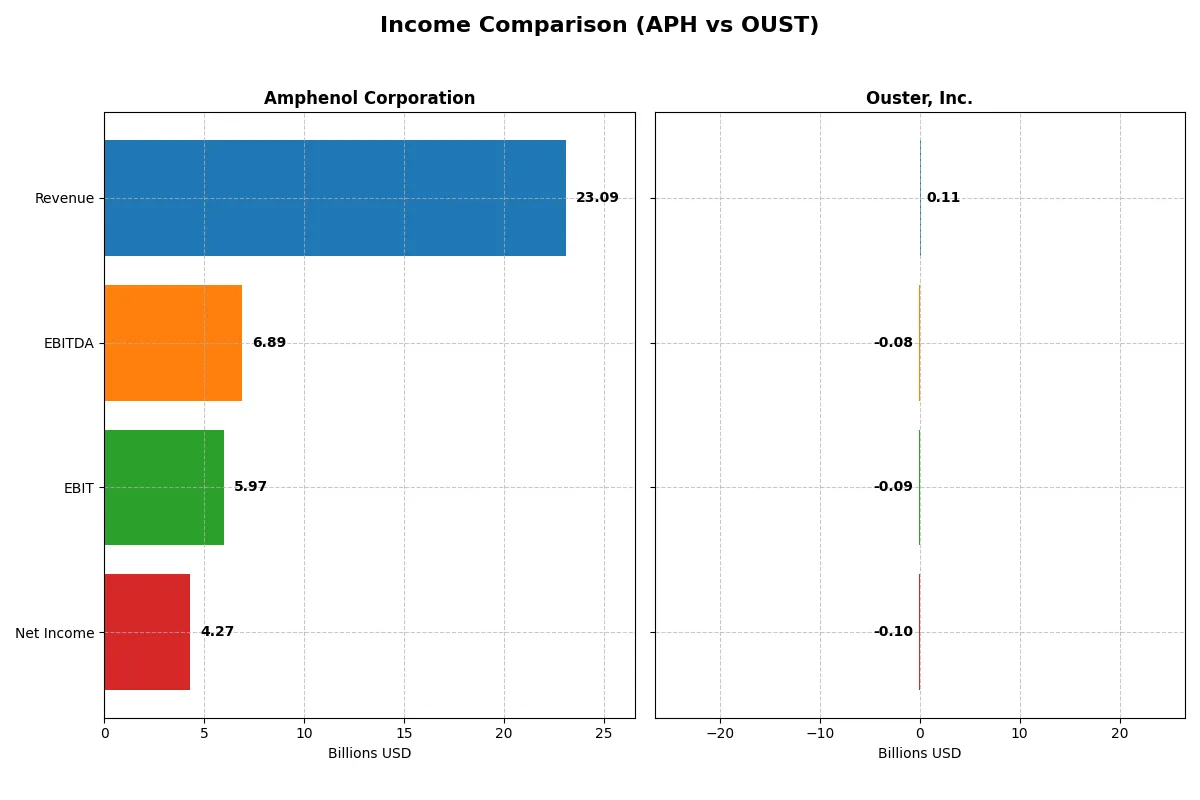
Income Statement Comparison
This data dissects the core profitability and scalability of both corporate engines to reveal who dominates the bottom line:
| Metric | Amphenol Corporation (APH) | Ouster, Inc. (OUST) |
|---|---|---|
| Revenue | 23.1B | 111.1M |
| Cost of Revenue | 14.6B | 70.6M |
| Operating Expenses | 2.55B | 144.6M |
| Gross Profit | 8.52B | 40.5M |
| EBITDA | 6.89B | -79.9M |
| EBIT | 5.97B | -94.7M |
| Interest Expense | 368M | 1.82M |
| Net Income | 4.27B | -97.0M |
| EPS | 3.51 | -2.08 |
| Fiscal Year | 2025 | 2024 |
Income Statement Analysis: The Bottom-Line Duel
The following income statement comparison reveals the true efficiency of each company’s core business and profitability trends over recent years.
Amphenol Corporation Analysis
Amphenol’s revenue surged from $10.9B in 2021 to $23.1B in 2025, with net income rising from $1.59B to $4.27B. Gross margin improved steadily to 36.9%, while net margin reached a robust 18.5%. In 2025, Amphenol’s efficiency shines through an 85% EBIT growth, reflecting strong operational leverage and disciplined expense management.
Ouster, Inc. Analysis
Ouster’s revenue grew from $33.6M in 2021 to $111.1M in 2024, showing rapid top-line expansion. However, net losses persist, though shrinking from -$94M to -$97M, with a negative net margin of -87.4%. Despite sizable R&D and SG&A expenses, Ouster’s 2024 gross margin held steady at 36.4%, signaling improving scalability amid ongoing investment.
Margin Power vs. Revenue Scale
Amphenol dominates with consistent profitability and margin expansion, delivering strong earnings growth and operational efficiency. Ouster impresses with exceptional revenue growth but remains unprofitable, reflecting its early-stage investment phase. For investors, Amphenol’s mature profit profile offers stability, while Ouster’s high-growth but loss-making model carries higher risk and longer-term uncertainty.
Financial Ratios Comparison
These vital ratios act as a diagnostic tool to expose the underlying fiscal health, valuation premiums, and capital efficiency of the companies analyzed:
| Ratios | Amphenol Corporation (APH) | Ouster, Inc. (OUST) |
|---|---|---|
| ROE | 24.8% | -53.6% |
| ROIC | 14.9% | -50.8% |
| P/E | 34.5 | -5.9 |
| P/B | 8.54 | 3.15 |
| Current Ratio | 2.37 | 2.80 |
| Quick Ratio | 1.75 | 2.59 |
| D/E | 0.74 | 0.11 |
| Debt-to-Assets | 34.0% | 7.3% |
| Interest Coverage | 15.1 | -57.1 |
| Asset Turnover | 0.71 | 0.40 |
| Fixed Asset Turnover | 7.26 | 4.54 |
| Payout Ratio | 24.6% | 0% |
| Dividend Yield | 0.71% | 0% |
| Fiscal Year | 2024 | 2024 |
Efficiency & Valuation Duel: The Vital Signs
Financial ratios serve as a company’s DNA, exposing hidden risks and operational strengths crucial for investors.
Amphenol Corporation
Amphenol exhibits strong profitability with a 24.75% ROE and a healthy 15.92% net margin, signaling operational efficiency. Its valuation appears stretched, with a P/E of 34.49 and a P/B of 8.54. Despite a modest 0.71% dividend yield, Amphenol balances shareholder returns with reinvestment in R&D, supporting future growth.
Ouster, Inc.
Ouster struggles with deep losses reflected in a -53.64% ROE and a negative net margin of -87.35%. The stock’s P/E is negative but skewed by losses, while P/B at 3.15 suggests moderate valuation. The company pays no dividends, instead investing heavily in R&D (over 50% of revenue), reflecting a high-growth, high-risk profile.
Premium Valuation vs. Growth Challenges
Amphenol offers a stable, efficient operation with a premium valuation, while Ouster presents a riskier growth story with unfavorable profitability metrics. Investors seeking operational safety may favor Amphenol; those willing to tolerate losses for growth potential might consider Ouster’s profile.
Which one offers the Superior Shareholder Reward?
Amphenol Corporation (APH) pays a modest 0.71% dividend yield with a sustainable 24.5% payout ratio backed by strong free cash flow (1.8B FCF/share). It also pursues steady buybacks, enhancing shareholder returns. Ouster, Inc. (OUST) pays no dividends and burns cash with negative margins and free cash flow, focusing on growth and R&D instead. APH’s balanced dividend and buyback approach offers a more reliable, long-term total return, while OUST remains a high-risk growth play. I favor APH for superior shareholder reward in 2026.
Comparative Score Analysis: The Strategic Profile
The radar chart reveals the fundamental DNA and trade-offs of Amphenol Corporation and Ouster, Inc., highlighting their financial strengths and vulnerabilities:
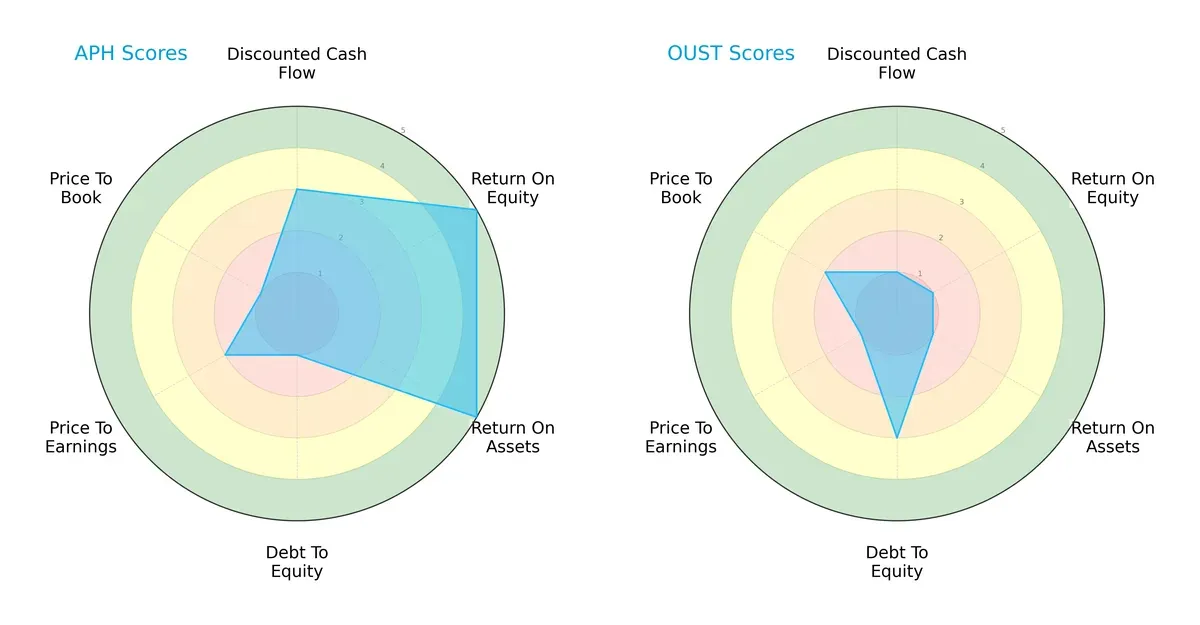
Amphenol dominates in profitability metrics with high ROE (5) and ROA (5) scores, signaling efficient asset and equity utilization. However, it carries a heavy debt burden reflected by a very unfavorable debt-to-equity score (1). Ouster, by contrast, has weaker profitability (ROE and ROA at 1) but maintains a more moderate debt-to-equity position (3). Valuation scores suggest Amphenol is less attractively priced (P/E 2, P/B 1) relative to Ouster’s moderate price-to-book score (2). Overall, Amphenol presents a stronger yet more leveraged profile, while Ouster relies on financial prudence amid operational challenges.
Bankruptcy Risk: Solvency Showdown
Amphenol’s Altman Z-Score of 10.0 far exceeds Ouster’s 4.5, both safely above distress thresholds but signaling vastly different financial resilience levels in this cycle:
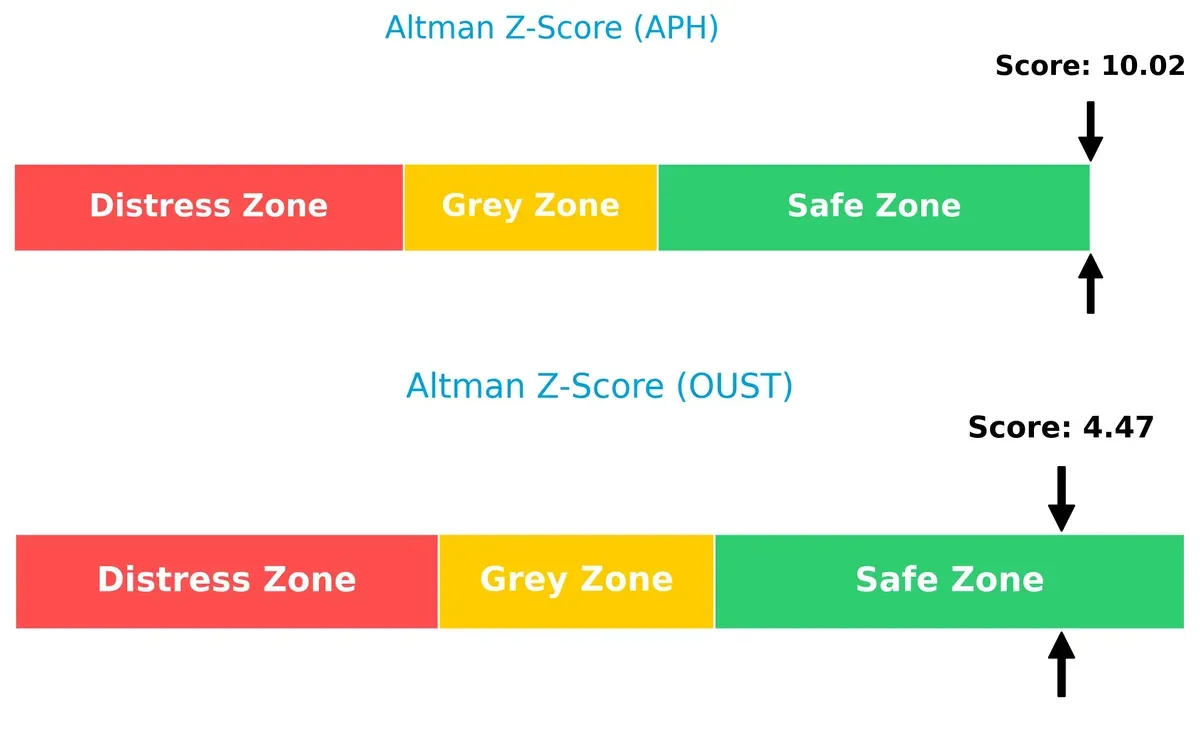
Amphenol’s score suggests robust solvency and a low bankruptcy risk, consistent with mature industrial firms that withstand economic cycles. Ouster’s score, while in the safe zone, indicates moderate financial stability. This difference signals Amphenol’s superior long-term survival prospects, while Ouster remains more vulnerable to downturn shocks.
Financial Health: Quality of Operations
Amphenol’s Piotroski F-Score of 7 versus Ouster’s 4 highlights a significant gap in operational quality and financial strength:
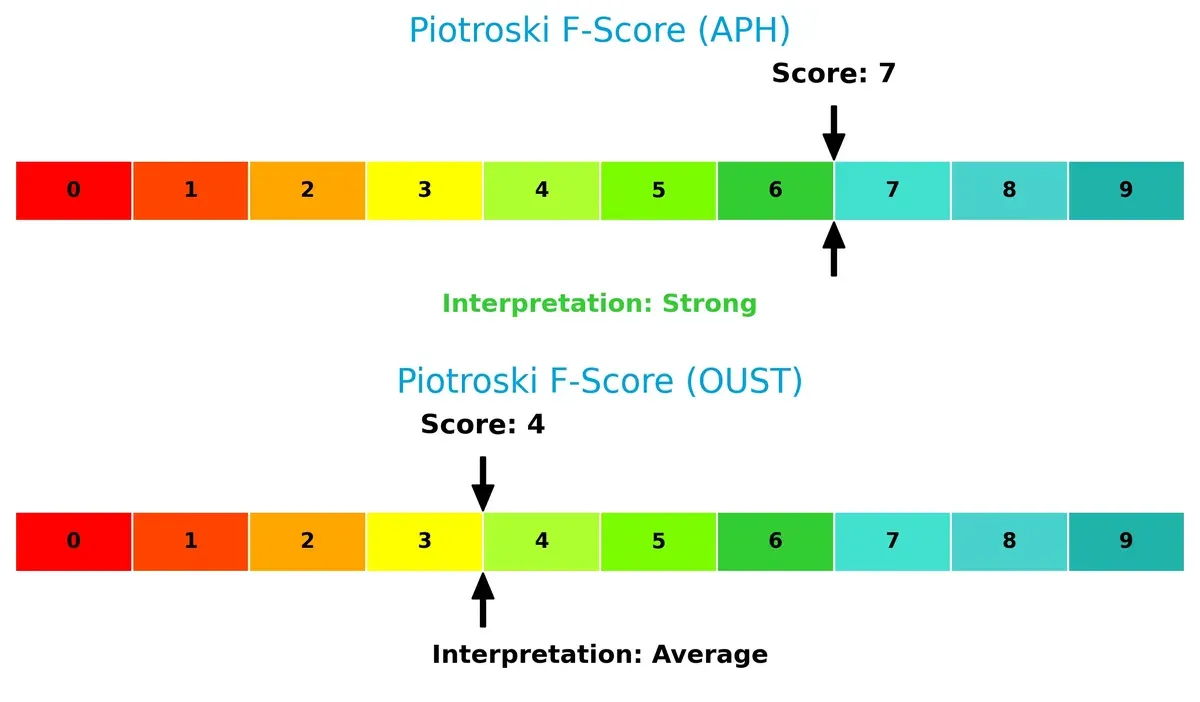
I interpret Amphenol’s score as strong, reflecting solid profitability, liquidity, and efficiency metrics. Ouster’s average score raises caution, suggesting internal weaknesses and potential red flags in financial management. Investors should weigh Amphenol’s superior operational health against its higher leverage risk.
How are the two companies positioned?
This section dissects the operational DNA of Amphenol and Ouster by comparing their revenue distribution and internal dynamics. The goal is to confront their economic moats to reveal which model delivers the most resilient competitive advantage today.
Revenue Segmentation: The Strategic Mix
This visual comparison dissects how Amphenol Corporation and Ouster, Inc. diversify their income streams and highlights their primary sector bets:
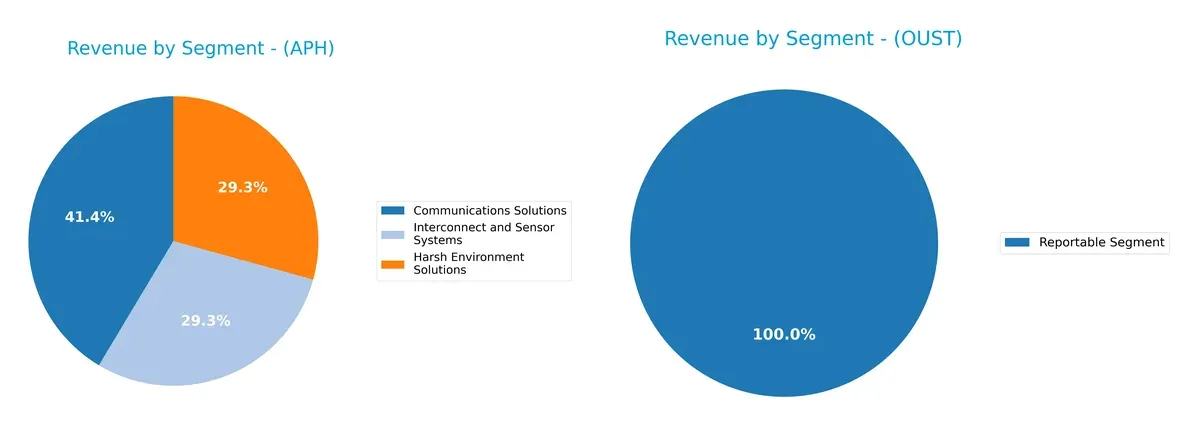
Amphenol dominates with a well-balanced mix: Communications Solutions at $6.38B, Harsh Environment Solutions $4.51B, and Interconnect and Sensor Systems $4.51B. Ouster’s $111M revenue stems from a single Reportable Segment, revealing concentration risk. Amphenol’s diversified portfolio underpins resilience and ecosystem lock-in, while Ouster pivots on a nascent, focused product line with limited revenue breadth. This contrast signals different maturity and market positioning strategies.
Strengths and Weaknesses Comparison
This table compares the Strengths and Weaknesses of Amphenol Corporation and Ouster, Inc.:
Amphenol Corporation Strengths
- Diverse product lines across three major segments
- Strong profitability with 15.9% net margin and 24.7% ROE
- Solid liquidity ratios with current ratio at 2.37
Ouster, Inc. Strengths
- Favorable price-to-earnings ratio despite losses
- Low debt-to-equity at 0.11 indicating conservative leverage
- Good current and quick ratios above 2.5
Amphenol Corporation Weaknesses
- High price-to-book ratio at 8.54 suggests valuation risk
- Dividend yield is low at 0.71%
- Neutral debt levels with moderate leverage ratios
Ouster, Inc. Weaknesses
- Large negative profitability metrics with -87.35% net margin and -53.64% ROE
- Negative interest coverage ratio implies financial stress
- Asset turnover is weak at 0.4, indicating lower operational efficiency
Amphenol’s strengths lie in diversified revenue streams and robust profitability, supporting resilience across market cycles. Ouster shows financial conservatism in leverage but faces significant profitability and efficiency challenges that constrain its current financial health and operational performance.
The Moat Duel: Analyzing Competitive Defensibility
A structural moat is the only shield protecting long-term profits from relentless competitive erosion. Let’s dissect how these moats stand in 2026:
Amphenol Corporation: Diverse Intangible Asset Moat
Amphenol’s moat springs from entrenched intangible assets and broad customer networks. This reflects in its robust 26% EBIT margin and 5.9% ROIC premium over WACC. Expanding harsh environment connectors and fiber optics deepen its moat.
Ouster, Inc.: Emerging Innovation Moat
Ouster relies on breakthrough lidar sensor technology, a high-barrier niche unlike Amphenol’s broad connector footprint. Despite negative EBIT margins, improving profitability and rapid 65% ROIC growth hint at a strengthening competitive position. Market adoption pace will test moat durability.
Legacy Scale vs. Disruptive Growth: The Moat Showdown
Amphenol commands a wider, durable moat with strong economic profits and stable margins. Ouster’s moat is narrower, built on innovation with improving returns but unproven long-term defensibility. Amphenol remains better equipped to defend market share in 2026.
Which stock offers better returns?
Over the past year, Amphenol Corporation and Ouster, Inc. showed strong price increases with distinct recent trading dynamics and volume shifts reflecting changing investor sentiment.
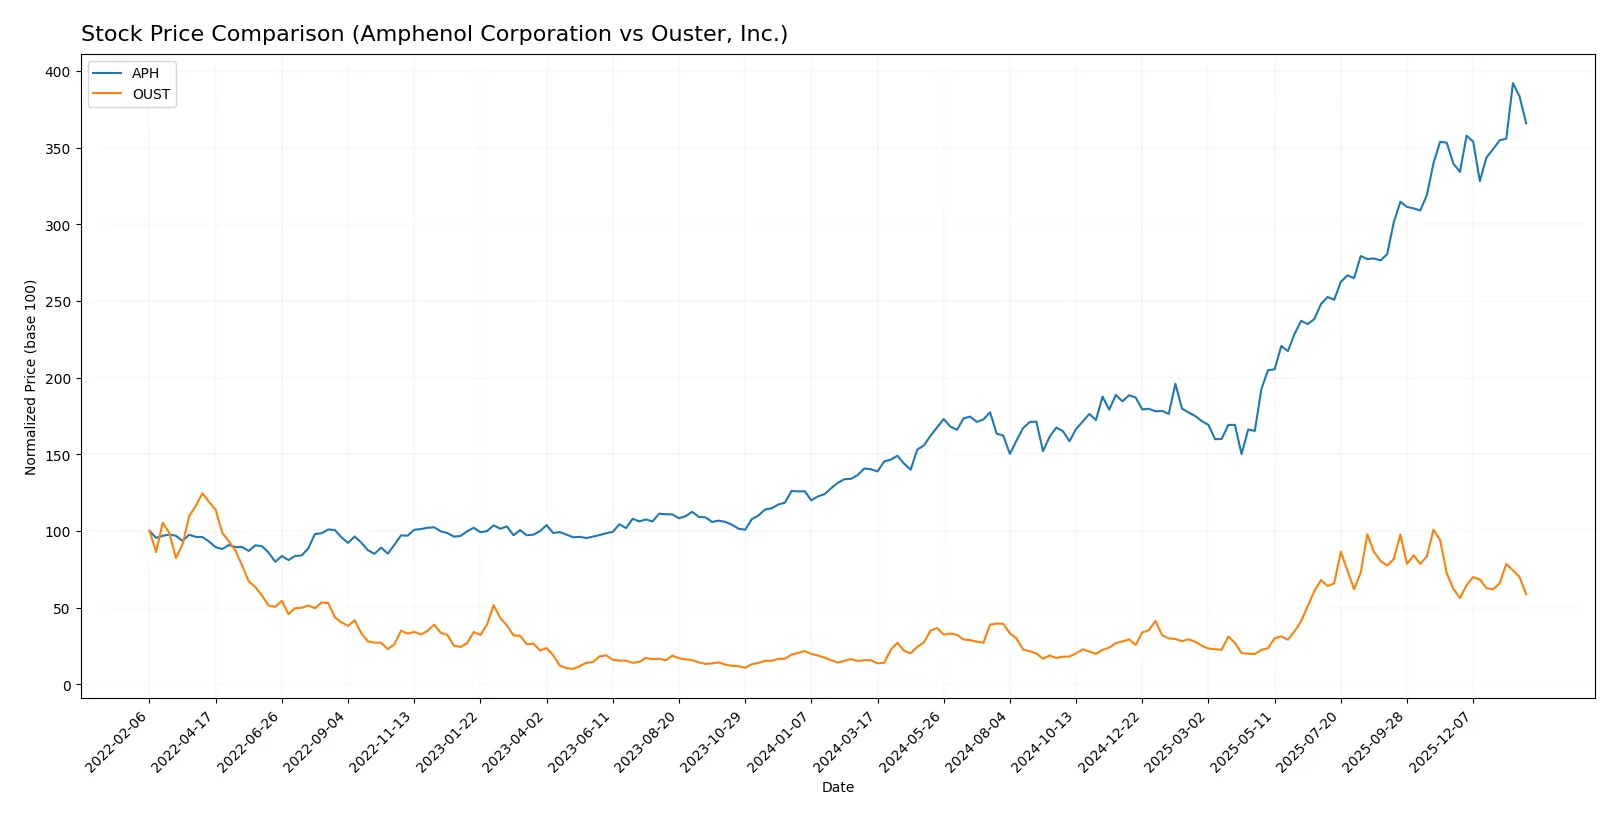
Trend Comparison
Amphenol Corporation’s stock surged 161% over the past year, showing a bullish trend with accelerating momentum and a high volatility of 28.51%. It reached a peak of 154.39, rebounding strongly from 54.65.
Ouster, Inc.’s stock rose 277% over the past year, also bullish with acceleration but lower volatility at 8.57%. It peaked at 35.8 from a low of 4.82, though recent months showed a 5.53% decline.
Comparatively, Ouster outperformed Amphenol in annual gains but experienced a recent bearish phase, while Amphenol maintained steady positive momentum and higher recent buyer activity.
Target Prices
Analysts present a clear target price consensus for both Amphenol Corporation and Ouster, Inc.
| Company | Target Low | Target High | Consensus |
|---|---|---|---|
| Amphenol Corporation | 139 | 210 | 174.13 |
| Ouster, Inc. | 33 | 39 | 36.67 |
The target consensus for Amphenol at 174.13 exceeds its current 144.08 price, signaling upside potential. Ouster’s consensus of 36.67 is nearly double its 20.83 market price, reflecting strong growth expectations.

Don’t Let Luck Decide Your Entry Point
Optimize your entry points with our advanced ProRealTime indicators. You’ll get efficient buy signals with precise price targets for maximum performance. Start outperforming now!
How do institutions grade them?
Amphenol Corporation Grades
The following table shows recent grades from reputable financial institutions for Amphenol Corporation:
| Grading Company | Action | New Grade | Date |
|---|---|---|---|
| Citigroup | Maintain | Buy | 2026-01-29 |
| Barclays | Maintain | Overweight | 2026-01-29 |
| JP Morgan | Maintain | Overweight | 2026-01-27 |
| UBS | Maintain | Buy | 2026-01-14 |
| Citigroup | Maintain | Buy | 2026-01-12 |
| Barclays | Upgrade | Overweight | 2026-01-12 |
| Truist Securities | Maintain | Buy | 2025-12-19 |
| Barclays | Maintain | Equal Weight | 2025-11-13 |
| Citigroup | Maintain | Buy | 2025-10-23 |
| Truist Securities | Maintain | Buy | 2025-10-23 |
Ouster, Inc. Grades
Below are recent grades from credible financial firms for Ouster, Inc.:
| Grading Company | Action | New Grade | Date |
|---|---|---|---|
| Cantor Fitzgerald | Upgrade | Overweight | 2025-11-07 |
| Cantor Fitzgerald | Upgrade | Overweight | 2025-11-06 |
| Rosenblatt | Maintain | Buy | 2025-11-05 |
| WestPark Capital | Maintain | Buy | 2025-11-05 |
| WestPark Capital | Upgrade | Buy | 2025-08-13 |
| Oppenheimer | Maintain | Outperform | 2025-07-16 |
| WestPark Capital | Downgrade | Hold | 2025-06-12 |
| WestPark Capital | Upgrade | Buy | 2025-05-09 |
| Cantor Fitzgerald | Maintain | Overweight | 2025-03-21 |
| WestPark Capital | Maintain | Hold | 2025-03-21 |
Which company has the best grades?
Amphenol Corporation consistently earns “Buy” and “Overweight” grades, reflecting broad institutional confidence. Ouster, Inc. shows mixed ratings with some downgrades but recent upgrades to “Overweight” and “Buy.” Amphenol’s steadier strong grades suggest more stable analyst conviction, potentially appealing to risk-conscious investors.
Risks specific to each company
The following categories identify the critical pressure points and systemic threats facing both firms in the 2026 market environment:
1. Market & Competition
Amphenol Corporation
- Established leader with broad product range faces intense competition in electronics connectors.
Ouster, Inc.
- Emerging lidar technology faces fierce competition from better-funded incumbents and fast innovation cycles.
2. Capital Structure & Debt
Amphenol Corporation
- Moderate debt-to-equity ratio (0.74) with solid interest coverage (16.23), indicating manageable leverage.
Ouster, Inc.
- Low leverage (debt-to-equity 0.11) but negative interest coverage (-51.94), signaling poor ability to service debt.
3. Stock Volatility
Amphenol Corporation
- Beta of 1.214 suggests moderate volatility, typical for a mature technology hardware firm.
Ouster, Inc.
- High beta of 2.935 reflects extreme price swings, exposing investors to significant market risk.
4. Regulatory & Legal
Amphenol Corporation
- Operates globally with exposure to international trade regulations but benefits from established compliance frameworks.
Ouster, Inc.
- Faces evolving regulations on autonomous systems and lidar safety standards, increasing compliance uncertainty.
5. Supply Chain & Operations
Amphenol Corporation
- Large scale and diversified operations reduce supply chain risk despite global disruptions.
Ouster, Inc.
- Smaller scale and reliance on advanced components create higher supply chain vulnerability.
6. ESG & Climate Transition
Amphenol Corporation
- Established ESG policies but pressured to improve climate-related disclosures and reduce carbon footprint.
Ouster, Inc.
- Newer firm with potential to lead in sustainable sensor tech but lacks track record on ESG metrics.
7. Geopolitical Exposure
Amphenol Corporation
- Significant international sales expose it to geopolitical tensions, especially US-China trade frictions.
Ouster, Inc.
- Primarily US-based with limited global footprint, reducing direct geopolitical risk but limiting market access.
Which company shows a better risk-adjusted profile?
Amphenol’s established market position and strong financial metrics offset moderate leverage and geopolitical risks. Ouster’s elevated stock volatility, negative profitability, and uncertain regulatory landscape heighten its risk profile. Amphenol’s Altman Z-score (10.0) and Piotroski score (7) confirm a robust financial position. In contrast, Ouster’s weaker Z-score (4.47) and average Piotroski (4) reveal financial fragility. The most impactful risk for Amphenol is geopolitical exposure amid global trade tensions. For Ouster, the critical threat is its negative cash flow and earnings, undermining financial stability. Given these factors, Amphenol offers a superior risk-adjusted profile in 2026.
Final Verdict: Which stock to choose?
Amphenol Corporation’s superpower lies in its durable competitive advantage and outstanding capital efficiency. Its steadily growing ROIC well above WACC signals consistent value creation. A point of vigilance is its elevated valuation multiples, demanding cautious entry. It suits portfolios aiming for stable, long-term growth with moderate risk tolerance.
Ouster, Inc. offers a strategic moat rooted in rapid revenue expansion and innovation in lidar technology. Its low leverage and strong liquidity profile provide relative safety versus Amphenol’s more leveraged stance. However, ongoing losses and negative returns highlight operational risks. It fits portfolios targeting high-growth opportunities willing to accept volatility.
If you prioritize durable profitability and proven value creation, Amphenol outshines as the compelling choice due to its robust financial health and steady earnings. However, if you seek aggressive growth with exposure to cutting-edge tech, Ouster offers superior growth potential despite its riskier profile. Both cases require careful risk management aligned with investor appetite.
Disclaimer: Investment carries a risk of loss of initial capital. The past performance is not a reliable indicator of future results. Be sure to understand risks before making an investment decision.
Go Further
I encourage you to read the complete analyses of Amphenol Corporation and Ouster, Inc. to enhance your investment decisions: