Home > Comparison > Technology > APH vs NOVT
The strategic rivalry between Amphenol Corporation and Novanta Inc. shapes the hardware, equipment, and parts industry. Amphenol operates as a capital-intensive global connector and sensor systems provider, while Novanta excels in photonics and precision motion components with a focus on medical and industrial applications. This analysis pits scale and diversification against specialized innovation to determine which trajectory offers the superior risk-adjusted return for a diversified portfolio in 2026.
Table of contents
Companies Overview
Amphenol Corporation and Novanta Inc. stand as pivotal players in the hardware and equipment sector.
Amphenol Corporation: Global Connector Powerhouse
Amphenol dominates the electrical and electronic connector market worldwide. It generates revenue by designing and manufacturing connectors and interconnect systems across harsh environments, communications, and sensor segments. Its 2026 strategy emphasizes expanding value-added products and bolstering sales channels to OEMs and service providers across automotive, aerospace, and IT markets.
Novanta Inc.: Precision Photonics Innovator
Novanta leads in photonics and precision motion components for medical and industrial OEMs. Its revenue stems from photonics-based laser solutions, medical-grade visualization, and precision motion systems. In 2026, Novanta focuses on advancing integrated technologies in laser and imaging products to capture specialized medical and industrial applications worldwide.
Strategic Collision: Similarities & Divergences
Both companies excel in hardware components serving high-tech OEMs but diverge sharply in product focus—Amphenol with connectors and interconnect systems; Novanta with photonics and precision motion. Their primary battleground lies in industrial and medical tech supply chains. Amphenol offers broad scale and diversified markets, while Novanta targets niche innovation-driven segments, shaping distinct investment profiles.
Income Statement Comparison
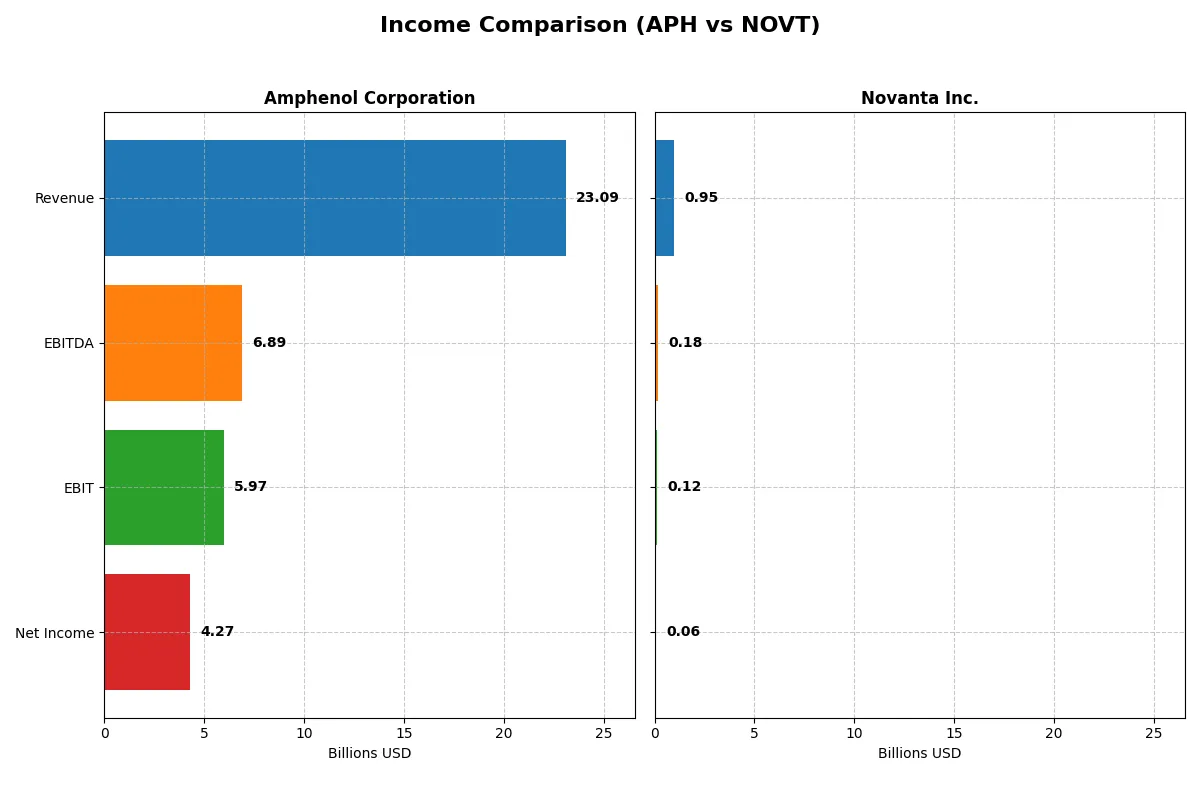
This data dissects the core profitability and scalability of both corporate engines to reveal who dominates the bottom line:
| Metric | Amphenol Corporation (APH) | Novanta Inc. (NOVT) |
|---|---|---|
| Revenue | 23B | 949M |
| Cost of Revenue | 14.6B | 528M |
| Operating Expenses | 2.55B | 311M |
| Gross Profit | 8.5B | 422M |
| EBITDA | 6.89B | 180M |
| EBIT | 5.97B | 124M |
| Interest Expense | 368M | 31M |
| Net Income | 4.27B | 64M |
| EPS | 3.51 | 1.78 |
| Fiscal Year | 2025 | 2024 |
Income Statement Analysis: The Bottom-Line Duel
This income statement comparison reveals which company converts revenue into profit most efficiently, reflecting the true power of their business models.
Amphenol Corporation Analysis
Amphenol’s revenue surged from 10.9B in 2021 to 23.1B in 2025, more than doubling in five years. Net income expanded even faster, reaching 4.3B in 2025. The gross margin holds firm at 36.9%, while net margin improved to 18.5%, signaling robust cost control and operational leverage. The 2025 figures show accelerating momentum with an 85% EBIT growth, underscoring strong efficiency gains.
Novanta Inc. Analysis
Novanta’s revenue grew steadily from 590M in 2020 to 949M in 2024, a 61% increase over five years. Net income also rose but at a slower pace, hitting 64M in 2024. The company boasts a higher gross margin of 44.4%, yet net margin trails at 6.8%, reflecting heavier operating costs. Recent EPS declined by 12%, indicating margin pressure despite modest revenue growth.
Verdict: Margin Power vs. Revenue Scale
Amphenol dominates in scale and margin expansion, delivering superior profitability and rapid earnings growth. Novanta excels in gross margin but struggles to translate it into net profits, limiting its bottom-line strength. For investors prioritizing efficiency and earnings momentum, Amphenol’s profile offers a more compelling fundamental advantage.
Financial Ratios Comparison
These vital ratios act as a diagnostic tool to expose underlying fiscal health, valuation premiums, and capital efficiency for the companies compared below:
| Ratios | Amphenol Corporation (APH) | Novanta Inc. (NOVT) |
|---|---|---|
| ROE | 24.8% | 8.6% |
| ROIC | 14.9% | 7.3% |
| P/E | 34.5 | 85.7 |
| P/B | 8.54 | 7.37 |
| Current Ratio | 2.37 | 2.58 |
| Quick Ratio | 1.75 | 1.72 |
| D/E | 0.74 | 0.63 |
| Debt-to-Assets | 34.0% | 33.9% |
| Interest Coverage | 15.1 | 3.51 |
| Asset Turnover | 0.71 | 0.68 |
| Fixed Asset Turnover | 7.26 | 6.08 |
| Payout ratio | 24.6% | 0% |
| Dividend yield | 0.71% | 0% |
| Fiscal Year | 2024 | 2024 |
Efficiency & Valuation Duel: The Vital Signs
Financial ratios serve as a company’s DNA, exposing hidden risks and operational strengths critical for investment analysis.
Amphenol Corporation
Amphenol delivers robust profitability with a 24.75% ROE and a healthy 15.92% net margin, reflecting operational efficiency. Its valuation appears stretched, given a high 34.49 P/E and 8.54 P/B ratios. Shareholders receive a modest 0.71% dividend yield, suggesting a cautious income approach while balancing reinvestment in steady growth.
Novanta Inc.
Novanta shows weaker profitability, with a low 8.59% ROE and 6.75% net margin, signaling operational challenges. The stock trades at a steep 85.7 P/E and 7.37 P/B, indicating expensive valuation relative to earnings. Novanta pays no dividend, focusing capital on aggressive R&D, which accounts for over 10% of revenue, aiming for long-term innovation.
Premium Valuation vs. Operational Safety
Amphenol offers stronger profitability and a balanced risk profile despite stretched valuation. Novanta’s high valuation contrasts with weaker returns and no income, increasing risk. Investors prioritizing operational stability and moderate yield may prefer Amphenol, while those seeking growth through R&D could consider Novanta’s profile.
Which one offers the Superior Shareholder Reward?
Amphenol Corporation (APH) pays a modest 0.71% dividend yield with a sensible 24.5% payout ratio, well covered by strong free cash flow (FCF). Its buyback program is moderate, supporting shareholder returns steadily. Novanta Inc. (NOVT) pays no dividend, reinvesting heavily in growth and R&D, reflected in its robust free cash flow per share of 3.93 and consistent capital expenditure. NOVT’s buybacks are negligible, indicating a growth-first approach. I see APH’s balanced dividend and buyback model as more sustainable for income-focused investors. However, NOVT targets capital appreciation through reinvestment. For 2026 total return, I favor APH for steady income and capital discipline, while NOVT suits growth seekers willing to accept valuation risk.
Comparative Score Analysis: The Strategic Profile
The radar chart reveals the fundamental DNA and trade-offs of Amphenol Corporation and Novanta Inc., exposing their core financial strengths and weaknesses:
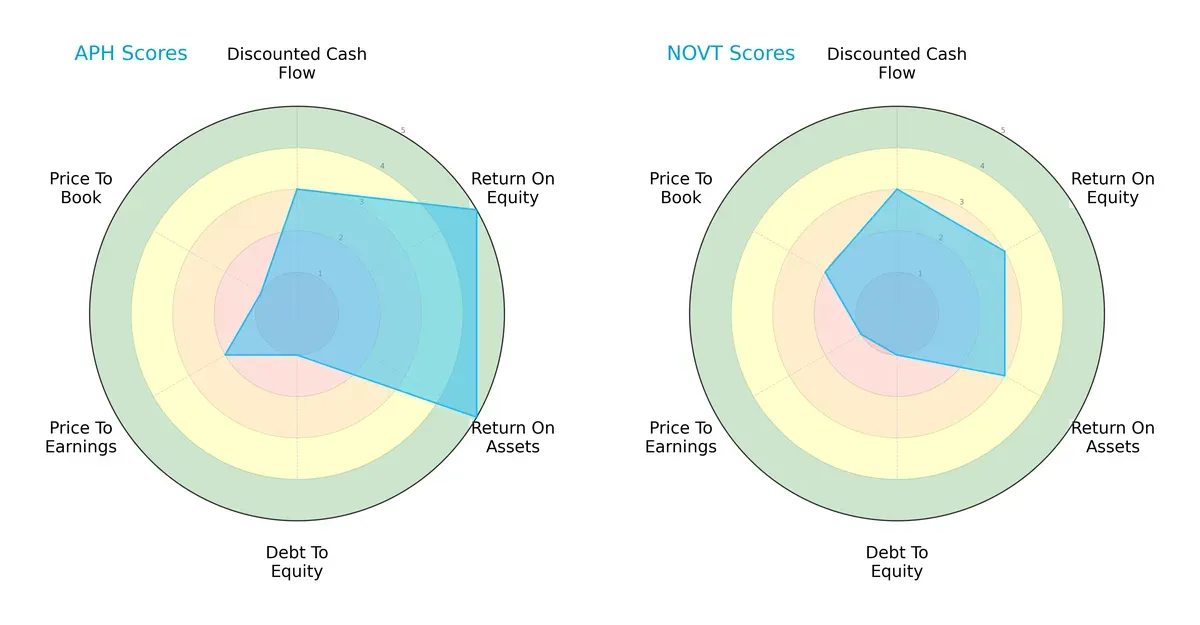
Amphenol leads with superior ROE (5 vs. 3) and ROA (5 vs. 3), indicating stronger profitability and asset utilization. Both share weak debt-to-equity scores (1), signaling high leverage risk. Amphenol shows moderate valuation scores, while Novanta’s valuation metrics are less favorable. Overall, Amphenol presents a more balanced profile, while Novanta relies on moderate cash flow and weaker profitability.
Bankruptcy Risk: Solvency Showdown
Amphenol’s Altman Z-Score (10.02) far exceeds Novanta’s (5.65), signaling a stronger solvency position in this cycle:
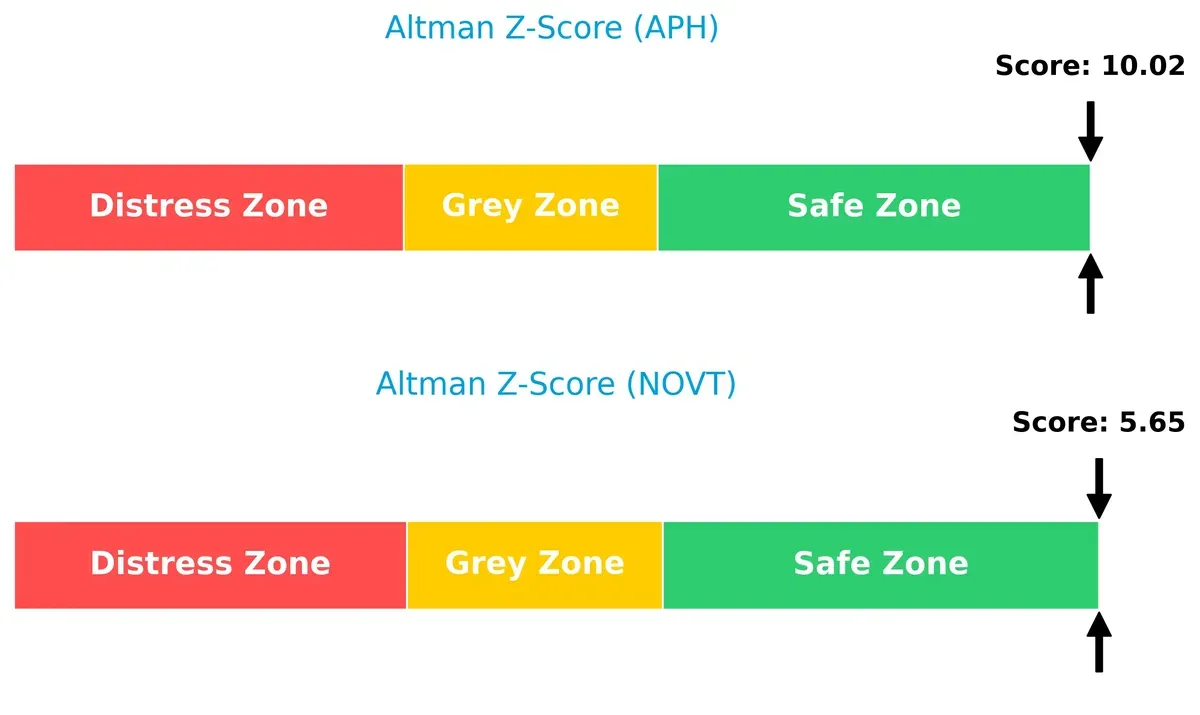
Both companies reside safely above distress thresholds, but Amphenol’s higher score provides a wider margin against long-term bankruptcy risk, reflecting robust financial stability.
Financial Health: Quality of Operations
Amphenol’s Piotroski F-Score of 7 outperforms Novanta’s 6, indicating stronger operational quality and internal financial health:
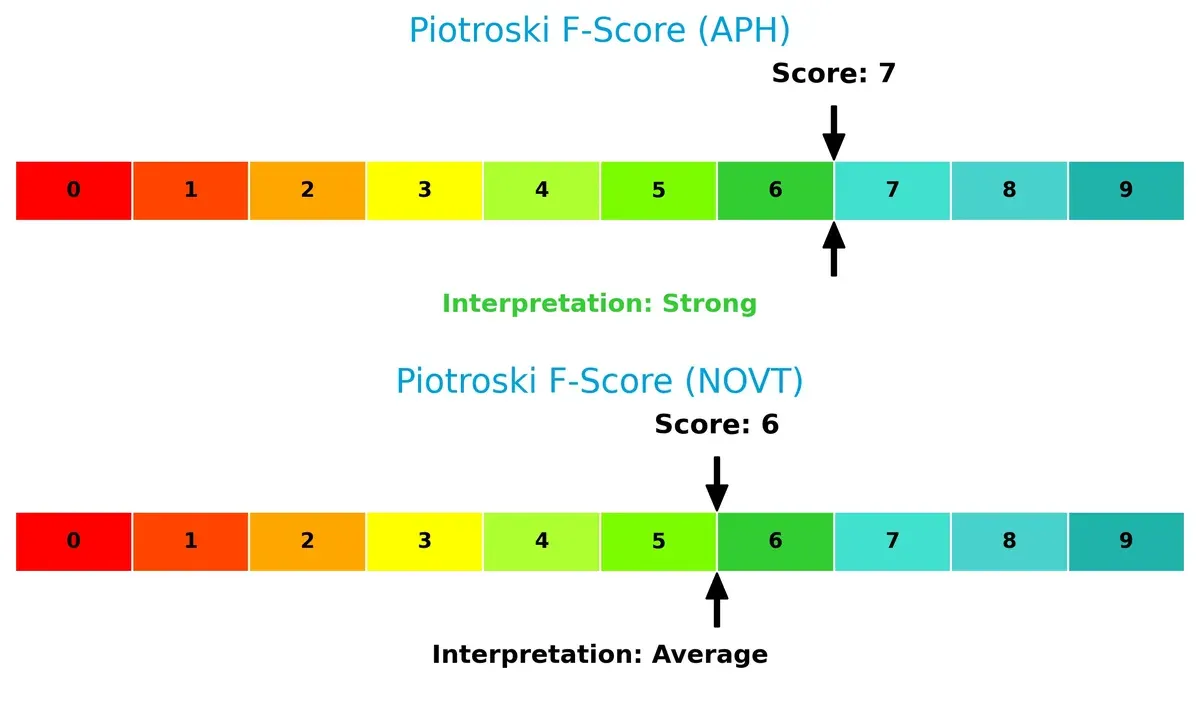
While both firms display solid fundamentals, Amphenol’s higher score suggests fewer red flags in profitability, leverage, and efficiency metrics, reinforcing its superior financial strength.
How are the two companies positioned?
This section dissects Amphenol and Novanta’s operational DNA by comparing their revenue distribution and internal dynamics. The goal is to confront their economic moats and identify the more resilient, sustainable competitive advantage.
Revenue Segmentation: The Strategic Mix
This comparison dissects how Amphenol Corporation and Novanta Inc. diversify income streams and highlights their primary sector bets:
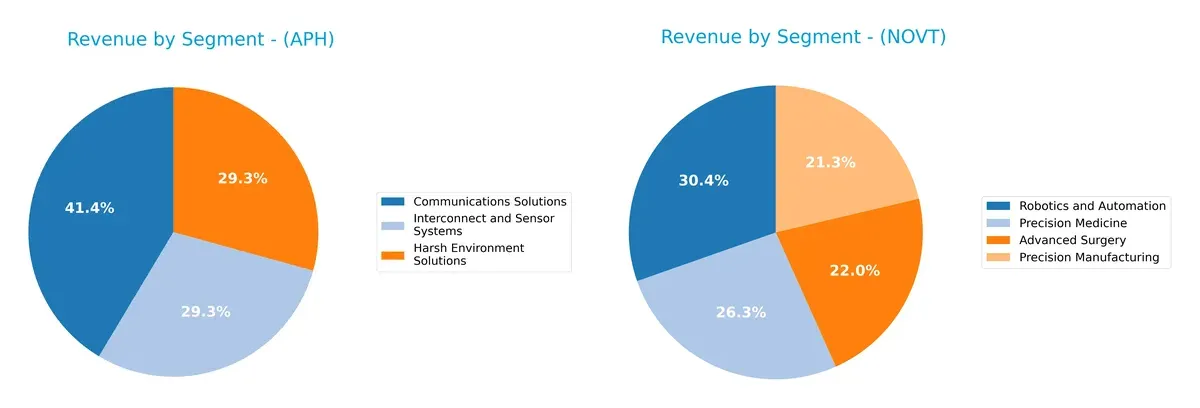
Amphenol anchors its revenue in three nearly balanced segments: Communications Solutions at $6.38B, Harsh Environment Solutions at $4.51B, and Interconnect and Sensor Systems at $4.51B. This diversification reduces concentration risk and supports resilience across industrial cycles. Novanta, by contrast, spans smaller segments around $200M to $290M each, showing a more fragmented but focused approach in precision manufacturing and medical technologies, which could drive niche innovation but faces scaling challenges.
Strengths and Weaknesses Comparison
This table compares the Strengths and Weaknesses of Amphenol Corporation and Novanta Inc.:
Amphenol Corporation Strengths
- Broad product diversification across Communications, Harsh Environment, and Sensor Systems
- Strong profitability with 15.92% net margin and 24.75% ROE
- Favorable liquidity ratios with current ratio of 2.37
- Global presence with substantial revenue from US, China, and other foreign locations
- High fixed asset turnover at 7.26 indicates efficient asset use
Novanta Inc. Strengths
- Diversified business in Precision Manufacturing, Robotics, Advanced Surgery, and Precision Medicine
- Favorable liquidity with current ratio of 2.58
- Solid presence in the US and Europe, with growing Asia-Pacific sales
- Positive fixed asset turnover of 6.08 supports operational efficiency
Amphenol Corporation Weaknesses
- High valuation multiples with P/E at 34.49 and P/B at 8.54 could signal overpricing
- Dividend yield low at 0.71%, limiting income appeal
- Neutral debt levels and asset turnover may restrict leverage benefits
Novanta Inc. Weaknesses
- Lower profitability with 6.75% net margin and 8.59% ROE
- Unfavorable WACC at 10.87% increases capital costs
- Very high P/E of 85.7 and no dividend yield weaken income and valuation appeal
- Interest coverage at 3.95 suggests limited buffer for debt servicing
Amphenol’s strengths lie in its robust profitability, diversified segments, and global footprint. Novanta shows diversification and geographic reach but faces challenges in profitability and valuation. Both companies must balance growth strategies with financial discipline amid market risks.
The Moat Duel: Analyzing Competitive Defensibility
A structural moat is the only reliable shield protecting long-term profits from relentless competitive erosion in dynamic industries:
Amphenol Corporation: Diverse Product Integration and Scale Advantage
Amphenol’s moat stems from broad product integration and scale, reflected in robust ROIC exceeding WACC by nearly 6%. Its 26% net margin growth signals durable pricing power. Expansion into harsh environment and sensor markets in 2026 should deepen this advantage.
Novanta Inc.: Specialized Photonics and Precision Technology Niche
Novanta relies on specialized photonics and precision motion components, a narrower moat than Amphenol’s scale. Despite a rising ROIC trend, its ROIC remains below WACC, indicating value destruction. Growth in medical laser and vision tech offers upside but remains less defensible.
Scale and Diversification vs. Niche Innovation
Amphenol’s wider moat, supported by strong and growing ROIC well above cost of capital, outmatches Novanta’s narrower, less profitable niche. Amphenol stands better equipped to defend and expand its leading market share in 2026.
Which stock offers better returns?
Over the past 12 months, Amphenol Corporation surged sharply, while Novanta Inc. faced a significant decline, despite recent signs of recovery in both stocks.
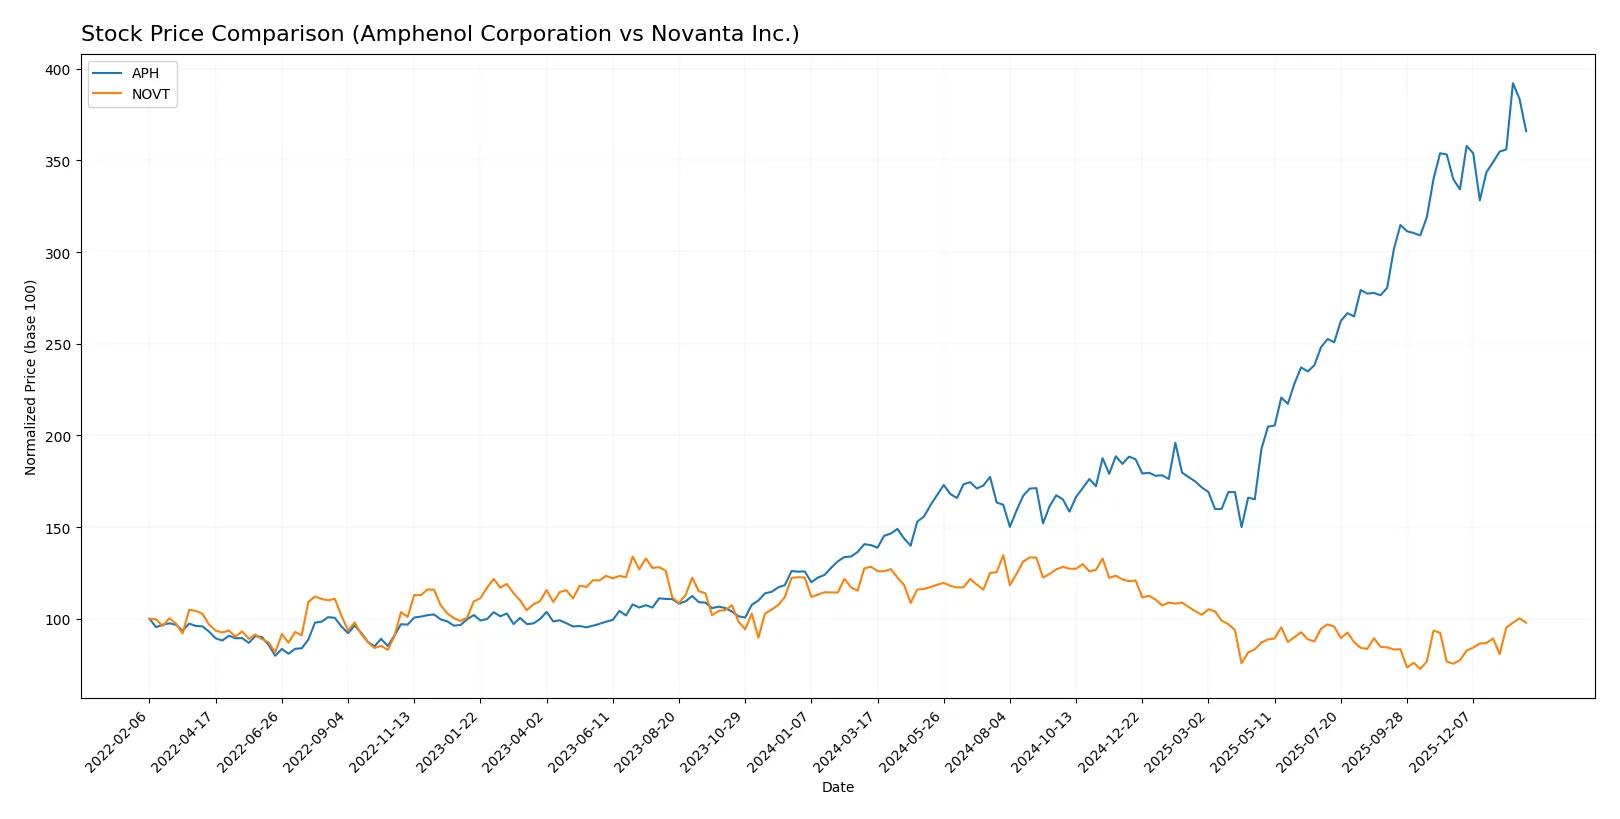
Trend Comparison
Amphenol’s stock rose 161% over the past year, showing a strong bullish trend with accelerating momentum and a high price range from 54.65 to 154.39.
Novanta’s stock fell 23.8% over the same period, reflecting a bearish trend despite recent acceleration and a rebound of 29.6% since November 2025.
Amphenol achieved the highest market performance with a sustained 161% gain, outperforming Novanta’s overall decline despite Novanta’s recent upward correction.
Target Prices
Analysts provide a clear target price consensus for Amphenol Corporation and Novanta Inc.
| Company | Target Low | Target High | Consensus |
|---|---|---|---|
| Amphenol Corporation | 139 | 210 | 174.13 |
| Novanta Inc. | 160 | 160 | 160 |
The consensus targets for Amphenol suggest upside potential from the $144 current price, reflecting confidence in its diversified hardware portfolio. Novanta’s fixed target at $160 also implies a moderate gain over its $134 price, indicating steady growth expectations.

Don’t Let Luck Decide Your Entry Point
Optimize your entry points with our advanced ProRealTime indicators. You’ll get efficient buy signals with precise price targets for maximum performance. Start outperforming now!
How do institutions grade them?
Amphenol Corporation Grades
Here are recent grades from major financial institutions for Amphenol Corporation:
| Grading Company | Action | New Grade | Date |
|---|---|---|---|
| Citigroup | Maintain | Buy | 2026-01-29 |
| Barclays | Maintain | Overweight | 2026-01-29 |
| JP Morgan | Maintain | Overweight | 2026-01-27 |
| UBS | Maintain | Buy | 2026-01-14 |
| Citigroup | Maintain | Buy | 2026-01-12 |
| Barclays | Upgrade | Overweight | 2026-01-12 |
| Truist Securities | Maintain | Buy | 2025-12-19 |
| Barclays | Maintain | Equal Weight | 2025-11-13 |
| Citigroup | Maintain | Buy | 2025-10-23 |
| Truist Securities | Maintain | Buy | 2025-10-23 |
Novanta Inc. Grades
Below are recent grades from notable financial institutions for Novanta Inc.:
| Grading Company | Action | New Grade | Date |
|---|---|---|---|
| Baird | Maintain | Neutral | 2025-08-11 |
| Baird | Maintain | Neutral | 2025-03-03 |
| Baird | Maintain | Neutral | 2024-11-06 |
| Baird | Maintain | Neutral | 2024-08-07 |
| Baird | Maintain | Neutral | 2023-05-11 |
| Baird | Maintain | Neutral | 2023-05-10 |
| William Blair | Upgrade | Outperform | 2022-05-11 |
| William Blair | Upgrade | Outperform | 2022-05-10 |
| Berenberg | Maintain | Hold | 2020-11-13 |
| Baird | Maintain | Neutral | 2020-05-13 |
Which company has the best grades?
Amphenol Corporation consistently receives Buy and Overweight ratings from top firms, indicating stronger institutional confidence. Novanta’s Neutral and Hold grades suggest a more cautious stance. Investors may interpret Amphenol’s higher grades as a signal of greater perceived upside potential.
Risks specific to each company
The following categories identify critical pressure points and systemic threats facing Amphenol Corporation and Novanta Inc. in the 2026 market environment:
1. Market & Competition
Amphenol Corporation
- Strong market presence with diversified industrial and tech segments. Faces intense competition in connectors and sensors.
Novanta Inc.
- Niche player in photonics and precision motion, but limited scale intensifies competitive pressures.
2. Capital Structure & Debt
Amphenol Corporation
- Moderate leverage with debt/equity at 0.74 and strong interest coverage (16.23x).
Novanta Inc.
- Similar debt ratio (0.63) but weaker interest coverage (3.95x) raises refinancing risk concerns.
3. Stock Volatility
Amphenol Corporation
- Beta of 1.21, implying moderate sensitivity to market swings.
Novanta Inc.
- Higher beta at 1.60, indicating more volatile stock price and higher investor risk.
4. Regulatory & Legal
Amphenol Corporation
- Operates globally with standard regulatory compliance risks typical in hardware and defense tech.
Novanta Inc.
- Exposure to medical device regulations adds complexity and potential liability.
5. Supply Chain & Operations
Amphenol Corporation
- Large scale and diversified supply chain mitigates disruption risk but complexity remains in global operations.
Novanta Inc.
- More specialized supply chain vulnerable to component shortages and single-source risks.
6. ESG & Climate Transition
Amphenol Corporation
- Focused on sustainability with progressive ESG initiatives but faces pressure to decarbonize manufacturing.
Novanta Inc.
- Emerging ESG programs; slower adaptation may expose it to investor scrutiny and regulatory costs.
7. Geopolitical Exposure
Amphenol Corporation
- Significant international sales expose it to trade tensions and geopolitical risks, especially US-China relations.
Novanta Inc.
- Smaller global footprint but still vulnerable to geopolitical disruptions in key markets.
Which company shows a better risk-adjusted profile?
Amphenol faces key risks in geopolitical exposure but exhibits a stronger capital structure and lower stock volatility. Novanta’s highest risk lies in elevated stock volatility and regulatory complexity. Amphenol’s robust interest coverage and diversified operations give it a superior risk-adjusted profile. The high beta and moderate interest coverage of Novanta underscore its heightened risk in a volatile 2026 market.
Final Verdict: Which stock to choose?
Amphenol Corporation’s superpower lies in its durable competitive advantage, evidenced by a growing ROIC well above its cost of capital. It consistently creates value through operational excellence and robust margin expansion. A point of vigilance is its premium valuation, which may temper near-term upside. It suits an aggressive growth portfolio seeking strong profitability and momentum.
Novanta Inc. offers a strategic moat in its specialized technology niche with steady R&D investment supporting innovation. Its balance sheet shows more caution amid slower margin expansion and weaker returns, providing a safety profile that appears less volatile than Amphenol’s stretched multiples. This fits well with GARP investors who value steady growth with some margin of safety.
If you prioritize value creation with strong profitability and growth acceleration, Amphenol outshines as the compelling choice due to its proven capital efficiency and robust income growth. However, if you seek a more conservative growth approach with technological niche protection, Novanta offers better stability despite its weaker current profitability and valuation risk.
Disclaimer: Investment carries a risk of loss of initial capital. The past performance is not a reliable indicator of future results. Be sure to understand risks before making an investment decision.
Go Further
I encourage you to read the complete analyses of Amphenol Corporation and Novanta Inc. to enhance your investment decisions: