Home > Comparison > Technology > APH vs MKSI
The strategic rivalry between Amphenol Corporation and MKS Inc. shapes the competitive landscape of the Technology sector’s Hardware, Equipment & Parts industry. Amphenol operates as a large-scale manufacturer of electrical connectors and interconnect systems, while MKS focuses on precision instruments and process control solutions. This analysis explores their contrasting operational models and investment profiles to determine which offers superior risk-adjusted returns for a diversified portfolio.
Table of contents
Companies Overview
Amphenol Corporation and MKS Inc. stand as prominent players in the competitive hardware and equipment sector.
Amphenol Corporation: Global Connector & Sensor Leader
Amphenol Corporation dominates as a global manufacturer of electrical and fiber optic connectors. Its core revenue comes from harsh environment solutions, communications, and interconnect sensor systems. In 2026, it focuses on expanding its high-speed data and sensor-based products, leveraging a broad product portfolio to service automotive, aerospace, and IT markets worldwide.
MKS Inc.: Precision Instrumentation Innovator
MKS Inc. excels in process control and instrumentation systems for semiconductor and industrial markets. It generates revenue through vacuum and analysis solutions, laser technologies, and PCB manufacturing equipment. Its strategic emphasis lies in advancing laser-based systems and photonic products to support semiconductor fabrication and life sciences sectors in 2026.
Strategic Collision: Similarities & Divergences
Both companies operate in hardware but adopt divergent philosophies: Amphenol prioritizes broad, diversified connector systems, while MKS focuses on specialized precision instrumentation. They compete primarily in industrial and semiconductor segments, but Amphenol’s scale contrasts with MKS’s niche innovation. Their investment profiles reflect this split—Amphenol offers stability through diversification; MKS presents growth potential via technological specialization.
Income Statement Comparison
This data dissects the core profitability and scalability of both corporate engines to reveal who dominates the bottom line:
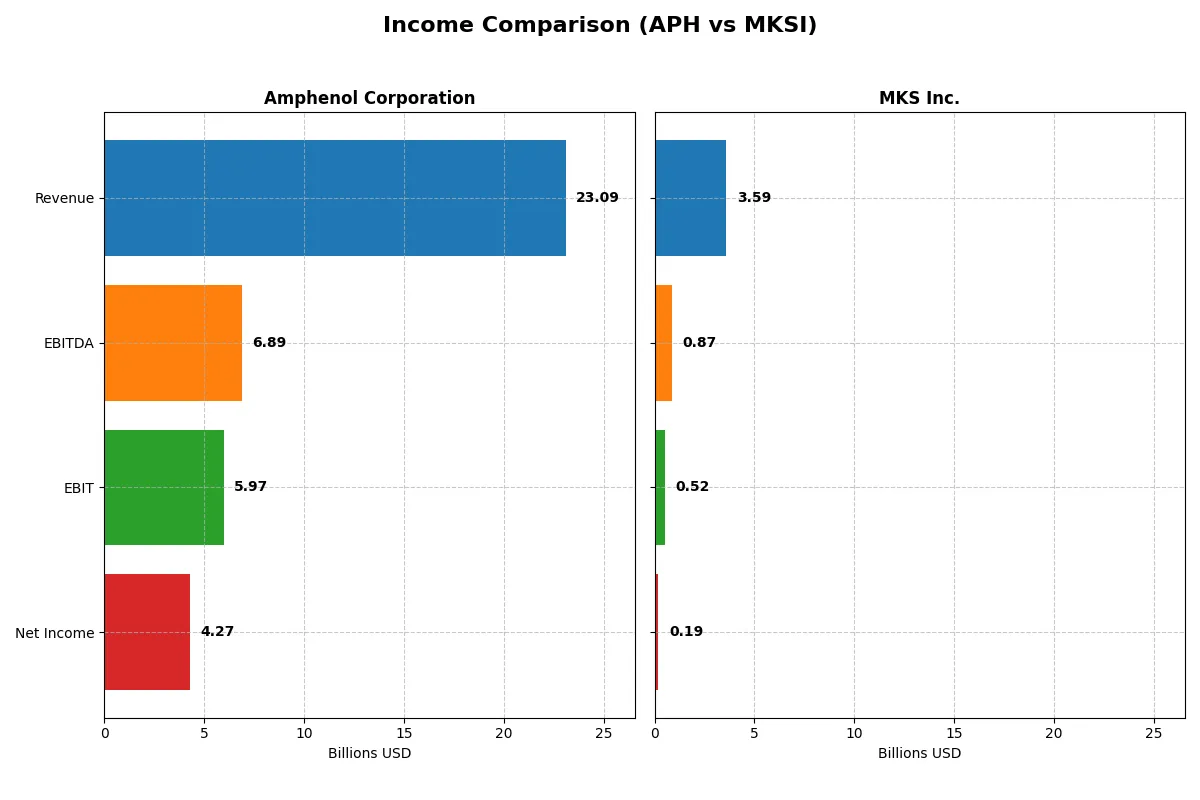
| Metric | Amphenol Corporation (APH) | MKS Inc. (MKSI) |
|---|---|---|
| Revenue | 23.1B | 3.59B |
| Cost of Revenue | 14.6B | 1.88B |
| Operating Expenses | 2.55B | 1.21B |
| Gross Profit | 8.52B | 1.71B |
| EBITDA | 6.89B | 870M |
| EBIT | 5.97B | 522M |
| Interest Expense | 368M | 345M |
| Net Income | 4.27B | 190M |
| EPS | 3.51 | 2.82 |
| Fiscal Year | 2025 | 2024 |
Income Statement Analysis: The Bottom-Line Duel
This income statement comparison reveals the true efficiency and growth dynamics of two distinct corporate engines over recent years.
Amphenol Corporation Analysis
Amphenol’s revenue surged from $10.9B in 2021 to $23.1B in 2025, more than doubling over five years. Net income followed suit, climbing from $1.59B to $4.27B, reflecting robust operational leverage. Its gross margin holds steady near 37%, while net margin improved to 18.5%, signaling disciplined cost control and expanding profitability. The latest year shows accelerating momentum with 52% revenue growth and 16% net margin expansion.
MKS Inc. Analysis
MKS exhibits a more volatile trajectory with revenues rising from $2.95B in 2021 to $3.59B in 2024, a 54% increase, but net income plunged from $551M to $190M, including a steep loss in 2023. Gross margin remains higher at 47.6%, yet net margin languishes at 5.3%, reflecting heavy interest burdens and erratic profitability. The latest year shows stable revenue but a significant turnaround in net margin and EPS, indicating recovering operational efficiency.
Margin Expansion vs. Earnings Stability
Amphenol clearly outperforms with consistent top-line growth and expanding net margins, translating into strong bottom-line gains. MKS’s higher gross margin fails to offset erratic net income and elevated interest expenses, producing weaker earnings stability. For investors prioritizing durable earnings growth, Amphenol’s profile offers more reliable value creation and operational discipline.
Financial Ratios Comparison
These vital ratios act as a diagnostic tool to expose the underlying fiscal health, valuation premiums, and capital efficiency of the companies analyzed below:
| Ratios | Amphenol Corporation (APH) | MKS Inc. (MKSI) |
|---|---|---|
| ROE | 24.8% | 8.2% |
| ROIC | 14.9% | 6.3% |
| P/E | 34.5 | 37.0 |
| P/B | 8.54 | 3.03 |
| Current Ratio | 2.37 | 3.19 |
| Quick Ratio | 1.75 | 2.04 |
| D/E | 0.74 | 2.06 |
| Debt-to-Assets | 34.0% | 55.6% |
| Interest Coverage | 15.1 | 1.44 |
| Asset Turnover | 0.71 | 0.42 |
| Fixed Asset Turnover | 7.26 | 3.55 |
| Payout Ratio | 24.6% | 31.1% |
| Dividend Yield | 0.71% | 0.84% |
| Fiscal Year | 2024 | 2024 |
Efficiency & Valuation Duel: The Vital Signs
Financial ratios act as a company’s DNA, unveiling hidden risks and operational strengths often missed by headline figures.
Amphenol Corporation
Amphenol delivers robust profitability with a 24.75% ROE and a strong 15.92% net margin, reflecting operational excellence. However, its valuation appears stretched, trading at a high P/E of 34.49 and P/B of 8.54. Shareholders receive modest dividends (0.71% yield), while the company invests consistently in R&D, signaling growth focus over buybacks.
MKS Inc.
MKS shows weaker profitability, with an 8.18% ROE and a modest 5.3% net margin, indicating operational challenges. Its valuation is similarly steep at a P/E of 36.98, despite a lower P/B of 3.03. The firm struggles with high leverage and limited cash flow, offering a low dividend yield of 0.84%, prioritizing R&D over shareholder returns.
Premium Valuation vs. Operational Safety
Amphenol balances strong profitability and solid liquidity despite a premium valuation, offering a better risk-reward profile. MKS faces operational and financial headwinds with high leverage and weaker returns. Investors seeking stability and efficient capital use may favor Amphenol’s profile, while those tolerating risk might consider MKS’s growth bets.
Which one offers the Superior Shareholder Reward?
I compare Amphenol Corporation (APH) and MKS Inc. (MKSI) by their shareholder return strategies. APH pays a modest dividend yield around 0.7%-1.0% with a consistent payout ratio near 25%. Its buyback program is steady but moderate, supporting sustainable returns. MKSI offers a comparable dividend yield near 0.8%-1.0%, but with a more volatile payout ratio and heavier debt load. MKSI’s buybacks amplify total returns when profitable, but recent margin volatility and debt risk undermine sustainability. APH’s balanced dividend and disciplined buybacks provide a safer, more consistent shareholder reward in 2026. I favor APH for superior total return potential with lower financial risk.
Comparative Score Analysis: The Strategic Profile
The radar chart reveals the fundamental DNA and trade-offs of Amphenol Corporation and MKS Inc., highlighting their financial strengths and valuation nuances:
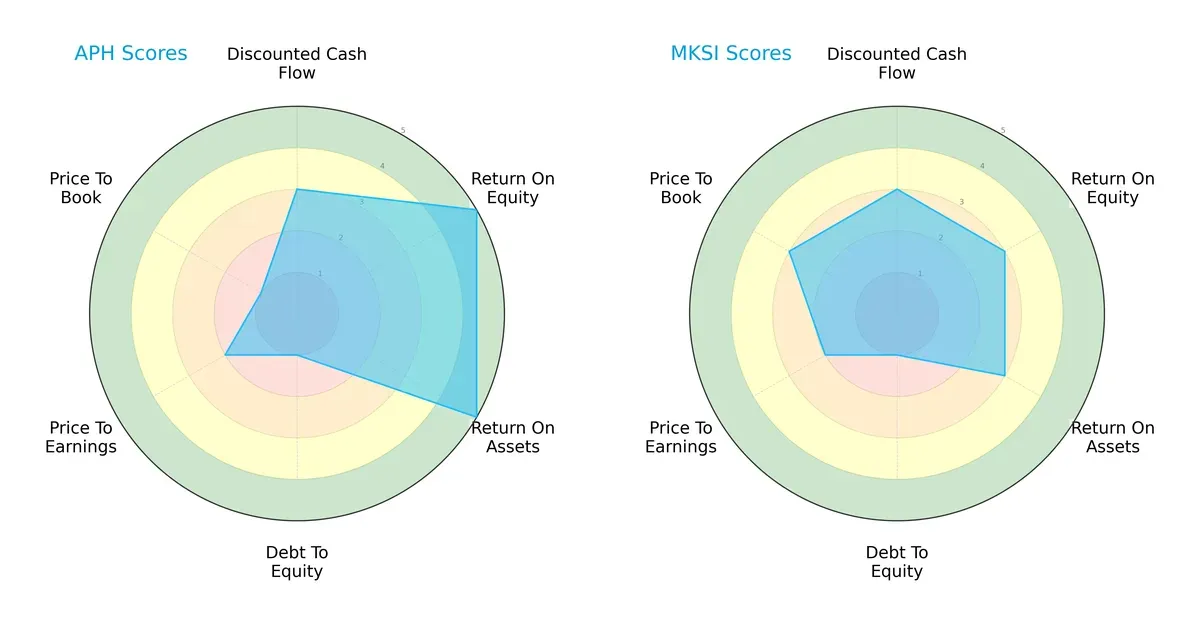
Amphenol outperforms MKS in profitability metrics, with higher ROE and ROA scores (5 vs. 3), indicating more efficient asset and equity utilization. Both firms share moderate discounted cash flow scores (3) and weak debt-to-equity profiles (1), signaling elevated leverage risks. Amphenol’s valuation scores lag (P/B at 1 vs. 3 for MKS), reflecting potential market skepticism or asset undervaluation. Overall, Amphenol presents a more profit-driven profile, while MKS shows a slightly more balanced valuation stance.
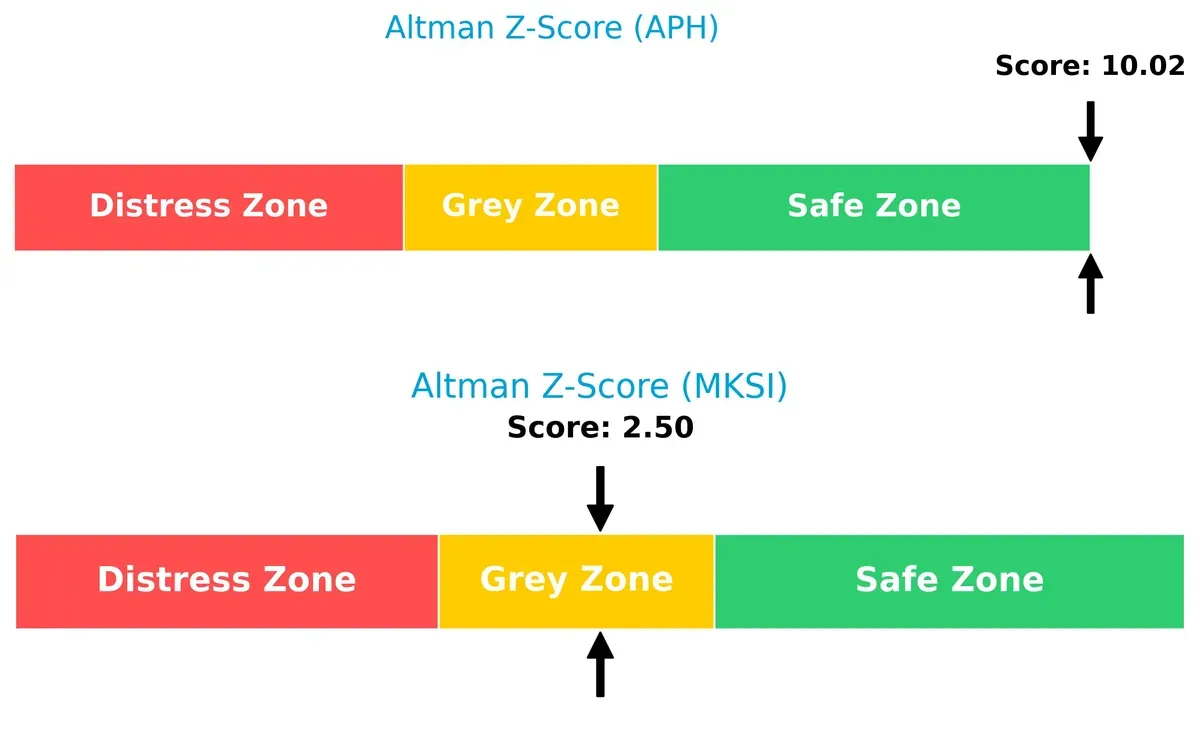
Bankruptcy Risk: Solvency Showdown
Amphenol’s Altman Z-Score of 10.0 places it securely in the safe zone, whereas MKS’s 2.5 score signals moderate bankruptcy risk in the grey zone, underscoring divergent long-term survival prospects in this cycle:
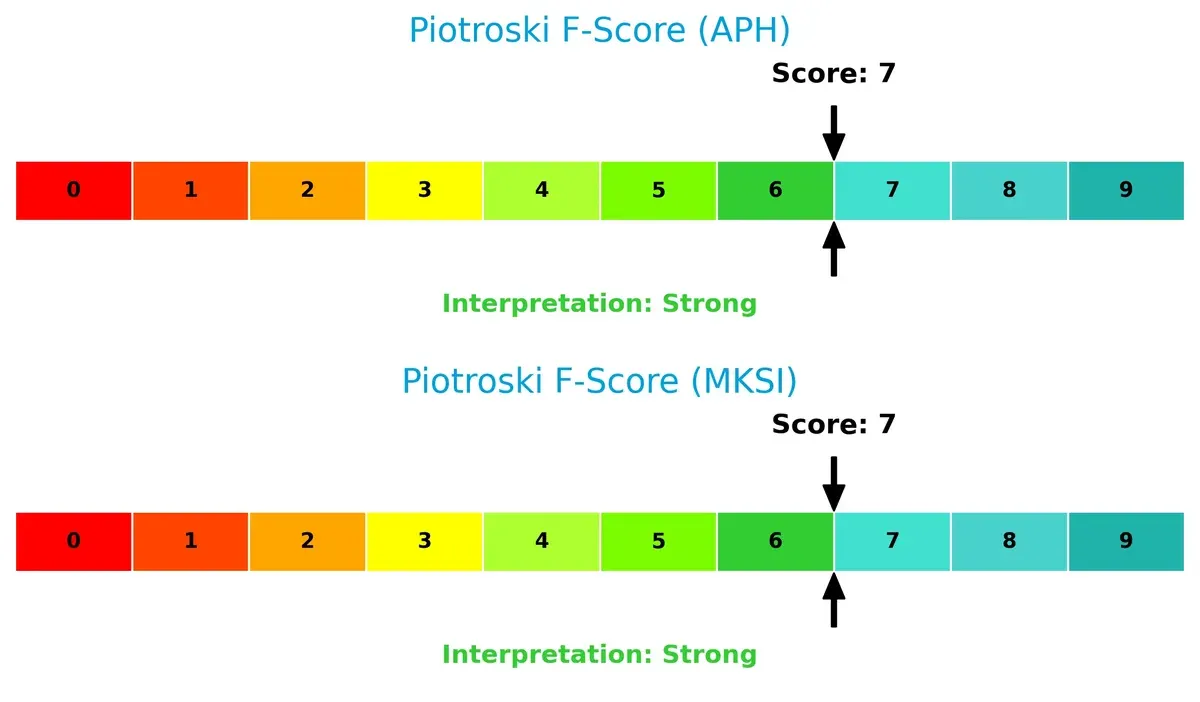
Financial Health: Quality of Operations
Both companies score a robust 7 on the Piotroski F-Score, indicating strong financial health and operational quality without internal red flags, reflecting disciplined management and solid fundamentals:
How are the two companies positioned?
This section dissects the operational DNA of Amphenol and MKS by comparing their revenue distribution by segment and internal dynamics. The goal is to confront their economic moats and identify which model offers the most resilient, sustainable competitive advantage today.
Revenue Segmentation: The Strategic Mix
The following visual comparison dissects how Amphenol Corporation and MKS Inc. diversify their income streams and where their primary sector bets lie:
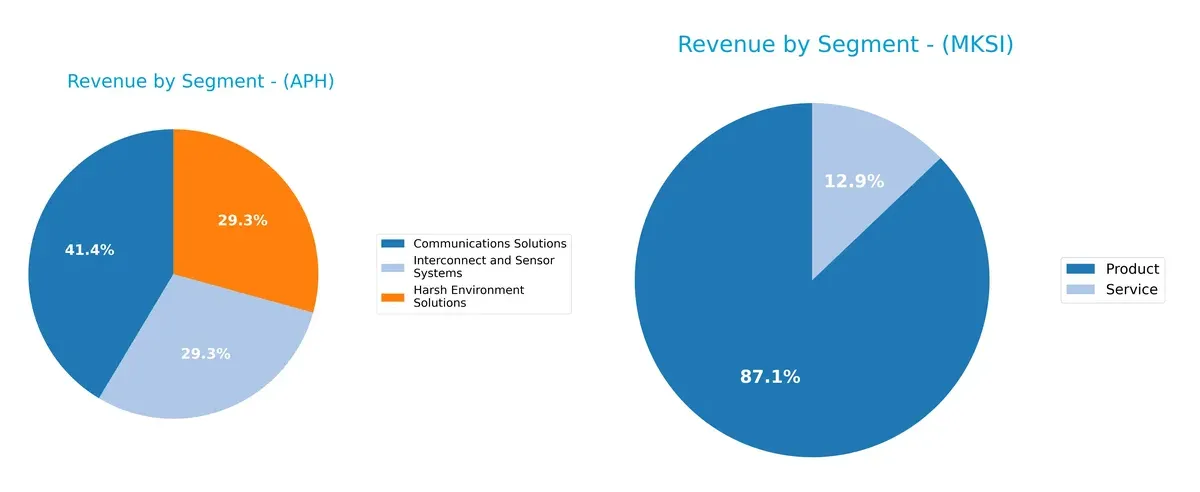
Amphenol dominates with three major segments: Communications Solutions at $6.38B, Harsh Environment Solutions at $4.51B, and Interconnect and Sensor Systems at $4.51B, showing balanced diversification. MKS Inc. relies heavily on its Product segment at $3.12B, with Service trailing at $462M, indicating concentration risk. Amphenol’s broad mix supports ecosystem lock-in, while MKS pivots on product innovation but faces vulnerability from narrower revenue sources.
Strengths and Weaknesses Comparison
This table compares the Strengths and Weaknesses of Amphenol Corporation and MKS Inc.:
Amphenol Corporation Strengths
- Diversified revenue streams across Communications, Harsh Environment, and Interconnect systems
- Strong profitability with 15.9% net margin and 24.8% ROE
- Solid liquidity ratios, current ratio 2.37 and quick ratio 1.75
- High fixed asset turnover at 7.26 indicating efficient asset use
- Significant global presence with balanced US, China, and other foreign sales
MKS Inc. Strengths
- Product and service segmentation supports market reach
- Favorable quick ratio of 2.04 shows short-term liquidity strength
- Fixed asset turnover of 3.55 reflects asset efficiency
- Geographic diversification includes China, US, Japan, and others
Amphenol Corporation Weaknesses
- High valuation multiples with PE at 34.5 and PB at 8.54 may limit upside
- Dividend yield low at 0.71%
- Moderate debt levels with DE 0.74 and debt-to-assets 34%
- Neutral weighted average cost of capital at 9.01%
MKS Inc. Weaknesses
- Low profitability with net margin 5.3% and ROE 8.2%
- Unfavorable WACC at 11.3% increases capital costs
- Weak liquidity indicated by poor current ratio 3.19 (deemed unfavorable)
- High leverage with DE 2.06 and debt-to-assets 56%
- Low interest coverage at 1.51 signals risk in servicing debt
- High PE 37 and low PB 3.03 suggest valuation concerns
Amphenol demonstrates superior profitability and liquidity with a well-diversified business model. MKS faces challenges on profitability and leverage despite some liquidity strengths. These factors will influence each company’s strategic options and risk profiles going forward.
The Moat Duel: Analyzing Competitive Defensibility
A structural moat is the only thing protecting long-term profits from relentless competition and margin erosion. Let’s dissect the competitive moats of Amphenol Corporation and MKS Inc.:
Amphenol Corporation: Durable Value Creator with Cost Advantage
Amphenol’s moat stems from its cost advantage and diversified product portfolio in harsh environment connectors. Its high and growing ROIC (5.9% above WACC) reflects operational efficiency and margin stability. Expansion into fiber optics and power distribution likely deepens this moat in 2026.
MKS Inc.: Specialized Technology with Fragile Profitability
MKS relies on specialized instruments and process control solutions, a more niche intangible asset moat. However, its declining ROIC and negative spread versus WACC signal value destruction. Despite recent EBIT growth, profitability challenges threaten its competitive positioning and future expansion.
Cost Dominance vs. Specialized Innovation: Who Holds the Moat Stronger?
Amphenol’s cost advantage and growing profitability create a wider, more durable moat than MKS’s eroding returns on capital. I see Amphenol better equipped to defend and expand its market share amidst intensifying competition.
Which stock offers better returns?
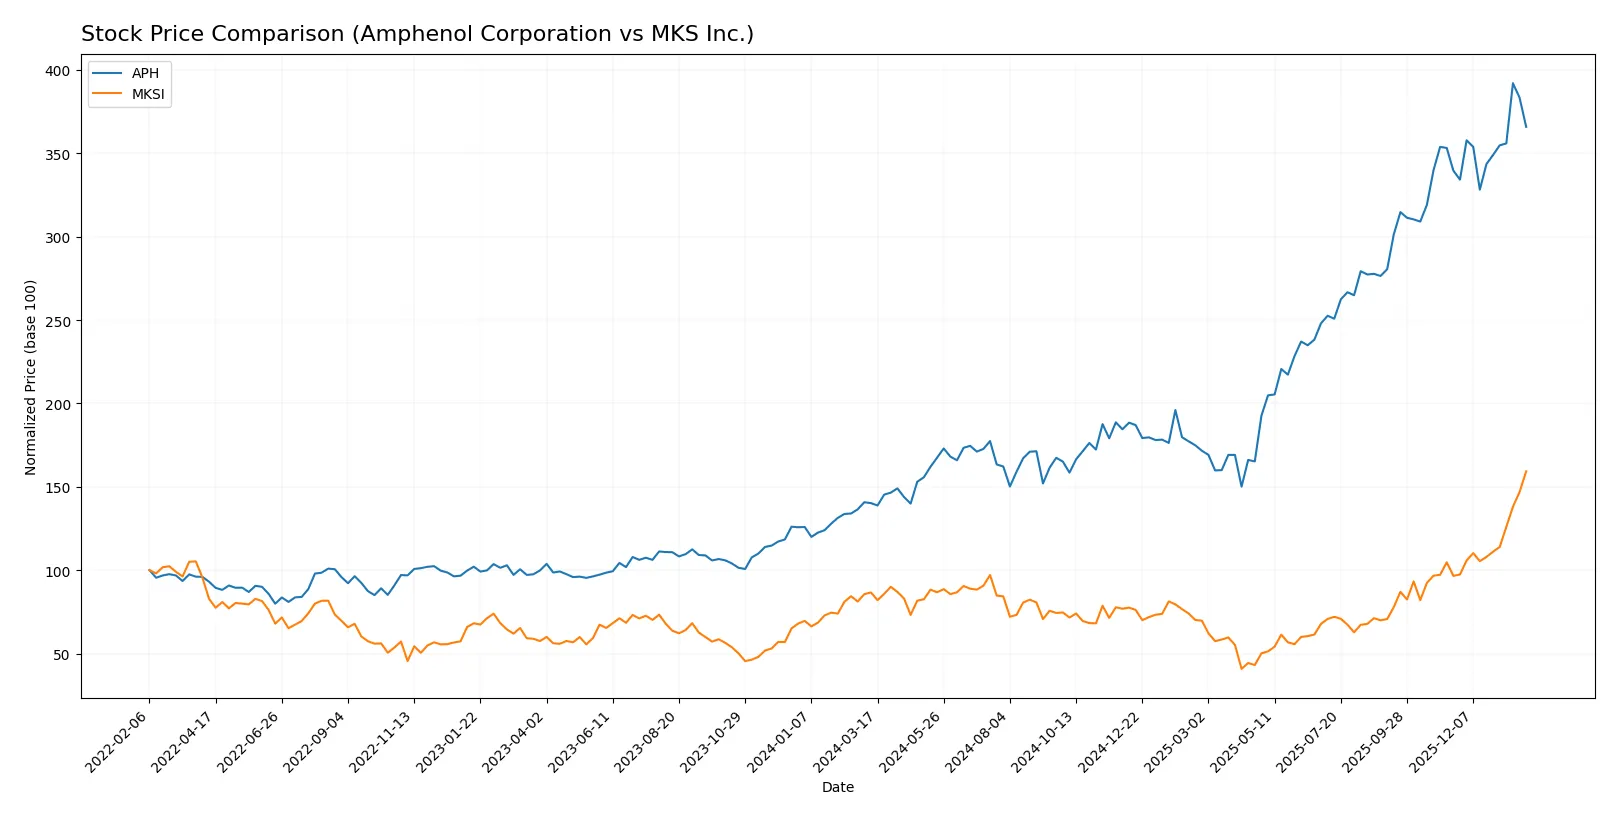
The past year showed strong bullish momentum for both stocks, with Amphenol accelerating steadily and MKS experiencing a sharper recent price surge.
Trend Comparison
Amphenol’s stock rose 161% over the past 12 months, showing acceleration and a high volatility of 28.51. It peaked at 154.39 and bottomed at 54.65.
MKS gained 83.81% over the same period, also accelerating with higher volatility at 29.22. It hit a 235.41 high and dropped to 60.29 low.
Between the two, Amphenol delivered the highest market performance, nearly doubling MKS’s price increase during this timeframe.
Target Prices
Analysts present a bullish consensus on both Amphenol Corporation and MKS Inc., signaling upside potential from current levels.
| Company | Target Low | Target High | Consensus |
|---|---|---|---|
| Amphenol Corporation | 139 | 210 | 174.13 |
| MKS Inc. | 151 | 265 | 223 |
Amphenol’s consensus target exceeds its $144 price by 21%, implying moderate appreciation. MKS trades near $235 with a 5% upside to consensus, reflecting strong growth expectations.

Don’t Let Luck Decide Your Entry Point
Optimize your entry points with our advanced ProRealTime indicators. You’ll get efficient buy signals with precise price targets for maximum performance. Start outperforming now!
How do institutions grade them?
Amphenol Corporation Grades
The latest institutional grades for Amphenol Corporation highlight consistent buy and overweight ratings:
| Grading Company | Action | New Grade | Date |
|---|---|---|---|
| Citigroup | Maintain | Buy | 2026-01-29 |
| Barclays | Maintain | Overweight | 2026-01-29 |
| JP Morgan | Maintain | Overweight | 2026-01-27 |
| UBS | Maintain | Buy | 2026-01-14 |
| Citigroup | Maintain | Buy | 2026-01-12 |
| Barclays | Upgrade | Overweight | 2026-01-12 |
| Truist Securities | Maintain | Buy | 2025-12-19 |
| Barclays | Maintain | Equal Weight | 2025-11-13 |
| Citigroup | Maintain | Buy | 2025-10-23 |
| Truist Securities | Maintain | Buy | 2025-10-23 |
MKS Inc. Grades
MKS Inc. maintains solid buy and overweight ratings from several reputable firms:
| Grading Company | Action | New Grade | Date |
|---|---|---|---|
| Needham | Maintain | Buy | 2026-01-22 |
| TD Cowen | Maintain | Buy | 2026-01-22 |
| Morgan Stanley | Maintain | Overweight | 2026-01-22 |
| Wells Fargo | Maintain | Equal Weight | 2026-01-22 |
| B of A Securities | Maintain | Buy | 2026-01-22 |
| Cantor Fitzgerald | Maintain | Overweight | 2026-01-20 |
| Keybanc | Maintain | Overweight | 2026-01-16 |
| Wells Fargo | Maintain | Equal Weight | 2026-01-15 |
| Needham | Maintain | Buy | 2026-01-13 |
| B of A Securities | Maintain | Buy | 2026-01-13 |
Which company has the best grades?
Both companies receive predominantly buy and overweight ratings, reflecting positive institutional sentiment. Amphenol shows slightly more upgrades recently, potentially indicating stronger momentum. Investors may perceive Amphenol as marginally better favored.
Risks specific to each company
The following categories identify the critical pressure points and systemic threats facing both firms in the 2026 market environment:
1. Market & Competition
Amphenol Corporation
- Operates globally in diverse segments, facing intense competition in connectors and sensors.
MKS Inc.
- Serves niche semiconductor and industrial markets with specialized laser and vacuum tech; faces aggressive innovation demands.
2. Capital Structure & Debt
Amphenol Corporation
- Moderate leverage with debt/equity at 0.74; interest coverage strong at 16.23x, signaling robust debt management.
MKS Inc.
- High leverage with debt/equity at 2.06 and weak interest coverage of 1.51x, increasing default risk.
3. Stock Volatility
Amphenol Corporation
- Beta at 1.21 indicates moderate volatility aligned with tech sector norms.
MKS Inc.
- Beta at 1.92 signals high volatility, raising risk for risk-averse investors.
4. Regulatory & Legal
Amphenol Corporation
- Primarily hardware and connectors with standard regulatory exposure; no major legal flags noted.
MKS Inc.
- Operates in highly regulated semiconductor and photonics sectors with potential compliance challenges.
5. Supply Chain & Operations
Amphenol Corporation
- Large global footprint exposes it to supply chain disruptions but diversified across industries.
MKS Inc.
- More specialized supply chain; vulnerable to semiconductor industry cyclicality and raw material shortages.
6. ESG & Climate Transition
Amphenol Corporation
- Moderate ESG risks; no dominant climate transition concerns but pressure from industrial clients grows.
MKS Inc.
- Faces increasing ESG scrutiny due to energy-intensive manufacturing and semiconductor supply chain carbon footprint.
7. Geopolitical Exposure
Amphenol Corporation
- Significant international operations, including China, exposing it to trade tensions and tariffs.
MKS Inc.
- Also exposed to global trade tensions, particularly in semiconductor markets sensitive to US-China relations.
Which company shows a better risk-adjusted profile?
Amphenol’s strongest risk lies in market competition and geopolitical exposure but it benefits from a solid capital structure and stable cash flow. MKS struggles with high leverage and low interest coverage, amplifying financial risk despite niche market advantages. Amphenol’s Altman Z-Score of 10.02 places it safely away from bankruptcy risk, while MKS’s 2.50 signals moderate distress. The stark contrast in debt metrics and interest coverage justifies my concern for MKS’s financial stability. Overall, Amphenol offers a superior risk-adjusted profile in the 2026 environment.
Final Verdict: Which stock to choose?
Amphenol Corporation’s superpower lies in its durable competitive advantage, consistently generating strong returns on invested capital well above its cost of capital. Its robust income growth and operational efficiency make it a cash machine, though its premium valuation and leverage require vigilance. It suits an Aggressive Growth portfolio seeking resilience and expansion.
MKS Inc. benefits from a niche strategic moat in specialized technology and innovation, with a current ratio signaling solid liquidity. However, its declining profitability, high leverage, and weaker capital efficiency mark it as riskier relative to Amphenol. It fits a GARP investor aiming for selective growth backed by operational turnaround potential.
If you prioritize sustained value creation and operational strength, Amphenol outshines with a clear moat and accelerating momentum. However, if you seek a higher-risk growth scenario with turnaround prospects, MKS offers potential albeit with financial headwinds and greater volatility. Each presents a distinct analytical scenario for different investor profiles.
Disclaimer: Investment carries a risk of loss of initial capital. The past performance is not a reliable indicator of future results. Be sure to understand risks before making an investment decision.
Go Further
I encourage you to read the complete analyses of Amphenol Corporation and MKS Inc. to enhance your investment decisions: